
Today I will launch a quantification team’s official Oil_Hedging two-oil hedging EA. In fact, this hedging strategy is based on the West Texas light crude oil futures in the United States and the North Sea Brent crude oil futures in the United Kingdom. The editor was as early as March. There is a post on the blog, which introduces the regression process and principle in detail from a mathematical point of view.
Today we will formally introduce the principle of this ea from the perspective of financial engineering and how it differs from crude oil hedging on the market.
In financial engineering, it is often not easy to hedge futures contracts, partly for the following reasons:
- The asset that needs to hedge price risk may not be exactly the same as the underlying asset of the futures contract;
- The hedger cannot determine the exact time to buy or sell the asset;
- The hedger may need to liquidate the contract before the futures expires.
The above problems have caused the so-called basis risk. Here we first introduce the concept of “basis”.
Contents of this article
Basis
The usual definition: basis = spot price of the hedged asset-futures price
If the hedged asset is the same as the underlying asset of the futures contract, the basis should be close to zero when the futures expires, and the basis may be positive or negative before the expiry date of the futures contract.

Next, a concept of “cross-hedging” is introduced.
Cross hedge
The assets that the hedger intends to hedge are inconsistent with the underlying assets of the futures contract. In this case, hedging is called cross hedging. In the case of cross-hedging, the basis risk is generally greater. For example, there is an example in financial engineering: For example, an airline needs to hedge against the risks caused by large fluctuations in the price of jet fuel, but there is no futures contract for jet fuel as the basic asset in the market, so it can use civil fuel oil futures contracts. Hedging the price risk of aviation fuel oil. Then another concept is introduced: the “hedging ratio” in cross-hedging.
Hedge ratio
The definition of hedging ratio: the ratio of the number of positions held in the futures contract to the number of risk exposures of the hedged asset. When the two underlying assets that need to be hedged are exactly the same, the hedge ratio is equal to 1. However, in cross-hedging, the hedging ratio used by the hedger should minimize the variance in the value of the entire hedged asset portfolio. The optimal hedge ratio depends on the relationship between the changes in the prices of the two underlying assets to be hedged. Construct a linear regression model.
Δ S = α + h * Δ F + ε
Where α is the intercept term, ε is the residual term, and h* is the slope of the best fitting straight line generated when Δ S is linearly regressed to Δ F, which represents the optimal hedge ratio. Since Δ S and Δ F in the formula are the changes relative to the initial time, the linear regression of the practical absolute price is equivalent to combining the intercepts of the two into α, and the final result is the same. Interested Friends can deduce it by themselves. So I get the following picture in the post

Then we will establish the linear regression model, display it in the price-time coordinate system, and superimpose the real price trend of WTI crude oil to get the following comparison chart.
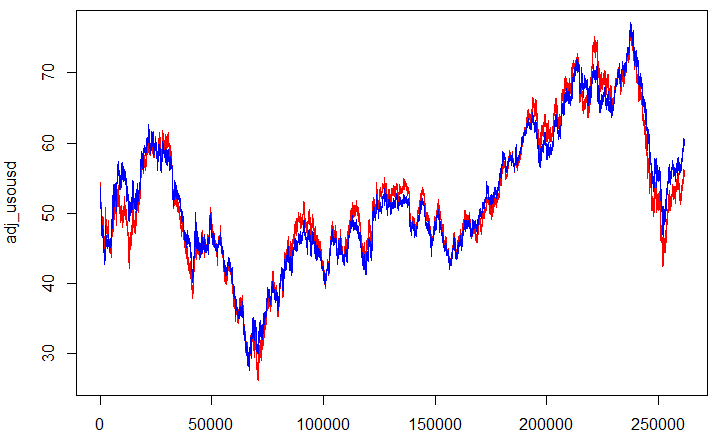
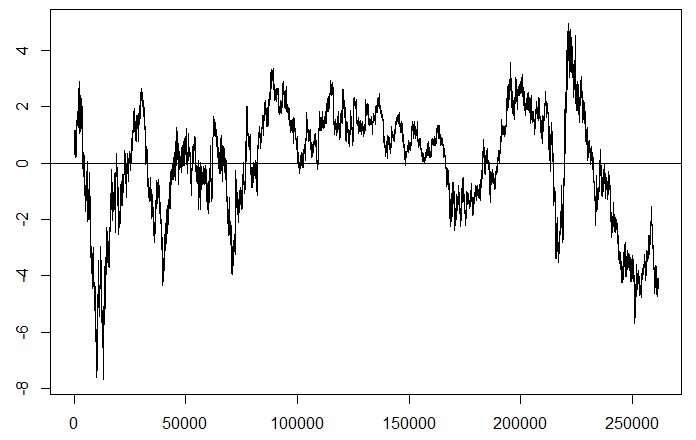
In the figure on the right, it can be seen that the fitting effect of this regression model is still relatively good, then the blue line (the predicted value of U.S. crude oil returned by Brent crude oil) and the red line (the real price of U.S. crude oil) The difference is our profit margin. We make the difference between the two and get the trend chart of the residual term as follows.
Is the arbitrage between the two oil prices on the market reliable?
So what is the difference between the two crude oil futures that we are most exposed to? In fact, they are two futures whose underlying assets are not exactly the same.
Brent crude oil contains four light, sweet crude oils produced in the North Sea Oilfield: Brent, Forties, Ekofisk and Oseberg. Brent crude oil is mined offshore, which is difficult and costly, and is mainly traded in the London commodity futures market.
U.S. WTI crude oil is mainly light crude oil from the Middle East, with low mining difficulty, low cost and good quality. Its delivery point is located in the Cushing area of Oklahoma, USA, and is traded on the New York Mercantile Exchange (NYMEX). US crude oil is a benchmark oil based on futures pricing in the US market, while Brent crude oil is a benchmark oil based on the spot market in the European market.
Therefore, some EAs on the market that claim to be arbitrage between the two oil prices are actually two types of futures with different basic assets from the perspective of financial engineering. If you ignore the hedging ratio, just do the two. The process of converging the oil price difference is actually an incorrect and rigorous approach. We can also see from the price difference chart of the two oils. The price difference between the two oils was pulled to 26.7 US dollars in 2011, and returned to about -1 US dollars in 2016. Such a range and frequency of return are obviously the so-called spread arbitrage on the market. It is unreasonable and not rigorous.

Strategy operation
One. Environmental choice and funding scale
The specific starting capital mainly depends on the broker’s corresponding target contract size, overnight interest and delivery status. Only two platforms, axitrader and gkfx, are recommended here as the recommended operating environment for this strategy. As a neutral technical service provider, other brokers cannot list them one by one. If you are interested, you can also consult customer service in detail.
two. Risk control rules
Risk: The recommended risk control line is 30%.
three. Expected profit
Expected return: 30% nominal retracement rate, actual net worth retracement rate 14.06%, two and a half years compound return of 133.69%, click here to view the detailed backtest report.
four. Disclaimer
As a neutral technical service provider, we only provide technical services. Achievements can only represent the past. Any trading strategy may have certain risks. It is recommended that you carefully consider your risk tolerance.
Этот интересный отчет представляет собой сборник полезных фактов, касающихся актуальных тем. Мы проанализируем данные, чтобы вы могли сделать обоснованные выводы. Читайте, чтобы узнать больше о последних трендах и значимых событиях!
Подробнее можно узнать тут – https://vyvod-iz-zapoya-1.ru/
Пациенты, нуждающиеся в круглосуточном наблюдении, могут пройти курс терапии в стационаре. Обстановка клиники рассчитана на комфортное пребывание: палаты с индивидуальным санитарным блоком, охрана, контроль приёма препаратов, поддержка психологов.
Подробнее тут – http://narkologicheskaya-pomoshh-tula10.ru/neotlozhnaya-narkologicheskaya-pomoshh-tula/
Для оценки уровня учреждения важно понимать, какие конкретно методики в нём используются. Ниже приведён обобщённый обзор подходов в современных наркологических клиниках региона:
Выяснить больше – [url=https://lechenie-narkomanii-vladimir10.ru/]анонимное лечение наркомании[/url]
Наркологическая помощь на дому становится всё более востребованной благодаря своей доступности, конфиденциальности и эффективности. Клиника «МедТрезвость» предлагает пациентам целый ряд важных преимуществ:
Исследовать вопрос подробнее – http://narcolog-na-dom-sankt-peterburg0.ru
В условиях современного ритма жизни алкоголизм нередко оборачивается тяжёлыми последствиями — от кратковременных запоев до хронической зависимости с серьёзными осложнениями. Наркологическая клиника «ТюменьМед» предлагает круглосуточную поддержку и выезд специалистов на дом в любое время суток, обеспечивая быстрое и безопасное восстановление здоровья. Использование инновационных методик, мобильных лабораторий и дистанционного контроля позволяет пациентам пройти детоксикацию и начать новый этап жизни в комфортных для них условиях.
Углубиться в тему – http://narkologicheskaya-klinika-tyumen10.ru
Сразу после поступления вызова специалист прибывает на дом для проведения первичного осмотра. На данном этапе нарколог:
Изучить вопрос глубже – [url=https://narcolog-na-dom-ryazan00.ru/]narcolog-na-dom-ryazan00.ru/[/url]
В рамках услуги вызова нарколога на дом используется современное оборудование и препараты, одобренные для амбулаторного применения.
Углубиться в тему – http://narkolog-na-dom-kamensk-uralskij11.ru/
Специалист уточняет, сколько времени продолжается запой, какой тип алкоголя употребляется, а также наличие сопутствующих заболеваний. Тщательный анализ этих данных помогает определить оптимальные методы детоксикации и скорректировать терапевтическую стратегию для минимизации риска осложнений.
Изучить вопрос глубже – https://narcolog-na-dom-ryazan0.ru
Современная наркологическая клиника в Каменске-Уральском предоставляет комплексные услуги по диагностике и лечению различных видов зависимостей. Заболевания, связанные с алкоголизмом и наркоманией, требуют индивидуального подхода и применения современных медицинских технологий. В условиях клиники обеспечивается полный медицинский контроль и психологическая поддержка, что способствует успешной реабилитации пациентов.
Подробнее можно узнать тут – chastnaya narkologicheskaya klinika kamensk-ural’skij
Назначение
Выяснить больше – капельница от запоя цена
После процедуры пациент и его близкие получают развернутые рекомендации по дальнейшему восстановлению, советы по профилактике рецидивов и возможности прохождения кодирования при желании пациента.
Получить больше информации – http://
Алкогольная зависимость — сложное хроническое заболевание, требующее комплексного подхода и квалифицированной помощи. В клинике «Тюменьбезалко» в центре Тюмени разработаны эффективные программы реабилитации, сочетающие современные медицинские методы, психологическую поддержку и социальную адаптацию. Опытные врачи-наркологи и психотерапевты помогают пациентам преодолеть употребление алкоголя, восстановить физическое и эмоциональное здоровье и вернуться к полноценной жизни.
Узнать больше – лечение алкоголизма на дому
Вывод из запоя в Мурманске представляет собой комплекс мероприятий, направленных на оказание медицинской помощи пациентам, находящимся в состоянии алкогольного отравления или длительного употребления спиртного. Процедура проводится с целью стабилизации состояния организма, предупреждения осложнений и минимизации риска развития тяжелых последствий алкоголизма.
Подробнее – http://vyvod-iz-zapoya-v-murmanske12.ru
Критерий
Узнать больше – нарколог на дом вывод из запоя
Применение современных капельничных методов позволяет точно дозировать лекарственные средства. Постоянный мониторинг жизненно важных показателей пациента дает возможность оперативно корректировать терапию для достижения оптимального эффекта и предотвращения побочных реакций.
Разобраться лучше – вывод из запоя волгоград.
Показатель
Детальнее – http://narkologicheskaya-klinika-tula10.ru
Проблемы, связанные с употреблением алкоголя или наркотических веществ, могут застать человека врасплох и требовать немедленного медицинского вмешательства. В Туле предоставляется наркологическая помощь, направленная на купирование острых состояний и оказание поддержки пациентам в кризисной ситуации. В клинике «Здоровье+» используются современные методы лечения, основанные на отечественных клинических рекомендациях, с акцентом на безопасность и индивидуальный подход.
Подробнее – https://narkologicheskaya-pomoshh-tula10.ru/neotlozhnaya-narkologicheskaya-pomoshh-tula/
Как поясняет медицинский психолог Елена Мусатова, «пациенту важно доверять специалисту, понимать его подход и чувствовать профессиональную уверенность ещё на этапе первичного осмотра».
Подробнее можно узнать тут – http://
Первое, на что стоит обратить внимание — это профессиональный уровень сотрудников. Без квалифицированных наркологов, клинических психологов и психиатров реабилитационный процесс становится формальным и неэффективным.
Подробнее – http://www.domen.ru
Вызов врача-нарколога на дом в Санкт-Петербурге начинается с детального осмотра и оценки состояния пациента. Врач измеряет давление, пульс, уровень кислорода в крови и определяет степень интоксикации.
Углубиться в тему – вызвать нарколога на дом в санкт-петербурге
Как подчёркивает главный врач клинического отделения, «в условиях стационара мы можем оперативно реагировать на малейшие изменения в состоянии пациента, что критически важно при тяжёлых формах запоя».
Выяснить больше – вывод из запоя в рязани
Метод лечения
Углубиться в тему – лечение наркомании и алкоголизма владимирская область
Согласно данным Федерального наркологического центра, своевременный выезд врача снижает риск осложнений и повторных госпитализаций.
Получить дополнительные сведения – врач нарколог на дом свердловская область
Стандартная процедура включает внутривенное введение растворов, которые эффективно выводят токсины, восстанавливают электролитный баланс и устраняют обезвоживание. Дополнительно врач назначает медикаменты для защиты сердца, печени и нервной системы, а также, при необходимости, седативные препараты для стабилизации психического состояния.
Ознакомиться с деталями – капельница от запоя цена в москве
Наркологическая помощь на дому становится всё более востребованной благодаря своей доступности, конфиденциальности и эффективности. Клиника «МедТрезвость» предлагает пациентам целый ряд важных преимуществ:
Подробнее можно узнать тут – https://narcolog-na-dom-sankt-peterburg0.ru/vyzov-narkologa-na-dom-spb
Сразу после поступления вызова специалист прибывает на дом для проведения первичного осмотра. На данном этапе нарколог:
Выяснить больше – вызвать нарколога на дом в рязани
Наркологическая помощь «ТюменьМед» не ограничивается только физической детоксикацией. В состав команды входят психологи и социальные работники, которые проводят мотивационные беседы, обучают навыкам самоконтроля и оказывают помощь в планировании досуга и социальных активностей после детоксикации.
Выяснить больше – narkologicheskaya klinika tjumen’
Каждый день запоя увеличивает риск для жизни. Не рискуйте — специалисты в Москве приедут на дом и окажут экстренную помощь. Без боли, стресса и ожидания.
Подробнее тут – после капельницы от запоя в Москве
Борьба с наркотической зависимостью требует системного подхода и участия опытных специалистов. Важно понимать, что лечение наркомании — это не только снятие ломки, но и длительная психотерапия, обучение новым моделям поведения, работа с семьёй. Согласно рекомендациям Минздрава РФ, наиболее стабильные результаты достигаются при прохождении курса реабилитации под наблюдением профессиональной команды в специализированном центре.
Ознакомиться с деталями – http://lechenie-narkomanii-vladimir10.ru/lechenie-narkomanii-anonimno-vladimir/
Каждый день запоя увеличивает риск для жизни. Не рискуйте — специалисты в Москве приедут на дом и окажут экстренную помощь. Без боли, стресса и ожидания.
Узнать больше – после капельницы от запоя
После поступления вызова врач наркологической клиники «МедАльянс» прибывает на дом в течение 30–60 минут. Сначала специалист оценивает общее состояние пациента, измеряет давление, уровень кислорода в крови и уточняет детали анамнеза.
Детальнее – капельница от запоя москва.
Критерий
Ознакомиться с деталями – нарколог на дом недорого в нижнем тагиле
В Москве решение есть — наркологическая клиника. Здесь помогают людям выйти из запоя без страха и осуждения. Всё анонимно, грамотно и с заботой о каждом пациенте.
Изучить вопрос глубже – капельница от запоя на дому цена
Как подчёркивает руководитель направления клинической токсикологии НМИЦ психиатрии и наркологии, «оказание помощи на дому требует не меньшего профессионализма, чем лечение в стационаре, ведь врач действует в ограниченных условиях».
Узнать больше – запой нарколог на дом в нижнем тагиле
В рамках услуги вызова нарколога на дом используется современное оборудование и препараты, одобренные для амбулаторного применения.
Подробнее можно узнать тут – нарколог на дом вывод из запоя
Затяжной запой опасен для жизни. Врачи наркологической клиники в Москве проводят срочный вывод из запоя — на дому или в стационаре. Анонимно, безопасно, круглосуточно.
Углубиться в тему – капельница от запоя цена
Вывод из запоя в Рязани — это комплексная медицинская услуга, направленная на устранение интоксикации, стабилизацию состояния пациента и предотвращение рецидива алкогольной зависимости. Методики подбираются индивидуально с учётом анамнеза, длительности запойного состояния, наличия сопутствующих заболеваний и психоэмоционального фона. Процедура осуществляется под контролем опытных врачей-наркологов с применением сертифицированных препаратов и оборудования.
Узнать больше – http://vyvod-iz-zapoya-v-ryazani12.ru/
Основная цель — быстрое и безопасное выведение этанола и его токсических метаболитов из организма, восстановление водно-электролитного и кислотно-щелочного баланса, нормализация артериального давления, работы сердца, почек и головного мозга. Для этого применяется инфузионная терапия, фармакологическая коррекция, витаминотерапия и, при необходимости, седативная поддержка.
Получить дополнительную информацию – https://vyvod-iz-zapoya-v-ryazani12.ru/vyvod-iz-zapoya-na-domu-v-ryazani
Согласно данным Федерального наркологического центра, своевременный выезд врача снижает риск осложнений и повторных госпитализаций.
Углубиться в тему – нарколог на дом вывод каменск-уральский
Первое, что необходимо уточнить перед вызовом — наличие у врача лицензии и профильного медицинского образования. Только сертифицированный нарколог может назначить препараты, поставить капельницу и провести детоксикацию без ущерба для здоровья пациента.
Ознакомиться с деталями – нарколог на дом вывод нижний тагил
Борьба с наркотической зависимостью требует системного подхода и участия опытных специалистов. Важно понимать, что лечение наркомании — это не только снятие ломки, но и длительная психотерапия, обучение новым моделям поведения, работа с семьёй. Согласно рекомендациям Минздрава РФ, наиболее стабильные результаты достигаются при прохождении курса реабилитации под наблюдением профессиональной команды в специализированном центре.
Узнать больше – центр лечения наркомании владимирская область
Стандартная процедура включает внутривенное введение растворов, которые эффективно выводят токсины, восстанавливают электролитный баланс и устраняют обезвоживание. Дополнительно врач назначает медикаменты для защиты сердца, печени и нервной системы, а также, при необходимости, седативные препараты для стабилизации психического состояния.
Получить дополнительную информацию – поставить капельницу от запоя москва
После первичной диагностики начинается активная фаза медикаментозного вмешательства. Современные препараты вводятся капельничным методом, что позволяет оперативно снизить концентрацию токсинов в крови и восстановить нормальные обменные процессы. Этот этап критически важен для стабилизации работы внутренних органов, таких как печень, почки и сердце.
Исследовать вопрос подробнее – narkolog-na-dom-kruglosutochno rjazan’
Клинические протоколы стационарной терапии рекомендуют госпитализацию при средней и тяжёлой степени интоксикации.
Ознакомиться с деталями – вывод из запоя недорого в рязани
Проблемы с алкоголем или наркотиками могут застать врасплох и привести к серьезным последствиям для организма, психического состояния и жизни пациента. Самостоятельные попытки выйти из запоя или преодолеть абстинентный синдром без медицинской поддержки редко оказываются эффективными и могут представлять реальную опасность для здоровья. Именно в таких ситуациях клиника «АльфаНаркология» предлагает услугу вызова нарколога на дом в Санкт-Петербурге и Ленинградской области. Наши специалисты оперативно реагируют на обращение, оказывают квалифицированную помощь и обеспечивают полную конфиденциальность лечения.
Углубиться в тему – нарколог на дом вывод
На этом этапе врач детально выясняет, как долго продолжается запой, какие симптомы наблюдаются, и имеются ли сопутствующие заболевания. Точный анализ информации помогает оперативно определить степень интоксикации и подобрать оптимальные методы детоксикации, что является ключом к предотвращению дальнейших осложнений.
Подробнее можно узнать тут – нарколог на дом рязань
В условиях стационара или на дневном стационаре применяются сбалансированные инфузионные растворы, витамины, антиоксиданты и препараты для поддержки печени. Цель — минимизировать интоксикацию и предотвратить осложнения.
Детальнее – lechenie-alkogolizma-tyumen10.ru/
Наркологическая помощь на дому становится всё более востребованной благодаря своей доступности, конфиденциальности и эффективности. Клиника «МедТрезвость» предлагает пациентам целый ряд важных преимуществ:
Узнать больше – нарколог на дом ленинградская область
В рамках услуги вызова нарколога на дом используется современное оборудование и препараты, одобренные для амбулаторного применения.
Получить дополнительные сведения – вызвать нарколога на дом каменск-уральский
Применение современных капельничных методов позволяет точно дозировать лекарственные средства. Постоянный мониторинг жизненно важных показателей пациента дает возможность оперативно корректировать терапию для достижения оптимального эффекта и предотвращения побочных реакций.
Ознакомиться с деталями – вывод из запоя волгоградская область
Для каждого пациента используется индивидуальный монитор жизненно важных функций, передающий данные врачу в клинике через защищённый канал связи. Это обеспечивает безопасность при лечении как лёгких, так и тяжёлых форм интоксикации, снижая вероятность осложнений.
Ознакомиться с деталями – наркологическая клиника в тюмени
Вызов врача-нарколога на дом в Санкт-Петербурге начинается с детального осмотра и оценки состояния пациента. Врач измеряет давление, пульс, уровень кислорода в крови и определяет степень интоксикации.
Ознакомиться с деталями – https://narcolog-na-dom-sankt-peterburg00.ru/vyzov-narkologa-na-dom-spb/
Проблемы, связанные с употреблением алкоголя или наркотических веществ, могут застать человека врасплох и требовать немедленного медицинского вмешательства. В Туле предоставляется наркологическая помощь, направленная на купирование острых состояний и оказание поддержки пациентам в кризисной ситуации. В клинике «Здоровье+» используются современные методы лечения, основанные на отечественных клинических рекомендациях, с акцентом на безопасность и индивидуальный подход.
Разобраться лучше – наркологическая помощь на дому в туле
Первый и самый важный момент — какие методики применяются в клинике. Качественное лечение наркозависимости включает несколько этапов: детоксикация, стабилизация состояния, психотерапия, ресоциализация. Одного лишь выведения токсинов из организма недостаточно — без проработки психологических причин употребления высокий риск рецидива.
Детальнее – лечение наркомании и алкоголизма владимир
Клиника «МедАльянс» оказывает профессиональную медицинскую помощь на дому в Москве и Московской области круглосуточно. Опытные врачи-наркологи приедут в течение часа после вызова, проведут полную диагностику, поставят капельницу и быстро вернут пациента в стабильное состояние.
Получить дополнительные сведения – http://kapelnica-ot-zapoya-moskva000.ru
Одним из ключевых этапов терапии является медикаментозное устранение абстинентного синдрома, что значительно облегчает состояние пациента. Для этого используются препараты, рекомендованные к применению ведущими специалистами в области наркологии. Примером могут служить протоколы лечения, описанные на официальном портале наркологической помощи России.
Углубиться в тему – частная наркологическая клиника в каменске-уральском
При необходимости применяется симптоматическое лечение для снижения болевого синдрома, устранения тошноты и рвоты, а также нормализации психоэмоционального состояния пациента. Врачи наркологи строго контролируют течение процедуры, что обеспечивает безопасность и снижает риски осложнений.
Подробнее – http://www.domen.ru
Компоненты
Подробнее тут – капельница от запоя анонимно
Стандартная процедура включает внутривенное введение растворов, которые эффективно выводят токсины, восстанавливают электролитный баланс и устраняют обезвоживание. Дополнительно врач назначает медикаменты для защиты сердца, печени и нервной системы, а также, при необходимости, седативные препараты для стабилизации психического состояния.
Узнать больше – капельница от запоя на дому цена в москве
Самостоятельно выйти из запоя — почти невозможно. В Москве врачи клиники проводят медикаментозный вывод из запоя с круглосуточным выездом. Доверяйте профессионалам.
Подробнее – капельница от запоя цена
В Москве решение есть — наркологическая клиника. Здесь помогают людям выйти из запоя без страха и осуждения. Всё анонимно, грамотно и с заботой о каждом пациенте.
Получить дополнительную информацию – врача капельницу от запоя в Москве
Согласно данным Федерального наркологического центра, своевременный выезд врача снижает риск осложнений и повторных госпитализаций.
Получить дополнительные сведения – нарколог на дом анонимно
Для эффективного вывода из запоя в Мурманске используются современные методы детоксикации, включающие внутривенное введение растворов, направленных на восстановление водно-солевого баланса, коррекцию электролитов и нормализацию работы почек и печени. Важным этапом является использование витаминных комплексов и препаратов, поддерживающих работу сердца и сосудов.
Ознакомиться с деталями – вывод из запоя анонимно в мурманске
Специалист уточняет, сколько времени продолжается запой, какой тип алкоголя употребляется, а также наличие сопутствующих заболеваний. Тщательный анализ этих данных помогает определить оптимальные методы детоксикации и скорректировать терапевтическую стратегию для минимизации риска осложнений.
Углубиться в тему – нарколог на дом цена
Особенно важно на этапе поступления пройти полную психодиагностику и получить адаптированную под конкретного пациента программу. Это позволит учитывать возможные сопутствующие расстройства, включая тревожные, аффективные и когнитивные нарушения.
Изучить вопрос глубже – наркологическая клиника цены
Наркологическая помощь на дому становится всё более востребованной благодаря своей доступности, конфиденциальности и эффективности. Клиника «МедТрезвость» предлагает пациентам целый ряд важных преимуществ:
Подробнее – narkolog-na-dom-czena sankt-peterburg
В условиях стационара или на дневном стационаре применяются сбалансированные инфузионные растворы, витамины, антиоксиданты и препараты для поддержки печени. Цель — минимизировать интоксикацию и предотвратить осложнения.
Получить больше информации – https://lechenie-alkogolizma-tyumen10.ru/klinika-lecheniya-alkogolizma-tyumen/
Борьба с наркотической зависимостью требует системного подхода и участия опытных специалистов. Важно понимать, что лечение наркомании — это не только снятие ломки, но и длительная психотерапия, обучение новым моделям поведения, работа с семьёй. Согласно рекомендациям Минздрава РФ, наиболее стабильные результаты достигаются при прохождении курса реабилитации под наблюдением профессиональной команды в специализированном центре.
Исследовать вопрос подробнее – центр лечения наркомании владимирская область
В рамках услуги вызова нарколога на дом используется современное оборудование и препараты, одобренные для амбулаторного применения.
Исследовать вопрос подробнее – http://narkolog-na-dom-kamensk-uralskij11.ru/chastnyj-narkolog-na-dom-v-kamensk-uralskom/
В рамках реабилитации применяются когнитивно-поведенческие тренинги, арт-терапия и групповые занятия по развитию коммуникативных навыков. Это помогает пациентам осознать причины зависимости и выработать стратегии предотвращения рецидивов в будущем.
Углубиться в тему – http://narkologicheskaya-klinika-tyumen10.ru/
Вызов врача-нарколога на дом в Санкт-Петербурге начинается с детального осмотра и оценки состояния пациента. Врач измеряет давление, пульс, уровень кислорода в крови и определяет степень интоксикации.
Подробнее – нарколог на дом
Каждый день запоя увеличивает риск для жизни. Не рискуйте — специалисты в Москве приедут на дом и окажут экстренную помощь. Без боли, стресса и ожидания.
Детальнее – капельница от запоя Москва
Пациенты, нуждающиеся в круглосуточном наблюдении, могут пройти курс терапии в стационаре. Обстановка клиники рассчитана на комфортное пребывание: палаты с индивидуальным санитарным блоком, охрана, контроль приёма препаратов, поддержка психологов.
Разобраться лучше – скорая наркологическая помощь в туле
Наркологическая помощь в Первоуральске доступна в различных форматах: амбулаторно, стационарно и на дому. Однако не каждое учреждение может обеспечить необходимый уровень комплексной терапии, соответствующей стандартам Минздрава РФ и НМИЦ психиатрии и наркологии. В этом материале мы рассмотрим ключевые особенности профессионального наркологического центра и критерии, которые помогут сделать осознанный выбор.
Подробнее можно узнать тут – http://narkologicheskaya-klinika-pervouralsk11.ru
Каждый день запоя увеличивает риск для жизни. Не рискуйте — специалисты в Москве приедут на дом и окажут экстренную помощь. Без боли, стресса и ожидания.
Подробнее можно узнать тут – врача капельницу от запоя Москва
Согласно данным Федерального наркологического центра, своевременный выезд врача снижает риск осложнений и повторных госпитализаций.
Подробнее можно узнать тут – https://narkolog-na-dom-kamensk-uralskij11.ru/
Клиника «МедАльянс» оказывает профессиональную медицинскую помощь на дому в Москве и Московской области круглосуточно. Опытные врачи-наркологи приедут в течение часа после вызова, проведут полную диагностику, поставят капельницу и быстро вернут пациента в стабильное состояние.
Получить больше информации – posle-kapelniczy-ot-zapoya moskva
Врачи клиники «ЗдравЦентр» рекомендуют не откладывать вызов нарколога, чтобы избежать серьезных последствий, таких как судорожные припадки, инсульт или алкогольный психоз.
Исследовать вопрос подробнее – https://kapelnica-ot-zapoya-moskva00.ru
Борьба с наркотической зависимостью требует системного подхода и участия опытных специалистов. Важно понимать, что лечение наркомании — это не только снятие ломки, но и длительная психотерапия, обучение новым моделям поведения, работа с семьёй. Согласно рекомендациям Минздрава РФ, наиболее стабильные результаты достигаются при прохождении курса реабилитации под наблюдением профессиональной команды в специализированном центре.
Ознакомиться с деталями – http://www.domen.ru
Основная цель — быстрое и безопасное выведение этанола и его токсических метаболитов из организма, восстановление водно-электролитного и кислотно-щелочного баланса, нормализация артериального давления, работы сердца, почек и головного мозга. Для этого применяется инфузионная терапия, фармакологическая коррекция, витаминотерапия и, при необходимости, седативная поддержка.
Изучить вопрос глубже – вывод из запоя
Вывод из запоя показан при:
Детальнее – vyvod-iz-zapoya-kruglosutochno murmansk
Эта обзорная заметка содержит ключевые моменты и факты по актуальным вопросам. Она поможет читателям быстро ориентироваться в теме и узнать о самых важных аспектах сегодня. Получите краткий курс по современной информации и оставайтесь в курсе событий!
Получить дополнительную информацию – https://vistoweekly.com/mywape
Первое, на что стоит обратить внимание — это профессиональный уровень сотрудников. Без квалифицированных наркологов, клинических психологов и психиатров реабилитационный процесс становится формальным и неэффективным.
Узнать больше – частная наркологическая клиника свердловская область
Эта статья для ознакомления предлагает читателям общее представление об актуальной теме. Мы стремимся представить ключевые факты и идеи, которые помогут читателям получить представление о предмете и решить, стоит ли углубляться в изучение.
Исследовать вопрос подробнее – https://godspeedoffroad.com/rut-recovery-utility-tool-black-smitybilt-2728
Эта публикация завернет вас в вихрь увлекательного контента, сбрасывая стереотипы и открывая двери к новым идеям. Каждый абзац станет для вас открытием, полным ярких примеров и впечатляющих достижений. Подготовьтесь быть вовлеченными и удивленными каждый раз, когда продолжите читать.
Подробнее тут – https://mc-3.org/2023/12/19/hallo-welt
Этот информативный текст отличается привлекательным содержанием и актуальными данными. Мы предлагаем читателям взглянуть на привычные вещи под новым углом, предоставляя интересный и доступный материал. Получите удовольствие от чтения и расширьте кругозор!
Выяснить больше – https://delhikhabar.in/delhi-weather-update-winds-can-blow-in-delhi-at-a-speed-of-30-kmph-clouds-will-prevail-in-two-three-days
Перед началом терапии врач проводит предварительный осмотр: измеряет давление, пульс, оценивает общее состояние пациента, наличие сопутствующих хронических заболеваний и признаков тяжёлой интоксикации. После этого разрабатывается индивидуальная схема лечения. В большинстве случаев она включает внутривенное введение растворов, улучшающих водно-солевой баланс, а также медикаментов, направленных на снятие абстиненции, нормализацию сна и снижение тревожности.
Детальнее – анонимный вывод из запоя
Эта статья сочетает познавательный и занимательный контент, что делает ее идеальной для любителей глубоких исследований. Мы рассмотрим увлекательные аспекты различных тем и предоставим вам новые знания, которые могут оказаться полезными в будущем.
Детальнее – https://drivers4vip.com/product/beanie-with-logo
Этот информативный текст выделяется своими захватывающими аспектами, которые делают сложные темы доступными и понятными. Мы стремимся предложить читателям глубину знаний вместе с разнообразием интересных фактов. Откройте новые горизонты и развивайте свои способности познавать мир!
Получить дополнительную информацию – https://bloggenmeister.com/die-grundlagen-des-bloggens-verstehen
Эта статья для ознакомления предлагает читателям общее представление об актуальной теме. Мы стремимся представить ключевые факты и идеи, которые помогут читателям получить представление о предмете и решить, стоит ли углубляться в изучение.
Углубиться в тему – https://frentedostorcedores.com.br/2022/07/assista-brusque-x-operario-pr-ao-vivo-hoje-01-07-as-2130-hs-brasileirao-serie-b-palpites-e-retrospecto
Эта разъяснительная статья содержит простые и доступные разъяснения по актуальным вопросам. Мы стремимся сделать информацию понятной для широкой аудитории, чтобы каждый смог разобраться в предмете и извлечь из него максимум пользы.
Исследовать вопрос подробнее – https://smartmeals.online/hello-world
Метод лечения
Подробнее – centr lecheniya narkomanii vladimir
Эта информационная заметка предлагает лаконичное и четкое освещение актуальных вопросов. Здесь вы найдете ключевые факты и основную информацию по теме, которые помогут вам сформировать собственное мнение и повысить уровень осведомленности.
Изучить вопрос глубже – http://www.brambillacarlocenter.com/news/prova-news
Предлагаем вашему вниманию интересную справочную статью, в которой собраны ключевые моменты и нюансы по актуальным вопросам. Эта информация будет полезна как для профессионалов, так и для тех, кто только начинает изучать тему. Узнайте ответы на важные вопросы и расширьте свои знания!
Подробнее можно узнать тут – https://vistoweekly.com/mastering-rubranking-for-seo-success-in-digital-marketing
В этой статье-обзоре мы соберем актуальную информацию и интересные факты, которые освещают важные темы. Читатели смогут ознакомиться с различными мнениями и подходами, что позволит им расширить кругозор и глубже понять обсуждаемые вопросы.
Получить дополнительные сведения – https://vistoweekly.com/experts-aigilbertwired
Эта статья предлагает уникальную подборку занимательных фактов и необычных историй, которые вы, возможно, не знали. Мы постараемся вдохновить ваше воображение и разнообразить ваш кругозор, погружая вас в мир, полный интересных открытий. Читайте и открывайте для себя новое!
Исследовать вопрос подробнее – https://xorcoins.com/index.php/2023/04/09/unlock-the-power-of-digital-marketing-our-services
Метод лечения
Разобраться лучше – лечение наркомании наркология
После устранения острой зависимости важным этапом становится реабилитация. Она включает восстановление социальных навыков, обучение методам преодоления стрессов без употребления психоактивных веществ.
Выяснить больше – http://narkologicheskaya-klinika-v-murmanske12.ru
Наркологическая клиника в Рязани предоставляет квалифицированную помощь пациентам, страдающим от алкогольной, наркотической и медикаментозной зависимости. Здесь проводится полный цикл медицинской и психотерапевтической поддержки, начиная с детоксикации и заканчивая восстановительным этапом. Учреждение оборудовано современными технологиями, а персонал обладает подтверждённой квалификацией и практическим опытом.
Получить дополнительную информацию – https://narkologicheskaya-klinika-v-ryazani12.ru/narkologicheskaya-klinika-telefon-v-ryazani/
После первичной диагностики начинается активная фаза медикаментозного вмешательства. Современные препараты вводятся капельничным методом, что позволяет оперативно снизить концентрацию токсинов в крови и восстановить нормальные обменные процессы. Этот этап критически важен для стабилизации работы внутренних органов, таких как печень, почки и сердце.
Получить дополнительные сведения – нарколог на дом вывод в рязани
Пребывание в стационаре обеспечивает круглосуточный мониторинг состояния, своевременное введение лекарств и защиту пациента от внешних факторов, провоцирующих срыв. Все палаты оснащены необходимым оборудованием, соблюдаются санитарные нормы, а условия размещения соответствуют медицинским стандартам.
Подробнее можно узнать тут – http://narkologicheskaya-klinika-v-yaroslavle12.ru/narkologicheskaya-klinika-klinika-pomoshh-v-yaroslavle/
Основной этап – введение внутривенной капельницы с специально разработанными растворами. Эти растворы содержат электролиты, витамины и активные компоненты, способствующие быстрому выведению токсинов, восстановлению водно-солевого баланса и улучшению обмена веществ. Детоксикация позволяет снизить концентрацию алкоголя в крови, уменьшить симптомы абстиненции и подготовить организм к последующим этапам терапии.
Исследовать вопрос подробнее – https://narcolog-na-dom-krasnoyarsk0.ru
Капельница от запоя применяется для комплексного восстановления организма после длительного употребления алкоголя. Она включает в себя введение растворов, насыщенных витаминами, электролитами, глюкозой и лекарственными средствами, направленными на устранение симптомов интоксикации. Основные задачи процедуры:
Изучить вопрос глубже – капельница от запоя на дому мурманск
Основные показания для вызова нарколога:
Получить больше информации – нарколог на дом цены иркутск
Запой – это состояние, когда организм требует постоянного поступления алкоголя для нормальной работы. Запой вызывает накопление вредных веществ, что негативно влияет на органы и иммунную систему. Не пытайтесь самостоятельно избавиться от запоя, это может навредить. Получите квалифицированную помощь на дому от клиники «Семья и Здоровье». Мы быстро приедем и окажем круглосуточную поддержку при запое. Длительное употребление алкоголя опасно для здоровья и жизни. Не ждите, пока станет слишком поздно, обратитесь за помощью при запое!
Разобраться лучше – https://vyvod-iz-zapoya-krasnoyarsk0.ru/
Нужна срочная помощь при алкогольном отравлении или запое? Вызовите нарколога на дом в Иркутске! Квалифицированная помощь нарколога на дому: диагностика, капельница, стабилизация состояния. Круглосуточный выезд нарколога, анонимность и снижение рисков – с «ТрезвоМед». Самостоятельный отказ невозможен? Необходима наркологическая помощь. Васильев: «Не затягивайте с помощью при алкогольном отравлении!».
Изучить вопрос глубже – вызов нарколога на дом иркутск
Введение препаратов осуществляется внутривенно, что обеспечивает оперативное действие медикаментов. В состав лечебного раствора входят средства для детоксикации организма, нормализации водно-электролитного и кислотно-щелочного баланса. При необходимости врач дополнительно вводит препараты, защищающие печень, стабилизирующие работу сердца и успокаивающие нервную систему. Вся процедура проводится под строгим контролем нарколога, который следит за состоянием пациента и корректирует терапию при необходимости. По завершении процедуры врач дает пациенту и его родственникам подробные рекомендации по дальнейшему восстановлению и профилактике повторных запоев.
Углубиться в тему – капельница от запоя цена нижний новгород
Сразу после поступления вызова специалист прибывает на дом для проведения первичного осмотра. На данном этапе нарколог:
Изучить вопрос глубже – нарколог на дом недорого рязань
Нарколог на дому проводит тщательный осмотр, собирает анамнез и назначает необходимые лабораторные исследования. Это позволяет выявить сопутствующие патологии и скорректировать тактику лечения.
Получить больше информации – вызов нарколога на дом в ярославле
Запой – это очень опасно! Круглосуточная помощь нарколога в Волгоградской области – ваш шанс выжить. Мы оказываем помощь круглосуточно, чтобы вы могли начать лечение в любой момент. Мы обеспечиваем оперативное вмешательство, индивидуальный подход и высокий уровень безопасности. Служба круглосуточного вывода из запоя работает оперативно и надежно. При ухудшении состояния, мы готовы выехать на дом или принять вас в клинике для детоксикации. Начинаем с диагностики: сбор анамнеза, измерение показателей и оценка степени интоксикации.
Изучить вопрос глубже – вывод из запоя цены волгоград
Если человек страдает от алкоголизма, запойное состояние требует незамедлительного вмешательства, особенно если признаки токсического отравления начинают угрожать жизни. Признаки запоя — это не только физическая зависимость, но и эмоциональные и психические расстройства, такие как тревога, агрессия и галлюцинации.
Получить дополнительную информацию – http://narcolog-na-dom-novokuznetsk0.ru/
Как подчёркивает заведующий отделением наркологии Владимирского областного клинического диспансера, «только комплексная модель, включающая медикаментозную поддержку и психотерапию, даёт устойчивый эффект». Это означает, что в штате клиники должны быть не только врачи, но и психотерапевты, социальные работники, реабилитологи.
Подробнее – центр лечения наркомании владимир
Есть ситуации, когда вызов врача на дом становится не просто желателен, а жизненно необходим. Если зависимый человек не способен самостоятельно прекратить употребление алкоголя или наркотиков, а его самочувствие заметно ухудшается, необходимо незамедлительно обратиться за медицинской помощью. Поводом для вызова нарколога служат следующие опасные симптомы:
Изучить вопрос глубже – нарколог на дом круглосуточно новосибирск
Наркологическая клиника «МедЛайн» предоставляет профессиональные услуги врача-нарколога с выездом на дом в Новосибирске и Новосибирской области. Мы оперативно помогаем пациентам справиться с тяжелыми состояниями при алкогольной и наркотической зависимости. Экстренный выезд наших специалистов доступен круглосуточно, а лечение проводится с применением проверенных методик и препаратов, что гарантирует безопасность и конфиденциальность каждому пациенту.
Ознакомиться с деталями – врач нарколог на дом новосибирск
Не стоит медлить с вызовом врача-нарколога, если у человека проявляются тревожные признаки ухудшения состояния. Среди наиболее серьезных симптомов, требующих немедленного вмешательства врача, можно выделить продолжительный запой (более двух дней подряд), частую рвоту, невыносимую головную боль, выраженный тремор рук и тела, повышение артериального давления, нарушение ритма сердца, а также психические нарушения, включая тревогу, галлюцинации и бессонницу. Чем раньше пациент обратится за профессиональной помощью, тем выше шансы избежать серьезных осложнений и быстро вернуться к нормальной жизни.
Получить дополнительные сведения – vyvod-iz-zapoya novosibirsk
Эффективное лечение требует поэтапного подхода, который реализуется следующим образом:
Выяснить больше – https://narkologicheskaya-klinika-v-ryazani12.ru/narkologicheskaya-klinika-czeny-v-ryazani/
После первичной диагностики начинается активная фаза медикаментозного вмешательства. Современные препараты вводятся капельничным методом, что позволяет оперативно снизить концентрацию токсинов в крови и восстановить нормальные обменные процессы. Этот этап критически важен для стабилизации работы внутренних органов, таких как печень, почки и сердце.
Изучить вопрос глубже – вызов врача нарколога на дом
Некоторые состояния требуют немедленного вмешательства нарколога, так как отказ от лечения может привести к тяжелым осложнениям и риску для жизни.
Подробнее – https://narcolog-na-dom-novokuznetsk00.ru/narkolog-lechenie-na-domu-novokuzneczk
Пребывание в стационаре обеспечивает круглосуточный мониторинг состояния, своевременное введение лекарств и защиту пациента от внешних факторов, провоцирующих срыв. Все палаты оснащены необходимым оборудованием, соблюдаются санитарные нормы, а условия размещения соответствуют медицинским стандартам.
Выяснить больше – наркологические клиники алкоголизм ярославль
Для успешной адаптации пациента в обществе клиника организует поддержку родственников и последующее наблюдение. Это снижает риск рецидива и помогает сохранить достигнутые результаты.
Подробнее – http://narkologicheskaya-klinika-v-murmanske12.ru
Вывод из запоя — это не просто капельница, а многоуровневая медицинская процедура, направленная на устранение интоксикации, стабилизацию состояния пациента и предотвращение осложнений. В клинике «Жизненный Луч» мы проводим эту процедуру в домашних условиях и в стационаре, в зависимости от тяжести состояния. К каждому пациенту применяем индивидуальный подход, исходя из возраста, сопутствующих заболеваний и длительности запоя.
Подробнее – https://vyvod-iz-zapoya-kolomna3.ru/vyvod-iz-zapoya-nedorogo-v-kolomne
Метод лечения
Ознакомиться с деталями – https://lechenie-narkomanii-vladimir10.ru/lechenie-narkomanii-anonimno-vladimir/
Как подчёркивает психотерапевт наркологической клиники «Чистая Дорога» Игорь Алексеевич Кондратенко, «кодирование — это не запрет, а защита. Мы не наказываем организм, а даём ему возможность отдохнуть от постоянной борьбы и переключиться на восстановление».
Подробнее можно узнать тут – anonimnoe-kodirovanie-ot-alkogolizma
Алкогольный запой — это не просто многодневное пьянство, а проявление зависимости, при котором каждое утро начинается с новой дозы спиртного. Организм человека уже не способен самостоятельно справляться с последствиями переработки этанола, и любое промедление ведёт к нарастанию тяжёлой интоксикации. Даже при резком прекращении употребления алкоголя последствия могут быть непредсказуемыми: от судорожных припадков до алкогольного психоза.
Получить больше информации – vyvod-iz-zapoya-v-domodedovo
Капельница рекомендована при следующих состояниях:
Изучить вопрос глубже – капельница от запоя анонимно в мурманске
Основной частью лечения является постановка внутривенной капельницы с растворами, которые помогают быстро вывести токсины, нормализовать водно-солевой баланс и восстановить работу внутренних органов. Дополнительно назначаются средства для защиты печени, нормализации работы сердца и снятия тревожности. Врач контролирует состояние пациента на протяжении всей процедуры, а при необходимости корректирует лечебную схему. По окончании манипуляций специалист обязательно дает рекомендации для дальнейшего восстановления организма и предотвращения повторных запоев.
Ознакомиться с деталями – https://narcolog-na-dom-novosibirsk0.ru/vyzov-narkologa-na-dom-novosibirsk
Используя современные инфузионные системы, мы постепенно вводим растворы для выведения токсинов, коррекции водно-электролитного баланса и восстановления функции печени. Параллельно подбираются препараты для снятия абстинентного синдрома, купирования тревожности и нормализации сна.
Исследовать вопрос подробнее – http://
Каждый день запоя увеличивает риск для жизни. Не рискуйте — специалисты в Москве приедут на дом и окажут экстренную помощь. Без боли, стресса и ожидания.
Получить больше информации – капельница от запоя на дому цена в Москве
Пожалуй, самый распространённый миф — что если просто не пить сутки-двое, то всё наладится. Но если человек длительное время находился в состоянии опьянения, его тело уже адаптировалось к токсичной среде. Резкий отказ без медицинской помощи может привести к судорогам, галлюцинациям, тяжёлой бессоннице, паническим атакам и скачкам давления. Человек буквально «сгорает» изнутри — от собственного обмена веществ, который не справляется с последствиями интоксикации.
Подробнее тут – https://vyvod-iz-zapoya-ehlektrostal3.ru/anonimnyj-vyvod-iz-zapoya-v-ehlektrostali
Запой – это не просто пьянство, а состояние, когда организм становится зависимым от алкоголя. Накопление токсинов приводит к сбоям в работе органов и ослаблению защиты организма. Самостоятельный выход из запоя может быть опасен и только усугубить состояние. Мы предлагаем лечение запоя на дому, чтобы избежать больницы и создать комфорт. Наши специалисты быстро приедут к вам и окажут всю необходимую помощь круглосуточно. Запой приводит к серьезным проблемам со здоровьем, ухудшает качество жизни и угрожает жизни. Очень важно вовремя обратиться за помощью, чтобы избежать необратимых последствий.
Изучить вопрос глубже – https://vyvod-iz-zapoya-krasnoyarsk0.ru/vyvod-iz-zapoya-kruglosutochno-krasnoyarsk/
Метод лечения
Получить дополнительные сведения – http://lechenie-narkomanii-vladimir10.ru/
Запой – это не просто временное ухудшение самочувствия, а состояние, при котором организм подвергается значительному токсическому воздействию алкоголя. Длительное злоупотребление приводит к накоплению вредных веществ, что может вызвать:
Изучить вопрос глубже – http://narcolog-na-dom-ryazan00.ru
Лечение выводится поэтапно, чтобы обеспечить безопасность и максимальную эффективность терапии. Каждый этап продуман и адаптирован под индивидуальные особенности пациента.
Получить дополнительную информацию – нарколог на дом недорого в красноярске
Работа клиники строится на принципах доказательной медицины и индивидуального подхода. При поступлении пациента осуществляется всесторонняя диагностика, включающая анализы крови, оценку психического состояния и анамнез. По результатам разрабатывается персонализированный курс терапии.
Получить больше информации – наркологические клиники алкоголизм в рязани
После первичной диагностики начинается активная фаза медикаментозного вмешательства. Современные препараты вводятся капельничным методом, что позволяет оперативно снизить концентрацию токсинов в крови и восстановить нормальные обменные процессы. Этот этап критически важен для стабилизации работы внутренних органов, таких как печень, почки и сердце.
Ознакомиться с деталями – http://narcolog-na-dom-ryazan0.ru
В клинике применяются доказательные методы лечения, соответствующие международным и российским рекомендациям. Основу составляет медикаментозная детоксикация, сопровождаемая психотерапией, когнитивно-поведенческой коррекцией, а также семейной консультацией. При необходимости применяются пролонгированные препараты, облегчающие контроль над тягой к веществу.
Изучить вопрос глубже – narkologicheskaya-klinika-v-yaroslavle12.ru/
Запой — это не просто бытовое пьянство, а одно из наиболее опасных проявлений алкогольной зависимости. Во время запоя организм перестаёт функционировать в нормальном режиме: сердечно-сосудистая система работает на износ, нервная система перегружена токсинами, а печень не справляется с нагрузкой. На этом фоне могут возникать тяжёлые осложнения — от судорог и гипогликемии до нарушения дыхания и алкогольного психоза. Чем дольше длится запой, тем глубже метаболические нарушения и выше риск серьёзных последствий.
Получить дополнительные сведения – https://vyvod-iz-zapoya-kolomna3.ru
Нарколог на дому проводит тщательный осмотр, собирает анамнез и назначает необходимые лабораторные исследования. Это позволяет выявить сопутствующие патологии и скорректировать тактику лечения.
Получить дополнительную информацию – нарколог на дом вывод в ярославле
Основные показания для вызова нарколога:
Получить больше информации – http://narcolog-na-dom-v-irkutske00.ru/
Нужна срочная помощь при алкогольном отравлении или запое? Вызовите нарколога на дом в Иркутске! Квалифицированная помощь нарколога на дому: диагностика, капельница, стабилизация состояния. Круглосуточный выезд нарколога, анонимность и снижение рисков – с «ТрезвоМед». Самостоятельный отказ невозможен? Необходима наркологическая помощь. Васильев: «Не затягивайте с помощью при алкогольном отравлении!».
Получить дополнительную информацию – платный нарколог на дом иркутск
Пациенты выбирают нашу клинику для срочного вызова врача-нарколога благодаря следующим важным преимуществам:
Исследовать вопрос подробнее – нарколог на дом цена
Основной частью лечения является постановка внутривенной капельницы с растворами, которые помогают быстро вывести токсины, нормализовать водно-солевой баланс и восстановить работу внутренних органов. Дополнительно назначаются средства для защиты печени, нормализации работы сердца и снятия тревожности. Врач контролирует состояние пациента на протяжении всей процедуры, а при необходимости корректирует лечебную схему. По окончании манипуляций специалист обязательно дает рекомендации для дальнейшего восстановления организма и предотвращения повторных запоев.
Получить больше информации – врач нарколог на дом новосибирск
Для оценки уровня учреждения важно понимать, какие конкретно методики в нём используются. Ниже приведён обобщённый обзор подходов в современных наркологических клиниках региона:
Изучить вопрос глубже – центр лечения наркомании владимир.
При остром алкогольном отравлении появляются головокружение, рвота, сильная слабость, скачки давления, нарушение дыхания, обмороки и судороги. Это сигнал о том, что организм не справляется с интоксикацией, и без срочного медицинского вмешательства возможны опасные осложнения, вплоть до комы.
Ознакомиться с деталями – нарколог на дом вывод из запоя в новокузнецке
Для успешного лечения зависимости необходима тщательная диагностика. В клинике проводят полное обследование пациента, включающее:
Изучить вопрос глубже – частная наркологическая клиника в мурманске
Запой – это не просто пьянство, а состояние, когда организм становится зависимым от алкоголя. Накопление токсинов приводит к сбоям в работе органов и ослаблению защиты организма. Самостоятельный выход из запоя может быть опасен и только усугубить состояние. Мы предлагаем лечение запоя на дому, чтобы избежать больницы и создать комфорт. Наши специалисты быстро приедут к вам и окажут всю необходимую помощь круглосуточно. Запой приводит к серьезным проблемам со здоровьем, ухудшает качество жизни и угрожает жизни. Очень важно вовремя обратиться за помощью, чтобы избежать необратимых последствий.
Узнать больше – вывести из запоя
Каждый пациент получает индивидуальный план лечения, основанный на клинических исследованиях, данных лабораторных анализов и психологических тестов.
Изучить вопрос глубже – http://narkologicheskaya-klinika-dolgoprudnyj3.ru
Запой может быть не только физически тяжёлым, но и психологически разрушительным. Поэтому важно вовремя обратиться за помощью. Вывод из запоя в Нижнем Новгороде — это необходимая медицинская процедура, которая помогает победить алкогольную зависимость и восстановить здоровье. Мы в клинике «АнтиЗависимость» предлагаем круглосуточную помощь в комфортных условиях — на дому или в стационаре.
Получить дополнительные сведения – http://narcolog-na-dom-novokuznetsk0.ru
Алкогольная зависимость — это хроническое заболевание, которое со временем разрушает здоровье, отношения, профессиональную сферу и личную идентичность человека. Многие сталкиваются с этим не сразу: поначалу кажется, что всё под контролем, но с каждым срывом становится всё труднее остановиться. Постепенно алкоголь перестаёт быть выбором и превращается в навязчивую необходимость.
Ознакомиться с деталями – кодирование от алкоголизма на дому щелково
Независимо от формы зависимости — алкогольной, опиатной, синтетической или медикаментозной — специалисты подбирают индивидуальный курс терапии. Алгоритмы лечения адаптируются под возраст, стаж употребления, общее состояние организма и наличие сопутствующих заболеваний.
Разобраться лучше – наркологическая клиника в ярославле
Эффективное лечение требует поэтапного подхода, который реализуется следующим образом:
Подробнее можно узнать тут – https://narkologicheskaya-klinika-v-ryazani12.ru/narkologicheskaya-klinika-telefon-v-ryazani/
В условиях, когда алкогольная зависимость угрожает жизни, оперативное вмешательство становится ключевым фактором для сохранения здоровья. В Рязани круглосуточная помощь нарколога на дому позволяет начать комплексное лечение запоя и алкогольной интоксикации в самые критические моменты. Такая услуга обеспечивает детоксикацию организма, стабилизацию жизненно важных показателей и психологическую поддержку, что способствует скорейшему восстановлению в комфортной обстановке, без необходимости посещения стационара.
Узнать больше – вызов нарколога на дом рязанская область
Пациенты, которые выбирают нашу клинику для лечения алкогольного запоя, получают качественную и оперативную помощь, обладающую следующими преимуществами:
Подробнее – капельница от запоя анонимно нижний новгород
В Москве решение есть — наркологическая клиника. Здесь помогают людям выйти из запоя без страха и осуждения. Всё анонимно, грамотно и с заботой о каждом пациенте.
Подробнее можно узнать тут – врач на дом капельница от запоя
В ходе процедуры врач контролирует жизненные показатели пациента, корректирует состав раствора при необходимости и оказывает дополнительную поддержку. После завершения капельницы часто назначается курс восстановительной терапии, направленный на стабилизацию функций организма.
Получить дополнительные сведения – http://kapelnicza-ot-zapoya-v-murmanske12.ru/kapelnicza-ot-zapoya-czena-v-murmanske/
Запой — это не просто бытовое пьянство, а одно из наиболее опасных проявлений алкогольной зависимости. Во время запоя организм перестаёт функционировать в нормальном режиме: сердечно-сосудистая система работает на износ, нервная система перегружена токсинами, а печень не справляется с нагрузкой. На этом фоне могут возникать тяжёлые осложнения — от судорог и гипогликемии до нарушения дыхания и алкогольного психоза. Чем дольше длится запой, тем глубже метаболические нарушения и выше риск серьёзных последствий.
Ознакомиться с деталями – http://vyvod-iz-zapoya-kolomna3.ru/vyvod-iz-zapoya-stacionar-v-kolomne/https://vyvod-iz-zapoya-kolomna3.ru
Когда запой становится угрозой для жизни, оперативное вмешательство становится ключевым для спасения здоровья и предотвращения серьезных осложнений. В Рязани вызов нарколога на дом позволяет начать лечение в самые критические моменты, обеспечивая детоксикацию организма и восстановление его нормального функционирования в условиях, где пациент чувствует себя комфортно и сохраняет свою конфиденциальность. Этот формат оказания медицинской помощи особенно актуален для тех, кто хочет избежать длительного ожидания в стационаре и предпочитает лечение в привычной домашней обстановке.
Подробнее тут – нарколог на дом срочно
В городе Домодедово такую услугу оказывает наркологическая клиника «Светлый Мир». Здесь работают опытные врачи с круглосуточной готовностью выехать к пациенту домой или принять его в условиях стационара. Главное — не откладывать помощь, особенно если речь идёт о пожилом человеке, пациенте с хроническими заболеваниями или тех, у кого уже проявляются тревожные симптомы: дрожь в руках, панические атаки, скачки давления, бессонница и даже слуховые или зрительные галлюцинации.
Разобраться лучше – вывод из запоя дешево
Борьба с наркотической зависимостью требует системного подхода и участия опытных специалистов. Важно понимать, что лечение наркомании — это не только снятие ломки, но и длительная психотерапия, обучение новым моделям поведения, работа с семьёй. Согласно рекомендациям Минздрава РФ, наиболее стабильные результаты достигаются при прохождении курса реабилитации под наблюдением профессиональной команды в специализированном центре.
Узнать больше – центр лечения наркомании в владимире
Врачи клиники «ВитаЛайн» для снятия интоксикации и облегчения состояния пациента применяют исключительно качественные и проверенные лекарственные препараты, подбирая их в зависимости от особенностей ситуации и состояния здоровья пациента:
Узнать больше – нарколог на дом новосибирск
Наркологическая помощь на дому в Ярославле охватывает широкий спектр медицинских мероприятий, направленных на стабилизацию состояния пациента и подготовку к дальнейшему лечению. Среди основных процедур:
Углубиться в тему – http://www.domen.ru
В «Трезвом Истоке» мы понимаем: принять решение о вызове — это шаг, требующий смелости. Особенно если речь идёт о близком человеке, который отрицает наличие проблемы. Именно поэтому наши врачи умеют работать тактично, без давления. Мы не заставляем — мы объясняем. Спокойно, профессионально и по-человечески.
Углубиться в тему – vyvod-iz-zapoya-anonimno-ehlektrostal
Обратившись к нам, вы получите анонимное и безопасное лечение, полностью соответствующее медицинским стандартам.
Получить больше информации – нарколог на дом анонимно
Запой – это серьезная проблема, когда организм перестает работать без постоянного поступления алкоголя. Из-за запоя токсины отравляют организм, нарушая работу органов и снижая иммунитет. Попытки самостоятельно бросить пить во время запоя могут привести к ухудшению самочувствия. «Семья и Здоровье» лечит запой на дому – это удобно и снижает стресс. Мы приедем в любое время суток и проведем все процедуры для восстановления здоровья. Длительное пьянство может привести к опасным для жизни осложнениям. Нельзя затягивать с лечением запоя, это может привести к серьезным последствиям.
Подробнее можно узнать тут – http://vyvod-iz-zapoya-krasnoyarsk0.ru
В «Чистом Дыхании» вы встретите врачей-наркологов, психиатров и психологов с многолетним опытом, готовых приехать на дом для первичной детоксикации или принять в стационаре для углублённой терапии. Мы соблюдаем строгие медицинские протоколы и гарантируем безопасность даже в самых тяжёлых случаях.
Углубиться в тему – https://narkologicheskaya-klinika-dolgoprudnyj3.ru/chastnaya-narkologicheskaya-klinika-v-dolgoprudnom/
После поступления вызова наш нарколог выезжает к пациенту в кратчайшие сроки, прибывая по адресу в пределах 30–60 минут. Специалист начинает процедуру с подробного осмотра и диагностики, измеряя ключевые показатели организма: артериальное давление, частоту пульса, насыщенность кислородом и собирая подробный анамнез.
Выяснить больше – нарколог на дом новосибирск
Врачи клиники «ВитаЛайн» для снятия интоксикации и облегчения состояния пациента применяют исключительно качественные и проверенные лекарственные препараты, подбирая их в зависимости от особенностей ситуации и состояния здоровья пациента:
Получить дополнительные сведения – http://www.domen.ru
Эта публикация дает возможность задействовать различные источники информации и представить их в удобной форме. Читатели смогут быстро найти нужные данные и получить ответы на интересующие их вопросы. Мы стремимся к четкости и доступности материала для всех!
Ознакомьтесь с аналитикой – https://tradingtree.com.au/product/shiraz-semi-cured-gel-nail-stickers
В этом обзорном материале представлены увлекательные детали, которые находят отражение в различных аспектах жизни. Мы исследуем непонятные и интересные моменты, позволяя читателю увидеть картину целиком. Погрузитесь в мир знаний и удивительных открытий!
Погрузиться в детали – https://www.p2law.com.br/o-direito-de-imagem-empresarial-e-sua-protecao-legal
Вывод из запоя в Нижнем Тагиле представляет собой комплекс медицинских мероприятий, направленных на безопасное и эффективное прерывание состояния острого алкогольного отравления. Этот процесс требует профессионального подхода, так как самостоятельное прерывание запоя чревато серьезными осложнениями, включая судороги, инсульты и инфаркты. В медицинской практике используется комплекс мер, включающий детоксикацию организма, коррекцию водно-электролитного баланса и лечение симптомов абстиненции.
Исследовать вопрос подробнее – вывод из запоя клиника
Эта публикация дает возможность задействовать различные источники информации и представить их в удобной форме. Читатели смогут быстро найти нужные данные и получить ответы на интересующие их вопросы. Мы стремимся к четкости и доступности материала для всех!
Смотрите также… – https://www.maldegemsemotorrit.be/cropped-motorrit-jpg
Эта обзорная заметка содержит ключевые моменты и факты по актуальным вопросам. Она поможет читателям быстро ориентироваться в теме и узнать о самых важных аспектах сегодня. Получите краткий курс по современной информации и оставайтесь в курсе событий!
Нажми и узнай всё – https://www.terra-base.de/portfolio/et-vestibulum-quis-a-suspendisse
Эта статья для ознакомления предлагает читателям общее представление об актуальной теме. Мы стремимся представить ключевые факты и идеи, которые помогут читателям получить представление о предмете и решить, стоит ли углубляться в изучение.
Нажмите, чтобы узнать больше – https://designingsarasota.com/project-view/dr-karen-leggett-womens-midlife-specialist
Этот текст сочетает в себе элементы познавательного рассказа и аналитической подачи информации. Читатель получает доступ к уникальным данным, которые соединяют прошлое с настоящим и открывают двери в будущее.
Информация доступна здесь – https://reginalog.com/?p=277
Эта публикация дает возможность задействовать различные источники информации и представить их в удобной форме. Читатели смогут быстро найти нужные данные и получить ответы на интересующие их вопросы. Мы стремимся к четкости и доступности материала для всех!
Неизвестные факты о… – https://rus.uniza.sk/archiv/327
Эта обзорная заметка содержит ключевые моменты и факты по актуальным вопросам. Она поможет читателям быстро ориентироваться в теме и узнать о самых важных аспектах сегодня. Получите краткий курс по современной информации и оставайтесь в курсе событий!
Детальнее – https://f5fashion.vn/top-voi-hon-67-ve-xe-lexus-lx570-hay-nhat
Эта обзорная заметка содержит ключевые моменты и факты по актуальным вопросам. Она поможет читателям быстро ориентироваться в теме и узнать о самых важных аспектах сегодня. Получите краткий курс по современной информации и оставайтесь в курсе событий!
Перейти к статье – https://friendlysweetdesires.com/how-to-know-the-first-step-to-start-a-sport
Публикация приглашает вас исследовать неизведанное — от древних тайн до современных достижений науки. Вы узнаете, как случайные находки превращались в революции, а смелые мысли — в новые эры человеческого прогресса.
Все материалы собраны здесь – http://178evakuator178.ru
Эта публикация дает возможность задействовать различные источники информации и представить их в удобной форме. Читатели смогут быстро найти нужные данные и получить ответы на интересующие их вопросы. Мы стремимся к четкости и доступности материала для всех!
Почему это важно? – https://apds.sn/manifestation-de-soutien-pour-le-mali
Показатель
Получить больше информации – https://narkologicheskaya-klinika-tula10.ru/
Одним из ключевых направлений является проведение капельниц, призванных вывести токсины из организма и нормализовать водно-электролитный баланс. Используемые препараты и состав растворов подбираются индивидуально, исходя из клинической картины и истории болезни пациента.
Выяснить больше – запой нарколог на дом в ярославле
Запой – это крайняя степень алкоголизма, требующая профессионального вмешательства. Нарколог на дом в Волгограде – ваш выбор. Лечение на дому помогает избежать стресса и сохранить анонимность, получив необходимую помощь. Важно как можно быстрее начать лечение, чтобы избежать токсического воздействия алкоголя на организм. Лечение на дому направлено на очищение организма, восстановление баланса и нормальную работу органов. Для достижения долгосрочного результата важно сочетать медикаментозную терапию и психологическую поддержку. Начинаем с детоксикации, используя капельницы и современные препараты.
Узнать больше – волгоград вывод из запоя
В ходе процедуры врач контролирует жизненные показатели пациента, корректирует состав раствора при необходимости и оказывает дополнительную поддержку. После завершения капельницы часто назначается курс восстановительной терапии, направленный на стабилизацию функций организма.
Разобраться лучше – капельница от запоя наркология мурманск
Запой – это серьезная угроза для здоровья. Немедленно вызывайте нарколога на дом в Волгограде! Нарколог приедет к вам быстро, сохранит анонимность и подберет индивидуальное лечение. Мы быстро выведем токсины и вернем вам хорошее самочувствие. В любое время дня и ночи мы готовы приехать и начать лечение. Мы сочетаем медикаменты и психологическую поддержку для успешного лечения. Первый этап лечения – избавление от токсинов с помощью лекарств.
Ознакомиться с деталями – вывод из запоя в волгограде
Медицинская детоксикация — это основа успешного вывода из запоя. Она проводится под строгим контролем врачей-наркологов, которые используют инфузионную терапию для выведения токсинов из организма. В качестве компонентов капельниц применяются растворы глюкозы, физиологический раствор, препараты для восстановления работы печени и почек. Поддержка сердечно-сосудистой системы и нормализация артериального давления достигается с помощью специализированных медикаментов.
Получить дополнительные сведения – vyvod-iz-zapoya-klinika nizhnij tagil
Клиника «ТюменьМед» специализируется на лечении алкогольной зависимости и вывода из запоя с 2010 года. За годы работы накоплен уникальный опыт в проведении комплексной детоксикации, реабилитации и последующего сопровождения пациентов. В основе методик лежат стандарты доказательной медицины, а команда состоит из наркологов, психотерапевтов, заведующих отделением интенсивной терапии и логистов для выездов.
Подробнее – наркологическая клиника цены
Эффективная капельница должна включать несколько компонентов, каждый из которых направлен на решение конкретной задачи: выведение токсинов, восстановление функций организма, нормализация психоэмоционального состояния.
Углубиться в тему – posle-kapelniczy-ot-zapoya pervoural’sk
Вызов нарколога возможен круглосуточно, что обеспечивает оперативное реагирование на критические ситуации. Пациенты и их родственники могут получить помощь в любое время, не дожидаясь ухудшения состояния.
Получить дополнительную информацию – вызов врача нарколога на дом в каменске-уральском
Оперативное лечение организовано по четкому алгоритму, который позволяет быстро стабилизировать состояние пациента и обеспечить эффективную терапию. Каждый этап направлен на комплексное восстановление организма.
Узнать больше – http://vyvod-iz-zapoya-volgograd000.ru/vyvod-iz-zapoya-kapelnicza-volgograd/
Индивидуальный план включает детоксикацию, медикаментозную поддержку, психотерапию и реабилитацию. Специалисты учитывают:
Подробнее можно узнать тут – klinika lecheniya alkogolizma tjumen’
Наши наркологи проводят профессиональную инфузионную детоксикацию, направленную на:
Получить дополнительные сведения – https://narkologicheskaya-klinika-vladimir10.ru
Одним из ключевых этапов терапии является медикаментозное устранение абстинентного синдрома, что значительно облегчает состояние пациента. Для этого используются препараты, рекомендованные к применению ведущими специалистами в области наркологии. Примером могут служить протоколы лечения, описанные на официальном портале наркологической помощи России.
Разобраться лучше – частная наркологическая клиника
Основной этап в лечении — детоксикация организма от токсичных веществ, вызывающих интоксикацию. В клинике применяют современные методы капельниц и медикаментозной поддержки, включая препараты для снятия абстинентного синдрома.
Выяснить больше – chastnaya narkologicheskaya klinika murmansk
Метод лечения
Подробнее – лечение наркомании владимирская область
Как подчёркивает врач-нарколог И.В. Синицин, «современная наркология — это не только вывод из запоя, но и работа с глубинными причинами зависимости».
Подробнее тут – бесплатная наркологическая клиника
Стационарный формат предполагает круглосуточное наблюдение, возможность экстренного вмешательства и доступ к диагностическим средствам. Это особенно важно при наличии хронических заболеваний, психозов или алкогольного делирия.
Подробнее можно узнать тут – вывод из запоя на дому рязань.
Первое, что необходимо уточнить перед вызовом — наличие у врача лицензии и профильного медицинского образования. Только сертифицированный нарколог может назначить препараты, поставить капельницу и провести детоксикацию без ущерба для здоровья пациента.
Получить дополнительную информацию – narkolog-na-dom-czena nizhnij tagil
В Мурманске востребована услуга вызова нарколога на дом для вывода из запоя. Такой подход позволяет провести необходимые процедуры в комфортных условиях, без лишнего стресса для пациента. Врач приезжает с полным набором медикаментов и оборудования, что обеспечивает полноценный и своевременный уход.
Получить больше информации – http://vyvod-iz-zapoya-v-murmanske12.ru/anonimnyj-vyvod-iz-zapoya-v-murmanske/
Запой – опасная стадия алкоголизма, когда организм требует постоянного поступления алкоголя. Лечение на дому – это конфиденциально, удобно и позволяет начать детоксикацию в комфортных условиях. При запое каждая минута на счету, поэтому важно быстро обратиться за помощью. Врач поможет очистить организм от токсинов, восстановить баланс и нормализовать работу внутренних органов. Для успешного лечения запоя важен комплексный подход, включающий лекарства и работу с психологом. Первый шаг – очищение организма от алкоголя с помощью капельниц и других препаратов.
Узнать больше – волгоград вывод из запоя
Работа клиники строится на принципах доказательной медицины и индивидуального подхода. При поступлении пациента осуществляется всесторонняя диагностика, включающая анализы крови, оценку психического состояния и анамнез. По результатам разрабатывается персонализированный курс терапии.
Получить больше информации – наркологическая клиника цены
Таблица 1: Основные признаки профессионального наркологического центра в Туле
Подробнее можно узнать тут – наркологические клиники алкоголизм
Одним из ключевых направлений является проведение капельниц, призванных вывести токсины из организма и нормализовать водно-электролитный баланс. Используемые препараты и состав растворов подбираются индивидуально, исходя из клинической картины и истории болезни пациента.
Углубиться в тему – нарколог на дом клиника в ярославле
Капельница рекомендована при следующих состояниях:
Изучить вопрос глубже – http://kapelnicza-ot-zapoya-v-murmanske12.ru
В статье рассмотрим ключевые моменты, которые помогут сориентироваться при выборе капельницы от запоя, понять механизм действия и особенности процедуры, а также избежать типичных ошибок при обращении за медицинской помощью.
Выяснить больше – http://kapelnicza-ot-zapoya-pervouralsk11.ru
При запое организм отравляется, и нужна экстренная помощь нарколога в Волгограде. Получите квалифицированную помощь на дому, сохраняя конфиденциальность и удобство. Быстрая детоксикация и восстановление здоровья – наша задача. Мы приедем к вам как можно скорее и окажем всю необходимую помощь. Мы подберем лекарства и поможем вам справиться с психологическими проблемами. Начинаем с детоксикации, чтобы очистить организм от вредных веществ.
Детальнее – вывод из запоя на дому волгоград недорого
Запой – это крайняя степень алкоголизма, требующая профессионального вмешательства. Нарколог на дом в Волгограде – ваш выбор. Лечение на дому помогает избежать стресса и сохранить анонимность, получив необходимую помощь. Важно как можно быстрее начать лечение, чтобы избежать токсического воздействия алкоголя на организм. Лечение на дому направлено на очищение организма, восстановление баланса и нормальную работу органов. Для достижения долгосрочного результата важно сочетать медикаментозную терапию и психологическую поддержку. Начинаем с детоксикации, используя капельницы и современные препараты.
Получить дополнительные сведения – вывод из запоя дешево волгоград
Специалист уточняет продолжительность запоя, характер симптоматики и наличие хронических заболеваний, проводит измерения пульса, давления и температуры, что позволяет оперативно скорректировать терапию.
Получить дополнительные сведения – vyvod-iz-zapoya-volgograd000.ru/
Независимо от формы зависимости — алкогольной, опиатной, синтетической или медикаментозной — специалисты подбирают индивидуальный курс терапии. Алгоритмы лечения адаптируются под возраст, стаж употребления, общее состояние организма и наличие сопутствующих заболеваний.
Подробнее – http://narkologicheskaya-klinika-v-yaroslavle12.ru/narkologicheskaya-klinika-telefon-v-yaroslavle/https://narkologicheskaya-klinika-v-yaroslavle12.ru
Продолжительный запой вызывает серьезные нарушения в работе внутренних органов, прежде всего печени, почек и сердца. При выводе из запоя пациенты могут испытывать сильное головокружение, тошноту, повышенную раздражительность, тахикардию и судороги. В таких случаях необходима срочная медицинская помощь, которая позволяет стабилизировать состояние пациента.
Получить больше информации – нарколог вывод из запоя нижний тагил
Индивидуальный план включает детоксикацию, медикаментозную поддержку, психотерапию и реабилитацию. Специалисты учитывают:
Детальнее – центр лечения алкоголизма тюмень
«ВладимирМед» основана группой врачей-наркологов и психотерапевтов, объединивших опыт работы в государственных и частных учреждениях. Мы предлагаем не просто преодоление запоя, а глубокую комплексную реабилитацию, включающую медико-психологическую оценку и долгосрочное сопровождение. Наша цель — восстановление здоровья на физическом и эмоциональном уровнях, возвращение пациента к полноценной социальной жизни без рецидивов.
Исследовать вопрос подробнее – https://narkologicheskaya-klinika-vladimir10.ru/anonimnaya-narkologicheskaya-klinika-vladimir/
Обеспечение своевременной наркологической помощи с выездом на дом в Каменске-Уральском — важный аспект комплексного лечения алкогольной и наркотической зависимости. Услуга вызова нарколога на дом позволяет получить квалифицированную медицинскую помощь в комфортных условиях, что снижает стресс и способствует более быстрому восстановлению.
Выяснить больше – https://narkolog-na-dom-kamensk-uralskij11.ru/chastnyj-narkolog-na-dom-v-kamensk-uralskom
Метод лечения
Ознакомиться с деталями – http://lechenie-narkomanii-vladimir10.ru
Вывод из запоя в Рязани — это комплексная медицинская услуга, направленная на устранение интоксикации, стабилизацию состояния пациента и предотвращение рецидива алкогольной зависимости. Методики подбираются индивидуально с учётом анамнеза, длительности запойного состояния, наличия сопутствующих заболеваний и психоэмоционального фона. Процедура осуществляется под контролем опытных врачей-наркологов с применением сертифицированных препаратов и оборудования.
Выяснить больше – narkolog-vyvod-iz-zapoya rjazan’
Одним из ключевых направлений является проведение капельниц, призванных вывести токсины из организма и нормализовать водно-электролитный баланс. Используемые препараты и состав растворов подбираются индивидуально, исходя из клинической картины и истории болезни пациента.
Узнать больше – http://narkolog-na-dom-v-yaroslavle12.ru
Фундаментом качественного лечения является профессиональная команда. Только при участии врачей-наркологов, психиатров, клинических психологов, терапевтов и консультантов по зависимому поведению можно говорить о комплексной помощи. По словам специалистов ФГБУН «Национальный научный центр наркологии», именно междисциплинарный подход формирует устойчивую динамику на всех этапах терапии — от стабилизации состояния до ресоциализации пациента.
Узнать больше – наркологическая клиника нарколог тула
Процедура капельного введения лекарственных растворов проводится в условиях клиники с соблюдением всех санитарных норм. Пациенту устанавливается капельница, через которую вводятся препараты под контролем медперсонала. В зависимости от состояния пациента и тяжести запоя длительность капельной терапии может варьироваться от 1 до 6 часов.
Подробнее можно узнать тут – капельница от запоя цена мурманск
При запое организм теряет контроль над употреблением алкоголя. В Волгограде вызов нарколога на дом поможет быстро стабилизировать состояние. На дому можно получить квалифицированную помощь, провести детоксикацию и сохранить анонимность. Не затягивайте с вызовом нарколога, чтобы избежать необратимых последствий для организма. Вывод токсинов, восстановление баланса и нормализация работы организма – задачи нарколога на дому. Медикаменты и психология – основа лечения запоя на дому. Детоксикация – первый этап лечения, который проводится с помощью современных препаратов.
Углубиться в тему – вывод из запоя волгоградская область
В статье рассмотрим ключевые моменты, которые помогут сориентироваться при выборе капельницы от запоя, понять механизм действия и особенности процедуры, а также избежать типичных ошибок при обращении за медицинской помощью.
Получить больше информации – https://kapelnicza-ot-zapoya-pervouralsk11.ru/
Современная наркологическая клиника в Мурманске специализируется на комплексном лечении алкогольной, наркотической и других видов зависимости. В условиях МедЦентр Арктика используются проверенные методы диагностики и терапии, позволяющие достичь устойчивой ремиссии и восстановить качество жизни пациента.
Получить больше информации – бесплатная наркологическая клиника
Преимущества вызова нарколога на дом:
Выяснить больше – вывод из запоя клиника в мурманске
Современная наркологическая клиника в Каменске-Уральском предоставляет комплексные услуги по диагностике и лечению различных видов зависимостей. Заболевания, связанные с алкоголизмом и наркоманией, требуют индивидуального подхода и применения современных медицинских технологий. В условиях клиники обеспечивается полный медицинский контроль и психологическая поддержка, что способствует успешной реабилитации пациентов.
Узнать больше – наркологическая клиника
При запое организм отравляется, и нужна экстренная помощь нарколога в Волгограде. Получите квалифицированную помощь на дому, сохраняя конфиденциальность и удобство. Быстрая детоксикация и восстановление здоровья – наша задача. Мы приедем к вам как можно скорее и окажем всю необходимую помощь. Мы подберем лекарства и поможем вам справиться с психологическими проблемами. Начинаем с детоксикации, чтобы очистить организм от вредных веществ.
Ознакомиться с деталями – вывод из запоя волгоград
Первое, что необходимо уточнить перед вызовом — наличие у врача лицензии и профильного медицинского образования. Только сертифицированный нарколог может назначить препараты, поставить капельницу и провести детоксикацию без ущерба для здоровья пациента.
Подробнее – нарколог на дом срочно
Пребывание в стационаре обеспечивает круглосуточный мониторинг состояния, своевременное введение лекарств и защиту пациента от внешних факторов, провоцирующих срыв. Все палаты оснащены необходимым оборудованием, соблюдаются санитарные нормы, а условия размещения соответствуют медицинским стандартам.
Получить дополнительные сведения – https://narkologicheskaya-klinika-v-yaroslavle12.ru/narkologicheskaya-klinika-klinika-pomoshh-v-yaroslavle/
При запое организм теряет контроль над употреблением алкоголя. В Волгограде вызов нарколога на дом поможет быстро стабилизировать состояние. На дому можно получить квалифицированную помощь, провести детоксикацию и сохранить анонимность. Не затягивайте с вызовом нарколога, чтобы избежать необратимых последствий для организма. Вывод токсинов, восстановление баланса и нормализация работы организма – задачи нарколога на дому. Медикаменты и психология – основа лечения запоя на дому. Детоксикация – первый этап лечения, который проводится с помощью современных препаратов.
Углубиться в тему – https://vyvod-iz-zapoya-volgograd0.ru/
Служба круглосуточного вывода из запоя организована таким образом, чтобы обеспечить максимальную оперативность и надежность. Независимо от времени суток, квалифицированные специалисты готовы выехать на дом или принять пациента в медицинском учреждении, чтобы приступить к детоксикации и стабилизации состояния.
Разобраться лучше – http://vyvod-iz-zapoya-volgograd000.ru
Перед началом терапии врач собирает анамнез, оценивает состояние органов-мишеней (печень, почки, сердце), проводит лабораторные тесты на уровень электролитов и маркёры цирроза. Результаты обследования играют ключевую роль при выборе схемы инфузий и психотерапевтических методик.
Исследовать вопрос подробнее – лечение алкоголизма
В статье рассмотрим ключевые моменты, которые помогут сориентироваться при выборе капельницы от запоя, понять механизм действия и особенности процедуры, а также избежать типичных ошибок при обращении за медицинской помощью.
Ознакомиться с деталями – капельница от запоя клиника
Нарколог на дому проводит тщательный осмотр, собирает анамнез и назначает необходимые лабораторные исследования. Это позволяет выявить сопутствующие патологии и скорректировать тактику лечения.
Подробнее тут – вызов врача нарколога на дом
В ходе процедуры врач контролирует жизненные показатели пациента, корректирует состав раствора при необходимости и оказывает дополнительную поддержку. После завершения капельницы часто назначается курс восстановительной терапии, направленный на стабилизацию функций организма.
Изучить вопрос глубже – http://kapelnicza-ot-zapoya-v-murmanske12.ru/postavit-kapelniczu-ot-zapoya-v-murmanske/https://kapelnicza-ot-zapoya-v-murmanske12.ru
На сайте Минздрава указаны общие клинические рекомендации по выведению из запоя, включая допустимые дозировки и протоколы лечения.
Подробнее можно узнать тут – http://vyvod-iz-zapoya-v-ryazani12.ru
Фундаментом качественного лечения является профессиональная команда. Только при участии врачей-наркологов, психиатров, клинических психологов, терапевтов и консультантов по зависимому поведению можно говорить о комплексной помощи. По словам специалистов ФГБУН «Национальный научный центр наркологии», именно междисциплинарный подход формирует устойчивую динамику на всех этапах терапии — от стабилизации состояния до ресоциализации пациента.
Исследовать вопрос подробнее – https://narkologicheskaya-klinika-tula10.ru/chastnaya-narkologicheskaya-klinika-tula
Во Владимире и области работают десятки клиник, предлагающих помощь зависимым, но не все учреждения соответствуют современным медицинским и психологическим стандартам. Чтобы выбрать действительно эффективное лечение, нужно ориентироваться на проверенные критерии. В этом материале мы рассмотрим, на что стоит обратить внимание при выборе наркологического центра.
Углубиться в тему – https://lechenie-narkomanii-vladimir10.ru/lechenie-narkomanii-anonimno-vladimir
Все вызовы фиксируются под кодовым номером без указания ФИО, что обеспечивает полную конфиденциальность каждого пациента.
Подробнее – https://narkologicheskaya-klinika-vladimir10.ru/chastnaya-narkologicheskaya-klinika-vladimir
Работа клиники строится на принципах доказательной медицины и индивидуального подхода. При поступлении пациента осуществляется всесторонняя диагностика, включающая анализы крови, оценку психического состояния и анамнез. По результатам разрабатывается персонализированный курс терапии.
Разобраться лучше – наркологическая клиника рязань
Основной этап в лечении — детоксикация организма от токсичных веществ, вызывающих интоксикацию. В клинике применяют современные методы капельниц и медикаментозной поддержки, включая препараты для снятия абстинентного синдрома.
Исследовать вопрос подробнее – бесплатная наркологическая клиника мурманск
Медицинская детоксикация — это основа успешного вывода из запоя. Она проводится под строгим контролем врачей-наркологов, которые используют инфузионную терапию для выведения токсинов из организма. В качестве компонентов капельниц применяются растворы глюкозы, физиологический раствор, препараты для восстановления работы печени и почек. Поддержка сердечно-сосудистой системы и нормализация артериального давления достигается с помощью специализированных медикаментов.
Подробнее можно узнать тут – https://vyvod-iz-zapoya-nizhnij-tagil11.ru/vyvod-iz-zapoya-na-domu-v-nizhnem-tagile/
Запой – опасная стадия алкоголизма, когда организм требует постоянного поступления алкоголя. Лечение на дому – это конфиденциально, удобно и позволяет начать детоксикацию в комфортных условиях. При запое каждая минута на счету, поэтому важно быстро обратиться за помощью. Врач поможет очистить организм от токсинов, восстановить баланс и нормализовать работу внутренних органов. Для успешного лечения запоя важен комплексный подход, включающий лекарства и работу с психологом. Первый шаг – очищение организма от алкоголя с помощью капельниц и других препаратов.
Получить больше информации – http://vyvod-iz-zapoya-volgograd0.ru/vyvod-iz-zapoya-kruglosutochno-volgograd
При необходимости применяется симптоматическое лечение для снижения болевого синдрома, устранения тошноты и рвоты, а также нормализации психоэмоционального состояния пациента. Врачи наркологи строго контролируют течение процедуры, что обеспечивает безопасность и снижает риски осложнений.
Получить дополнительную информацию – вывод из запоя на дому мурманск.
Запой – это очень опасно, нужно срочно вызывать нарколога на дом в Волгограде! Помощь нарколога на дому – это оперативно, удобно и анонимно. Мы быстро очистим ваш организм от алкоголя и восстановим его работу. Наши специалисты готовы приехать к вам в любое время суток. Лечение комплексное: лекарства, индивидуальный подход и психологическая помощь. Первый шаг – детоксикация, мы поможем вам избавиться от алкогольной интоксикации.
Выяснить больше – срочный вывод из запоя волгоград
Для вызова специалиста необходимо позвонить на горячую линию или оставить заявку через официальный сайт, например, на портале государственных услуг. Специалист приедет в оговоренное время, обеспечив полную анонимность и соблюдение медицинской тайны.
Узнать больше – http://narkolog-na-dom-kamensk-uralskij11.ru
В статье рассмотрим ключевые моменты, которые помогут сориентироваться при выборе капельницы от запоя, понять механизм действия и особенности процедуры, а также избежать типичных ошибок при обращении за медицинской помощью.
Получить больше информации – postavit-kapelniczu-ot-zapoya pervoural’sk
Индивидуальный план включает детоксикацию, медикаментозную поддержку, психотерапию и реабилитацию. Специалисты учитывают:
Подробнее можно узнать тут – https://lechenie-alkogolizma-tyumen10.ru/klinika-lecheniya-alkogolizma-tyumen/
Капельница от запоя применяется для комплексного восстановления организма после длительного употребления алкоголя. Она включает в себя введение растворов, насыщенных витаминами, электролитами, глюкозой и лекарственными средствами, направленными на устранение симптомов интоксикации. Основные задачи процедуры:
Получить дополнительные сведения – https://kapelnicza-ot-zapoya-v-murmanske12.ru/kapelniczy-ot-zapoya-na-domu-v-murmanske
В клинике применяются доказательные методы лечения, соответствующие международным и российским рекомендациям. Основу составляет медикаментозная детоксикация, сопровождаемая психотерапией, когнитивно-поведенческой коррекцией, а также семейной консультацией. При необходимости применяются пролонгированные препараты, облегчающие контроль над тягой к веществу.
Получить больше информации – наркологическая клиника ярославская область
Вывод из запоя в Рязани — это комплексная медицинская услуга, направленная на устранение интоксикации, стабилизацию состояния пациента и предотвращение рецидива алкогольной зависимости. Методики подбираются индивидуально с учётом анамнеза, длительности запойного состояния, наличия сопутствующих заболеваний и психоэмоционального фона. Процедура осуществляется под контролем опытных врачей-наркологов с применением сертифицированных препаратов и оборудования.
Ознакомиться с деталями – вывод из запоя рязань.
Наркологическая помощь на дому в Ярославле охватывает широкий спектр медицинских мероприятий, направленных на стабилизацию состояния пациента и подготовку к дальнейшему лечению. Среди основных процедур:
Выяснить больше – вызвать нарколога на дом в ярославле
Показатель
Ознакомиться с деталями – narkologicheskaya-klinika-tula10.ru/
Оперативное лечение организовано по четкому алгоритму, который позволяет быстро стабилизировать состояние пациента и обеспечить эффективную терапию. Каждый этап направлен на комплексное восстановление организма.
Подробнее тут – http://vyvod-iz-zapoya-volgograd000.ru/vyvod-iz-zapoya-kruglosutochno-volgograd/
Запой – это крайняя степень алкоголизма, требующая профессионального вмешательства. Нарколог на дом в Волгограде – ваш выбор. Лечение на дому помогает избежать стресса и сохранить анонимность, получив необходимую помощь. Важно как можно быстрее начать лечение, чтобы избежать токсического воздействия алкоголя на организм. Лечение на дому направлено на очищение организма, восстановление баланса и нормальную работу органов. Для достижения долгосрочного результата важно сочетать медикаментозную терапию и психологическую поддержку. Начинаем с детоксикации, используя капельницы и современные препараты.
Ознакомиться с деталями – вывод из запоя стационар волгоград
Современная наркологическая клиника в Каменске-Уральском предоставляет комплексные услуги по диагностике и лечению различных видов зависимостей. Заболевания, связанные с алкоголизмом и наркоманией, требуют индивидуального подхода и применения современных медицинских технологий. В условиях клиники обеспечивается полный медицинский контроль и психологическая поддержка, что способствует успешной реабилитации пациентов.
Подробнее – https://narkologicheskaya-klinika-kamensk-uralskij11.ru/narkologicheskaya-klinika-telefon-v-kamensk-uralskom/
Все вызовы фиксируются под кодовым номером без указания ФИО, что обеспечивает полную конфиденциальность каждого пациента.
Ознакомиться с деталями – https://narkologicheskaya-klinika-vladimir10.ru
Как подчёркивает руководитель направления клинической токсикологии НМИЦ психиатрии и наркологии, «оказание помощи на дому требует не меньшего профессионализма, чем лечение в стационаре, ведь врач действует в ограниченных условиях».
Подробнее – http://narkolog-na-dom-nizhnij-tagil11.ru/vyzov-narkologa-na-dom-v-nizhnem-tagile/https://narkolog-na-dom-nizhnij-tagil11.ru
Компоненты
Подробнее – http://www.domen.ru
Основной этап в лечении — детоксикация организма от токсичных веществ, вызывающих интоксикацию. В клинике применяют современные методы капельниц и медикаментозной поддержки, включая препараты для снятия абстинентного синдрома.
Узнать больше – http://narkologicheskaya-klinika-v-murmanske12.ru
При запое организм отравляется, и нужна экстренная помощь нарколога в Волгограде. Получите квалифицированную помощь на дому, сохраняя конфиденциальность и удобство. Быстрая детоксикация и восстановление здоровья – наша задача. Мы приедем к вам как можно скорее и окажем всю необходимую помощь. Мы подберем лекарства и поможем вам справиться с психологическими проблемами. Начинаем с детоксикации, чтобы очистить организм от вредных веществ.
Получить дополнительные сведения – http://vyvod-iz-zapoya-volgograd00.ru/vyvod-iz-zapoya-kruglosutochno-volgograd/
Когда организм уже не может обходиться без алкоголя, возникает запой. Вызов нарколога на дом в Волгограде – это безопасно и эффективно. Нарколог приедет на дом, проведет детоксикацию и поможет стабилизировать состояние, не нарушая привычный ритм жизни. Своевременная помощь нарколога поможет избежать осложнений, вызванных запоем. Дома нарколог поможет очистить организм и восстановить его нормальную работу. Избавление от запоя на дому – это сочетание лекарств и психологической помощи. Сначала нужно очистить организм от токсинов, и в этом помогут специальные препараты.
Исследовать вопрос подробнее – вывод из запоя дешево волгоград
Медицинская детоксикация — это основа успешного вывода из запоя. Она проводится под строгим контролем врачей-наркологов, которые используют инфузионную терапию для выведения токсинов из организма. В качестве компонентов капельниц применяются растворы глюкозы, физиологический раствор, препараты для восстановления работы печени и почек. Поддержка сердечно-сосудистой системы и нормализация артериального давления достигается с помощью специализированных медикаментов.
Углубиться в тему – https://vyvod-iz-zapoya-nizhnij-tagil11.ru/vyvod-iz-zapoya-na-domu-v-nizhnem-tagile
Вывод из запоя требует неотложного и профессионального подхода, поскольку состояние больного сопровождается нарушением работы внутренних органов, обезвоживанием и токсическим воздействием этанола на центральную нервную систему. В Мурманске, учитывая особенности региона и климата, особенно важно проводить процедуру с учётом возможных сопутствующих заболеваний и общего состояния здоровья пациента.
Получить дополнительную информацию – вывод из запоя цена в мурманске
Капельница от запоя в Мурманске является одной из наиболее востребованных процедур для снятия острого состояния алкогольной интоксикации. Эта методика позволяет быстро вывести токсины из организма, нормализовать водно-солевой баланс и улучшить самочувствие пациента. Современная капельная терапия считается эффективным средством в лечении запоя, обеспечивая поддержку жизненно важных функций и минимизируя риски осложнений.
Разобраться лучше – врач на дом капельница от запоя мурманск
Наркологическая помощь на дому в Ярославле охватывает широкий спектр медицинских мероприятий, направленных на стабилизацию состояния пациента и подготовку к дальнейшему лечению. Среди основных процедур:
Подробнее тут – нарколог на дом вывод ярославль
Выбор клиники для лечения наркомании — один из самых ответственных этапов на пути к выздоровлению. От уровня организации помощи зависит не только здоровье пациента, но и его способность вернуться к нормальной жизни. Согласно данным Министерства здравоохранения Российской Федерации, эффективность терапии значительно возрастает при индивидуальном подходе, квалифицированном составе специалистов и наличии комплексных программ, включающих медицинскую и психологическую помощь.
Подробнее можно узнать тут – https://narkologicheskaya-klinika-tula10.ru/chastnaya-narkologicheskaya-klinika-tula/
Как подчёркивает врач-нарколог И.В. Синицин, «современная наркология — это не только вывод из запоя, но и работа с глубинными причинами зависимости».
Углубиться в тему – наркологические клиники алкоголизм ярославль.
Индивидуальный план включает детоксикацию, медикаментозную поддержку, психотерапию и реабилитацию. Специалисты учитывают:
Подробнее – https://lechenie-alkogolizma-tyumen10.ru/klinika-lecheniya-alkogolizma-tyumen/
В рамках услуги вызова нарколога на дом используется современное оборудование и препараты, одобренные для амбулаторного применения.
Получить больше информации – нарколог на дом клиника в каменске-уральском
Специалист уточняет продолжительность запоя, характер симптоматики и наличие хронических заболеваний, проводит измерения пульса, давления и температуры, что позволяет оперативно скорректировать терапию.
Разобраться лучше – https://vyvod-iz-zapoya-volgograd000.ru/vyvod-iz-zapoya-na-domu-volgograd/
Запой – критическая фаза зависимости, когда организм не может регулировать потребление алкоголя. Нарколог поможет провести детоксикацию и стабилизировать состояние в привычной обстановке, сохраняя конфиденциальность. Быстрое вмешательство при запое очень важно, чтобы избежать серьезных последствий для здоровья. Нарколог на дому поможет вывести токсины, восстановить водно-электролитный баланс и нормализовать работу органов. Вывод из запоя на дому включает медикаментозную терапию и психологическую поддержку для долгосрочной ремиссии. Сначала очищают организм от токсинов с помощью внутривенных инфузий и других современных препаратов.
Подробнее – вывод из запоя волгоградская область
Наркологическая клиника в Рязани предоставляет квалифицированную помощь пациентам, страдающим от алкогольной, наркотической и медикаментозной зависимости. Здесь проводится полный цикл медицинской и психотерапевтической поддержки, начиная с детоксикации и заканчивая восстановительным этапом. Учреждение оборудовано современными технологиями, а персонал обладает подтверждённой квалификацией и практическим опытом.
Узнать больше – частная наркологическая клиника рязань.
Компоненты
Получить дополнительную информацию – капельница от запоя наркология
Во Владимире и области работают десятки клиник, предлагающих помощь зависимым, но не все учреждения соответствуют современным медицинским и психологическим стандартам. Чтобы выбрать действительно эффективное лечение, нужно ориентироваться на проверенные критерии. В этом материале мы рассмотрим, на что стоит обратить внимание при выборе наркологического центра.
Получить больше информации – центр лечения наркомании владимир.
Каждый курс инфузий разрабатывается с учётом возраста пациента, сопутствующих заболеваний и длительности запоя, что повышает безопасность и эффективность лечения.
Подробнее тут – https://narkologicheskaya-klinika-vladimir10.ru/anonimnaya-narkologicheskaya-klinika-vladimir
Запой – это очень опасно, нужно срочно вызывать нарколога на дом в Волгограде! Помощь нарколога на дому – это оперативно, удобно и анонимно. Мы быстро очистим ваш организм от алкоголя и восстановим его работу. Наши специалисты готовы приехать к вам в любое время суток. Лечение комплексное: лекарства, индивидуальный подход и психологическая помощь. Первый шаг – детоксикация, мы поможем вам избавиться от алкогольной интоксикации.
Исследовать вопрос подробнее – вывод из запоя цена волгоград
Процедура капельного введения лекарственных растворов проводится в условиях клиники с соблюдением всех санитарных норм. Пациенту устанавливается капельница, через которую вводятся препараты под контролем медперсонала. В зависимости от состояния пациента и тяжести запоя длительность капельной терапии может варьироваться от 1 до 6 часов.
Узнать больше – врача капельницу от запоя
Особенно важны первые дни пребывания, когда проводится диагностика, назначается медикаментозная поддержка и формируется план лечения. Компетентные врачи способны адаптировать программу под физическое и психоэмоциональное состояние пациента, учитывая как длительность употребления, так и возможные сопутствующие диагнозы. На этом этапе важно исключить риски осложнений и создать условия для безопасного перехода к следующему этапу — психологической реабилитации.
Получить больше информации – http://narkologicheskaya-klinika-tula10.ru/
Наркологическая помощь на дому в Ярославле охватывает широкий спектр медицинских мероприятий, направленных на стабилизацию состояния пациента и подготовку к дальнейшему лечению. Среди основных процедур:
Изучить вопрос глубже – нарколог на дом клиника
Первое, что необходимо уточнить перед вызовом — наличие у врача лицензии и профильного медицинского образования. Только сертифицированный нарколог может назначить препараты, поставить капельницу и провести детоксикацию без ущерба для здоровья пациента.
Узнать больше – нарколог на дом клиника нижний тагил
Для успешной адаптации пациента в обществе клиника организует поддержку родственников и последующее наблюдение. Это снижает риск рецидива и помогает сохранить достигнутые результаты.
Подробнее – частная наркологическая клиника мурманск
Когда организм уже не может обходиться без алкоголя, возникает запой. Вызов нарколога на дом в Волгограде – это безопасно и эффективно. Нарколог приедет на дом, проведет детоксикацию и поможет стабилизировать состояние, не нарушая привычный ритм жизни. Своевременная помощь нарколога поможет избежать осложнений, вызванных запоем. Дома нарколог поможет очистить организм и восстановить его нормальную работу. Избавление от запоя на дому – это сочетание лекарств и психологической помощи. Сначала нужно очистить организм от токсинов, и в этом помогут специальные препараты.
Узнать больше – вывод из запоя на дому волгоград недорого
Одним из ключевых этапов терапии является медикаментозное устранение абстинентного синдрома, что значительно облегчает состояние пациента. Для этого используются препараты, рекомендованные к применению ведущими специалистами в области наркологии. Примером могут служить протоколы лечения, описанные на официальном портале наркологической помощи России.
Получить дополнительную информацию – https://narkologicheskaya-klinika-kamensk-uralskij11.ru/narkologicheskaya-klinika-telefon-v-kamensk-uralskom/
В клинике применяются доказательные методы лечения, соответствующие международным и российским рекомендациям. Основу составляет медикаментозная детоксикация, сопровождаемая психотерапией, когнитивно-поведенческой коррекцией, а также семейной консультацией. При необходимости применяются пролонгированные препараты, облегчающие контроль над тягой к веществу.
Разобраться лучше – http://narkologicheskaya-klinika-v-yaroslavle12.ru/narkologicheskaya-klinika-telefon-v-yaroslavle/
Медицинская детоксикация — это основа успешного вывода из запоя. Она проводится под строгим контролем врачей-наркологов, которые используют инфузионную терапию для выведения токсинов из организма. В качестве компонентов капельниц применяются растворы глюкозы, физиологический раствор, препараты для восстановления работы печени и почек. Поддержка сердечно-сосудистой системы и нормализация артериального давления достигается с помощью специализированных медикаментов.
Узнать больше – вывод из запоя капельница
В статье рассмотрим ключевые моменты, которые помогут сориентироваться при выборе капельницы от запоя, понять механизм действия и особенности процедуры, а также избежать типичных ошибок при обращении за медицинской помощью.
Детальнее – капельница от запоя выезд первоуральск
Специалист уточняет продолжительность запоя, характер симптоматики и наличие хронических заболеваний, проводит измерения пульса, давления и температуры, что позволяет оперативно скорректировать терапию.
Подробнее – вывод из запоя на дому цена
Преимущества вызова нарколога на дом:
Подробнее – вывод из запоя цена мурманск.
В условиях стационара или на дневном стационаре применяются сбалансированные инфузионные растворы, витамины, антиоксиданты и препараты для поддержки печени. Цель — минимизировать интоксикацию и предотвратить осложнения.
Изучить вопрос глубже – lechenie-alkogolizma-tyumen10.ru/
Капельница от запоя в Мурманске является одной из наиболее востребованных процедур для снятия острого состояния алкогольной интоксикации. Эта методика позволяет быстро вывести токсины из организма, нормализовать водно-солевой баланс и улучшить самочувствие пациента. Современная капельная терапия считается эффективным средством в лечении запоя, обеспечивая поддержку жизненно важных функций и минимизируя риски осложнений.
Подробнее – капельница от запоя клиника мурманск
Запой – критическая фаза зависимости, когда организм не может регулировать потребление алкоголя. Нарколог поможет провести детоксикацию и стабилизировать состояние в привычной обстановке, сохраняя конфиденциальность. Быстрое вмешательство при запое очень важно, чтобы избежать серьезных последствий для здоровья. Нарколог на дому поможет вывести токсины, восстановить водно-электролитный баланс и нормализовать работу органов. Вывод из запоя на дому включает медикаментозную терапию и психологическую поддержку для долгосрочной ремиссии. Сначала очищают организм от токсинов с помощью внутривенных инфузий и других современных препаратов.
Получить дополнительные сведения – анонимный вывод из запоя волгоград
Согласно данным Федерального наркологического центра, своевременный выезд врача снижает риск осложнений и повторных госпитализаций.
Подробнее можно узнать тут – narkolog-na-dom-kruglosutochno kamensk-ural’skij
Запой – это серьезная угроза для здоровья. Немедленно вызывайте нарколога на дом в Волгограде! Нарколог приедет к вам быстро, сохранит анонимность и подберет индивидуальное лечение. Мы быстро выведем токсины и вернем вам хорошее самочувствие. В любое время дня и ночи мы готовы приехать и начать лечение. Мы сочетаем медикаменты и психологическую поддержку для успешного лечения. Первый этап лечения – избавление от токсинов с помощью лекарств.
Подробнее тут – срочный вывод из запоя волгоград
Во многих регионах, в том числе и в Тульской области, работают десятки учреждений, предоставляющих услуги по наркологической помощи. Однако далеко не каждое из них соответствует современным стандартам. Часть клиник работает без лицензии, другие используют устаревшие методики или предлагают исключительно детоксикацию, без последующей психотерапевтической поддержки. Чтобы не ошибиться, важно заранее проанализировать основные характеристики надёжного медицинского учреждения.
Подробнее тут – наркологическая клиника нарколог тула
Подробности о технологии и методах выезда нарколога можно найти на официальных медицинских порталах, таких как Российское общество наркологов и Минздрав РФ.
Выяснить больше – врач нарколог на дом ярославская область
Борьба с наркотической зависимостью требует системного подхода и участия опытных специалистов. Важно понимать, что лечение наркомании — это не только снятие ломки, но и длительная психотерапия, обучение новым моделям поведения, работа с семьёй. Согласно рекомендациям Минздрава РФ, наиболее стабильные результаты достигаются при прохождении курса реабилитации под наблюдением профессиональной команды в специализированном центре.
Выяснить больше – центр лечения наркомании владимир
В статье рассмотрим ключевые моменты, которые помогут сориентироваться при выборе капельницы от запоя, понять механизм действия и особенности процедуры, а также избежать типичных ошибок при обращении за медицинской помощью.
Подробнее – https://kapelnicza-ot-zapoya-pervouralsk11.ru/kapelniczy-ot-zapoya-na-domu-v-pervouralske
Пребывание в стационаре обеспечивает круглосуточный мониторинг состояния, своевременное введение лекарств и защиту пациента от внешних факторов, провоцирующих срыв. Все палаты оснащены необходимым оборудованием, соблюдаются санитарные нормы, а условия размещения соответствуют медицинским стандартам.
Изучить вопрос глубже – наркологические клиники алкоголизм ярославль.
Все вызовы фиксируются под кодовым номером без указания ФИО, что обеспечивает полную конфиденциальность каждого пациента.
Подробнее можно узнать тут – http://narkologicheskaya-klinika-vladimir10.ru
При запое организм теряет контроль над употреблением алкоголя. В Волгограде вызов нарколога на дом поможет быстро стабилизировать состояние. На дому можно получить квалифицированную помощь, провести детоксикацию и сохранить анонимность. Не затягивайте с вызовом нарколога, чтобы избежать необратимых последствий для организма. Вывод токсинов, восстановление баланса и нормализация работы организма – задачи нарколога на дому. Медикаменты и психология – основа лечения запоя на дому. Детоксикация – первый этап лечения, который проводится с помощью современных препаратов.
Выяснить больше – вывод. из. запоя. волгоград.
Специалист уточняет продолжительность запоя, характер симптоматики и наличие хронических заболеваний, проводит измерения пульса, давления и температуры, что позволяет оперативно скорректировать терапию.
Ознакомиться с деталями – вывод из запоя волгоград
Как подчёркивает руководитель направления клинической токсикологии НМИЦ психиатрии и наркологии, «оказание помощи на дому требует не меньшего профессионализма, чем лечение в стационаре, ведь врач действует в ограниченных условиях».
Подробнее – https://narkolog-na-dom-nizhnij-tagil11.ru/narkolog-na-dom-czeny-v-nizhnem-tagile/
Капельница от запоя в Мурманске является одной из наиболее востребованных процедур для снятия острого состояния алкогольной интоксикации. Эта методика позволяет быстро вывести токсины из организма, нормализовать водно-солевой баланс и улучшить самочувствие пациента. Современная капельная терапия считается эффективным средством в лечении запоя, обеспечивая поддержку жизненно важных функций и минимизируя риски осложнений.
Получить дополнительные сведения – капельница от запоя цена мурманск.
Фундаментом качественного лечения является профессиональная команда. Только при участии врачей-наркологов, психиатров, клинических психологов, терапевтов и консультантов по зависимому поведению можно говорить о комплексной помощи. По словам специалистов ФГБУН «Национальный научный центр наркологии», именно междисциплинарный подход формирует устойчивую динамику на всех этапах терапии — от стабилизации состояния до ресоциализации пациента.
Разобраться лучше – наркологические клиники алкоголизм тула
Стоимость услуг зависит от продолжительности терапии, сложности случая и выбранных процедур. Однако клиника предоставляет гибкую систему оплаты, включая рассрочку и страховое покрытие.
Выяснить больше – https://narkologicheskaya-klinika-v-ryazani12.ru/
Для успешного лечения зависимости необходима тщательная диагностика. В клинике проводят полное обследование пациента, включающее:
Подробнее – наркологическая клиника
Нарколог на дому проводит тщательный осмотр, собирает анамнез и назначает необходимые лабораторные исследования. Это позволяет выявить сопутствующие патологии и скорректировать тактику лечения.
Разобраться лучше – https://narkolog-na-dom-v-yaroslavle12.ru/narkolog-na-dom-kruglosutochno-v-yaroslavle
Обширные исследования показывают, что качественная детоксикация снижает риск развития осложнений и способствует скорейшему восстановлению здоровья. Более подробная информация о методах детоксикации доступна на сайте Министерства здравоохранения РФ.
Узнать больше – вывод из запоя на дому нижний тагил.
В условиях стационара или на дневном стационаре применяются сбалансированные инфузионные растворы, витамины, антиоксиданты и препараты для поддержки печени. Цель — минимизировать интоксикацию и предотвратить осложнения.
Получить дополнительную информацию – центр лечения алкоголизма в тюмени
Запой – это серьезная угроза для здоровья. Немедленно вызывайте нарколога на дом в Волгограде! Нарколог приедет к вам быстро, сохранит анонимность и подберет индивидуальное лечение. Мы быстро выведем токсины и вернем вам хорошее самочувствие. В любое время дня и ночи мы готовы приехать и начать лечение. Мы сочетаем медикаменты и психологическую поддержку для успешного лечения. Первый этап лечения – избавление от токсинов с помощью лекарств.
Детальнее – http://vyvod-iz-zapoya-volgograd00.ru/vyvod-iz-zapoya-na-domu-volgograd
Вывод из запоя в Мурманске представляет собой комплекс мероприятий, направленных на оказание медицинской помощи пациентам, находящимся в состоянии алкогольного отравления или длительного употребления спиртного. Процедура проводится с целью стабилизации состояния организма, предупреждения осложнений и минимизации риска развития тяжелых последствий алкоголизма.
Разобраться лучше – нарколог вывод из запоя мурманск
Современная наркологическая клиника в Каменске-Уральском предоставляет комплексные услуги по диагностике и лечению различных видов зависимостей. Заболевания, связанные с алкоголизмом и наркоманией, требуют индивидуального подхода и применения современных медицинских технологий. В условиях клиники обеспечивается полный медицинский контроль и психологическая поддержка, что способствует успешной реабилитации пациентов.
Подробнее – наркологическая клиника на дом
Когда организм уже не может обходиться без алкоголя, возникает запой. Вызов нарколога на дом в Волгограде – это безопасно и эффективно. Нарколог приедет на дом, проведет детоксикацию и поможет стабилизировать состояние, не нарушая привычный ритм жизни. Своевременная помощь нарколога поможет избежать осложнений, вызванных запоем. Дома нарколог поможет очистить организм и восстановить его нормальную работу. Избавление от запоя на дому – это сочетание лекарств и психологической помощи. Сначала нужно очистить организм от токсинов, и в этом помогут специальные препараты.
Подробнее – http://vyvod-iz-zapoya-volgograd0.ru/
Как поясняет врач-нарколог клиники «АлкоСтоп», «грамотно составленная инфузионная терапия не только устраняет последствия запоя, но и создаёт условия для дальнейшей мотивации пациента к лечению».
Получить дополнительные сведения – http://kapelnicza-ot-zapoya-pervouralsk11.ru/kapelniczy-ot-zapoya-na-domu-v-pervouralske/
Метод лечения
Подробнее можно узнать тут – https://lechenie-narkomanii-vladimir10.ru/lechenie-narkomanii-czena-vladimir
Пребывание в стационаре обеспечивает круглосуточный мониторинг состояния, своевременное введение лекарств и защиту пациента от внешних факторов, провоцирующих срыв. Все палаты оснащены необходимым оборудованием, соблюдаются санитарные нормы, а условия размещения соответствуют медицинским стандартам.
Углубиться в тему – chastnaya narkologicheskaya klinika jaroslavl’
Вызов нарколога на дом в Каменске-Уральском обеспечивает безопасность пациента, исключая необходимость посещения медицинского учреждения, что особенно актуально при тяжелом состоянии или психологическом сопротивлении. Такая помощь включает в себя детоксикацию, купирование абстинентного синдрома и консультации по дальнейшему лечению.
Подробнее можно узнать тут – запой нарколог на дом в каменске-уральском
Процедура капельного введения лекарственных растворов проводится в условиях клиники с соблюдением всех санитарных норм. Пациенту устанавливается капельница, через которую вводятся препараты под контролем медперсонала. В зависимости от состояния пациента и тяжести запоя длительность капельной терапии может варьироваться от 1 до 6 часов.
Получить дополнительные сведения – вызвать капельницу от запоя в мурманске
«ВладимирМед» основана группой врачей-наркологов и психотерапевтов, объединивших опыт работы в государственных и частных учреждениях. Мы предлагаем не просто преодоление запоя, а глубокую комплексную реабилитацию, включающую медико-психологическую оценку и долгосрочное сопровождение. Наша цель — восстановление здоровья на физическом и эмоциональном уровнях, возвращение пациента к полноценной социальной жизни без рецидивов.
Ознакомиться с деталями – http://
Вызов нарколога на дом в Ярославле — это удобный и эффективный способ начать лечение или оказать первую помощь при острых состояниях, связанных с алкоголизмом, наркотической зависимостью или другими психоактивными веществами. Основные преимущества такой услуги заключаются в следующем:
Узнать больше – вызов нарколога на дом
Перед началом терапии врач собирает анамнез, оценивает состояние органов-мишеней (печень, почки, сердце), проводит лабораторные тесты на уровень электролитов и маркёры цирроза. Результаты обследования играют ключевую роль при выборе схемы инфузий и психотерапевтических методик.
Углубиться в тему – http://lechenie-alkogolizma-tyumen10.ru/klinika-lecheniya-alkogolizma-tyumen/
Показатель
Выяснить больше – http://narkologicheskaya-klinika-tula10.ru
Запой – критическая фаза зависимости, когда организм не может регулировать потребление алкоголя. Нарколог поможет провести детоксикацию и стабилизировать состояние в привычной обстановке, сохраняя конфиденциальность. Быстрое вмешательство при запое очень важно, чтобы избежать серьезных последствий для здоровья. Нарколог на дому поможет вывести токсины, восстановить водно-электролитный баланс и нормализовать работу органов. Вывод из запоя на дому включает медикаментозную терапию и психологическую поддержку для долгосрочной ремиссии. Сначала очищают организм от токсинов с помощью внутривенных инфузий и других современных препаратов.
Детальнее – вывод из запоя волгоград
Специалист уточняет продолжительность запоя, характер симптоматики и наличие хронических заболеваний, проводит измерения пульса, давления и температуры, что позволяет оперативно скорректировать терапию.
Детальнее – вывод из запоя цена волгоград
Для успешного лечения зависимости необходима тщательная диагностика. В клинике проводят полное обследование пациента, включающее:
Подробнее можно узнать тут – бесплатная наркологическая клиника в мурманске
Эффективная капельница должна включать несколько компонентов, каждый из которых направлен на решение конкретной задачи: выведение токсинов, восстановление функций организма, нормализация психоэмоционального состояния.
Получить больше информации – капельница от запоя на дому цена первоуральск
Вывод из запоя показан при:
Подробнее – http://vyvod-iz-zapoya-v-murmanske12.ru/anonimnyj-vyvod-iz-zapoya-v-murmanske/
Запой – это очень опасно, нужно срочно вызывать нарколога на дом в Волгограде! Помощь нарколога на дому – это оперативно, удобно и анонимно. Мы быстро очистим ваш организм от алкоголя и восстановим его работу. Наши специалисты готовы приехать к вам в любое время суток. Лечение комплексное: лекарства, индивидуальный подход и психологическая помощь. Первый шаг – детоксикация, мы поможем вам избавиться от алкогольной интоксикации.
Ознакомиться с деталями – [url=https://vyvod-iz-zapoya-volgograd00.ru/]нарколог вывод из запоя волгоград[/url]
Метод лечения
Получить дополнительные сведения – [url=https://lechenie-narkomanii-vladimir10.ru/]центр лечения наркомании[/url]
Вызов нарколога на дом — востребованная услуга, позволяющая оказать пациенту помощь в привычной обстановке без необходимости посещения клиники. Особенно актуально это при запойном состоянии, абстинентном синдроме или первых признаках передозировки. Согласно информации Минздрава РФ, амбулаторная помощь эффективна при своевременном обращении и наличии квалифицированной команды специалистов.
Узнать больше – [url=https://narkolog-na-dom-nizhnij-tagil11.ru/]vrach-narkolog-na-dom nizhnij tagil[/url]
Вывод из запоя в Нижнем Тагиле представляет собой комплекс медицинских мероприятий, направленных на безопасное и эффективное прерывание состояния острого алкогольного отравления. Этот процесс требует профессионального подхода, так как самостоятельное прерывание запоя чревато серьезными осложнениями, включая судороги, инсульты и инфаркты. В медицинской практике используется комплекс мер, включающий детоксикацию организма, коррекцию водно-электролитного баланса и лечение симптомов абстиненции.
Подробнее можно узнать тут – наркология вывод из запоя нижний тагил
Когда организм уже не может обходиться без алкоголя, возникает запой. Вызов нарколога на дом в Волгограде – это безопасно и эффективно. Нарколог приедет на дом, проведет детоксикацию и поможет стабилизировать состояние, не нарушая привычный ритм жизни. Своевременная помощь нарколога поможет избежать осложнений, вызванных запоем. Дома нарколог поможет очистить организм и восстановить его нормальную работу. Избавление от запоя на дому – это сочетание лекарств и психологической помощи. Сначала нужно очистить организм от токсинов, и в этом помогут специальные препараты.
Подробнее можно узнать тут – https://vyvod-iz-zapoya-volgograd0.ru/vyvod-iz-zapoya-kruglosutochno-volgograd/
Капельница рекомендована при следующих состояниях:
Подробнее можно узнать тут – http://www.domen.ru
Наркологическая клиника в Ярославле представляет собой специализированное учреждение, оказывающее медицинскую помощь пациентам с алкогольной, наркотической и медикаментозной зависимостью. Ключевыми направлениями работы являются детоксикация, стабилизация состояния, последующее реабилитационное сопровождение и профилактика рецидивов. Комплексный подход к лечению обеспечивается взаимодействием специалистов различных профилей, включая наркологов, психиатров, психотерапевтов и медицинских сестёр.
Ознакомиться с деталями – https://narkologicheskaya-klinika-v-yaroslavle12.ru
После диагностики врач назначает препараты, направленные на снижение абстинентного синдрома, коррекцию психоэмоционального состояния и профилактику осложнений.
Получить больше информации – https://narkolog-na-dom-v-yaroslavle12.ru/narkolog-na-dom-kruglosutochno-v-yaroslavle/
Мы оказываем услуги 24 часа в сутки, 7 дней в неделю, без выходных и праздников. Это позволяет:
Углубиться в тему – http://narkologicheskaya-klinika-vladimir10.ru/chastnaya-narkologicheskaya-klinika-vladimir/https://narkologicheskaya-klinika-vladimir10.ru
Фундаментом качественного лечения является профессиональная команда. Только при участии врачей-наркологов, психиатров, клинических психологов, терапевтов и консультантов по зависимому поведению можно говорить о комплексной помощи. По словам специалистов ФГБУН «Национальный научный центр наркологии», именно междисциплинарный подход формирует устойчивую динамику на всех этапах терапии — от стабилизации состояния до ресоциализации пациента.
Детальнее – наркологическая клиника цены в туле
Индивидуальный план включает детоксикацию, медикаментозную поддержку, психотерапию и реабилитацию. Специалисты учитывают:
Подробнее – анонимное лечение алкоголизма тюмень
Современная наркологическая клиника в Каменске-Уральском предоставляет комплексные услуги по диагностике и лечению различных видов зависимостей. Заболевания, связанные с алкоголизмом и наркоманией, требуют индивидуального подхода и применения современных медицинских технологий. В условиях клиники обеспечивается полный медицинский контроль и психологическая поддержка, что способствует успешной реабилитации пациентов.
Исследовать вопрос подробнее – наркологическая клиника цены в каменске-уральском
Назначение
Подробнее – https://kapelnicza-ot-zapoya-pervouralsk11.ru/kapelnicza-ot-zapoya-na-domu-stoimost-v-pervouralske
Служба круглосуточного вывода из запоя организована таким образом, чтобы обеспечить максимальную оперативность и надежность. Независимо от времени суток, квалифицированные специалисты готовы выехать на дом или принять пациента в медицинском учреждении, чтобы приступить к детоксикации и стабилизации состояния.
Изучить вопрос глубже – https://vyvod-iz-zapoya-volgograd000.ru/vyvod-iz-zapoya-kapelnicza-volgograd/
Современная наркологическая клиника в Мурманске специализируется на комплексном лечении алкогольной, наркотической и других видов зависимости. В условиях МедЦентр Арктика используются проверенные методы диагностики и терапии, позволяющие достичь устойчивой ремиссии и восстановить качество жизни пациента.
Ознакомиться с деталями – http://narkologicheskaya-klinika-v-murmanske12.ru/chastnaya-narkologicheskaya-klinika-v-murmanske/
Запой – критическая фаза зависимости, когда организм не может регулировать потребление алкоголя. Нарколог поможет провести детоксикацию и стабилизировать состояние в привычной обстановке, сохраняя конфиденциальность. Быстрое вмешательство при запое очень важно, чтобы избежать серьезных последствий для здоровья. Нарколог на дому поможет вывести токсины, восстановить водно-электролитный баланс и нормализовать работу органов. Вывод из запоя на дому включает медикаментозную терапию и психологическую поддержку для долгосрочной ремиссии. Сначала очищают организм от токсинов с помощью внутривенных инфузий и других современных препаратов.
Подробнее – vyvod-iz-zapoya-volgograd0.ru/
Услуга
Детальнее – наркологическая клиника на дом
Согласно данным Федерального наркологического центра, своевременный выезд врача снижает риск осложнений и повторных госпитализаций.
Разобраться лучше – https://narkolog-na-dom-kamensk-uralskij11.ru
Запой – это очень опасно, нужно срочно вызывать нарколога на дом в Волгограде! Помощь нарколога на дому – это оперативно, удобно и анонимно. Мы быстро очистим ваш организм от алкоголя и восстановим его работу. Наши специалисты готовы приехать к вам в любое время суток. Лечение комплексное: лекарства, индивидуальный подход и психологическая помощь. Первый шаг – детоксикация, мы поможем вам избавиться от алкогольной интоксикации.
Получить дополнительную информацию – клиника вывод из запоя волгоград
Для эффективного вывода из запоя в Мурманске используются современные методы детоксикации, включающие внутривенное введение растворов, направленных на восстановление водно-солевого баланса, коррекцию электролитов и нормализацию работы почек и печени. Важным этапом является использование витаминных комплексов и препаратов, поддерживающих работу сердца и сосудов.
Получить больше информации – вывод из запоя круглосуточно
Первый и самый важный момент — какие методики применяются в клинике. Качественное лечение наркозависимости включает несколько этапов: детоксикация, стабилизация состояния, психотерапия, ресоциализация. Одного лишь выведения токсинов из организма недостаточно — без проработки психологических причин употребления высокий риск рецидива.
Ознакомиться с деталями – http://lechenie-narkomanii-vladimir10.ru/lechenie-narkomanii-anonimno-vladimir/
Процедура капельного введения лекарственных растворов проводится в условиях клиники с соблюдением всех санитарных норм. Пациенту устанавливается капельница, через которую вводятся препараты под контролем медперсонала. В зависимости от состояния пациента и тяжести запоя длительность капельной терапии может варьироваться от 1 до 6 часов.
Узнать больше – капельница от запоя на дому мурманск.
Нарколог на дому проводит тщательный осмотр, собирает анамнез и назначает необходимые лабораторные исследования. Это позволяет выявить сопутствующие патологии и скорректировать тактику лечения.
Получить дополнительную информацию – нарколог на дом недорого ярославль
Лечение хронического алкоголизма начинается с купирования абстинентного синдрома, после чего проводятся мероприятия по нормализации работы печени, сердечно-сосудистой и нервной системы. Назначаются гепатопротекторы, ноотропы, витамины группы B. Также проводится противорецидивная терапия.
Ознакомиться с деталями – http://narkologicheskaya-klinika-v-yaroslavle12.ru/narkologicheskaya-klinika-telefon-v-yaroslavle/https://narkologicheskaya-klinika-v-yaroslavle12.ru
Запой – это крайняя степень алкоголизма, требующая профессионального вмешательства. Нарколог на дом в Волгограде – ваш выбор. Лечение на дому помогает избежать стресса и сохранить анонимность, получив необходимую помощь. Важно как можно быстрее начать лечение, чтобы избежать токсического воздействия алкоголя на организм. Лечение на дому направлено на очищение организма, восстановление баланса и нормальную работу органов. Для достижения долгосрочного результата важно сочетать медикаментозную терапию и психологическую поддержку. Начинаем с детоксикации, используя капельницы и современные препараты.
Ознакомиться с деталями – vivod iz zapoya volgograd
Возможные признаки
Разобраться лучше – https://narkologicheskaya-klinika-tula10.ru/anonimnaya-narkologicheskaya-klinika-tula
Как отмечает врач-нарколог Иванов И.И., «без своевременной медицинской помощи при запое повышается риск необратимых изменений в организме и летального исхода».
Изучить вопрос глубже – vyvod-iz-zapoya-kruglosutochno nizhnij tagil
В статье рассмотрим ключевые моменты, которые помогут сориентироваться при выборе капельницы от запоя, понять механизм действия и особенности процедуры, а также избежать типичных ошибок при обращении за медицинской помощью.
Детальнее – https://kapelnicza-ot-zapoya-pervouralsk11.ru/kapelniczy-ot-zapoya-na-domu-v-pervouralske
Критерий
Подробнее – https://narkolog-na-dom-nizhnij-tagil11.ru/narkolog-na-dom-kruglosutochno-v-nizhnem-tagile
Клиника «ВладимирМед» предоставляет круглосуточную анонимную помощь при алкогольной зависимости с возможностью выезда врача на дом. Мы объединяем профессиональную наркологию, психологическую поддержку и современные технологии детоксикации, чтобы каждый пациент мог получить комплексное лечение в безопасной и комфортной обстановке. Конфиденциальность и оперативность — ключевые принципы нашей работы, помогающие начать новый этап жизни без страха осуждения и лишних процедур.
Получить больше информации – http://www.domen.ru
Специалист уточняет продолжительность запоя, характер симптоматики и наличие хронических заболеваний, проводит измерения пульса, давления и температуры, что позволяет оперативно скорректировать терапию.
Разобраться лучше – вывод из запоя круглосуточно в волгограде
Запой – потеря контроля над алкоголем и резкое отравление организма. Лечение на дому – это быстро, конфиденциально и с индивидуальным подходом. Экстренный вывод из запоя – это быстрая детоксикация и восстановление обмена веществ. Мы выезжаем круглосуточно, чтобы оперативно оценить состояние и начать лечение. На дому мы используем лекарства и психологическую поддержку для достижения максимального эффекта. Мы сначала очистим организм от алкоголя с помощью специальных лекарств.
Подробнее тут – клиника вывод из запоя волгоград
Когда организм уже не может обходиться без алкоголя, возникает запой. Вызов нарколога на дом в Волгограде – это безопасно и эффективно. Нарколог приедет на дом, проведет детоксикацию и поможет стабилизировать состояние, не нарушая привычный ритм жизни. Своевременная помощь нарколога поможет избежать осложнений, вызванных запоем. Дома нарколог поможет очистить организм и восстановить его нормальную работу. Избавление от запоя на дому – это сочетание лекарств и психологической помощи. Сначала нужно очистить организм от токсинов, и в этом помогут специальные препараты.
Выяснить больше – vyvod-iz-zapoya-volgograd0.ru/
В ходе процедуры врач контролирует жизненные показатели пациента, корректирует состав раствора при необходимости и оказывает дополнительную поддержку. После завершения капельницы часто назначается курс восстановительной терапии, направленный на стабилизацию функций организма.
Узнать больше – врач на дом капельница от запоя
Точная диагностика позволяет подобрать индивидуальную программу лечения, что значительно повышает шансы на успешное выздоровление.
Детальнее – наркологическая клиника в мурманске
Первый и самый важный момент — какие методики применяются в клинике. Качественное лечение наркозависимости включает несколько этапов: детоксикация, стабилизация состояния, психотерапия, ресоциализация. Одного лишь выведения токсинов из организма недостаточно — без проработки психологических причин употребления высокий риск рецидива.
Разобраться лучше – http://www.domen.ru
Обеспечение своевременной наркологической помощи с выездом на дом в Каменске-Уральском — важный аспект комплексного лечения алкогольной и наркотической зависимости. Услуга вызова нарколога на дом позволяет получить квалифицированную медицинскую помощь в комфортных условиях, что снижает стресс и способствует более быстрому восстановлению.
Подробнее можно узнать тут – нарколог на дом вывод из запоя в каменске-уральском
Нарколог на дому проводит тщательный осмотр, собирает анамнез и назначает необходимые лабораторные исследования. Это позволяет выявить сопутствующие патологии и скорректировать тактику лечения.
Подробнее – http://narkolog-na-dom-v-yaroslavle12.ru
В клинике созданы комфортные условия для прохождения лечения. Пациенты получают не только медицинскую помощь, но и социальную поддержку, что способствует быстрому восстановлению и возвращению к нормальной жизни. Узнать больше о формате лечения и условиях можно на официальном сайте клиники.
Узнать больше – наркологическая клиника
В статье рассмотрим ключевые моменты, которые помогут сориентироваться при выборе капельницы от запоя, понять механизм действия и особенности процедуры, а также избежать типичных ошибок при обращении за медицинской помощью.
Узнать больше – после капельницы от запоя в первоуральске
Преимущества вызова нарколога на дом:
Получить больше информации – вывод из запоя клиника
Как подчёркивает врач-нарколог И.В. Синицин, «современная наркология — это не только вывод из запоя, но и работа с глубинными причинами зависимости».
Ознакомиться с деталями – наркологическая клиника нарколог
Фундаментом качественного лечения является профессиональная команда. Только при участии врачей-наркологов, психиатров, клинических психологов, терапевтов и консультантов по зависимому поведению можно говорить о комплексной помощи. По словам специалистов ФГБУН «Национальный научный центр наркологии», именно междисциплинарный подход формирует устойчивую динамику на всех этапах терапии — от стабилизации состояния до ресоциализации пациента.
Получить больше информации – платная наркологическая клиника
Запой – это крайняя степень алкоголизма, требующая профессионального вмешательства. Нарколог на дом в Волгограде – ваш выбор. Лечение на дому помогает избежать стресса и сохранить анонимность, получив необходимую помощь. Важно как можно быстрее начать лечение, чтобы избежать токсического воздействия алкоголя на организм. Лечение на дому направлено на очищение организма, восстановление баланса и нормальную работу органов. Для достижения долгосрочного результата важно сочетать медикаментозную терапию и психологическую поддержку. Начинаем с детоксикации, используя капельницы и современные препараты.
Выяснить больше – вывести из запоя
Эффективное лечение требует поэтапного подхода, который реализуется следующим образом:
Исследовать вопрос подробнее – http://narkologicheskaya-klinika-v-ryazani12.ru
Экстренная помощь требуется, когда запой начинает негативно сказываться на здоровье, и самостоятельное прекращение употребления алкоголя становится невозможным. Основные показания для круглосуточного вмешательства включают:
Углубиться в тему – vyvod-iz-zapoya-na-domu volgograd
Медицинская детоксикация — это основа успешного вывода из запоя. Она проводится под строгим контролем врачей-наркологов, которые используют инфузионную терапию для выведения токсинов из организма. В качестве компонентов капельниц применяются растворы глюкозы, физиологический раствор, препараты для восстановления работы печени и почек. Поддержка сердечно-сосудистой системы и нормализация артериального давления достигается с помощью специализированных медикаментов.
Подробнее – вывод из запоя капельница
При своевременном обращении к специалистам капельница позволяет значительно улучшить состояние пациента уже в первые часы после начала лечения. Медицинская помощь при запое должна оказываться квалифицированно и в комфортных условиях, что снижает риски осложнений и ускоряет восстановление.
Подробнее – https://kapelnicza-ot-zapoya-v-murmanske12.ru/kapelniczy-ot-zapoya-na-domu-v-murmanske/
«ВладимирМед» основана группой врачей-наркологов и психотерапевтов, объединивших опыт работы в государственных и частных учреждениях. Мы предлагаем не просто преодоление запоя, а глубокую комплексную реабилитацию, включающую медико-психологическую оценку и долгосрочное сопровождение. Наша цель — восстановление здоровья на физическом и эмоциональном уровнях, возвращение пациента к полноценной социальной жизни без рецидивов.
Получить больше информации – https://narkologicheskaya-klinika-vladimir10.ru/anonimnaya-narkologicheskaya-klinika-vladimir/
Теряете контроль над алкоголем? Экстренная помощь нарколога на дому в Волгограде – это выход! Лечитесь дома! Это быстро, удобно, анонимно и эффективно. Быстрая детоксикация – первый шаг к выздоровлению! Мы работаем 24/7, чтобы вы могли получить помощь в любой ситуации. Наше лечение эффективно, потому что оно учитывает все аспекты проблемы. Сначала нужно очистить организм от алкоголя, и мы вам в этом поможем.
Выяснить больше – вывод из запоя на дому волгоград цены
Эффективная капельница должна включать несколько компонентов, каждый из которых направлен на решение конкретной задачи: выведение токсинов, восстановление функций организма, нормализация психоэмоционального состояния.
Получить дополнительную информацию – капельница от запоя цена в первоуральске
Первое, что необходимо уточнить перед вызовом — наличие у врача лицензии и профильного медицинского образования. Только сертифицированный нарколог может назначить препараты, поставить капельницу и провести детоксикацию без ущерба для здоровья пациента.
Получить дополнительную информацию – http://narkolog-na-dom-nizhnij-tagil11.ru/narkolog-na-dom-kruglosutochno-v-nizhnem-tagile/
Наркологическая помощь на дому в Ярославле охватывает широкий спектр медицинских мероприятий, направленных на стабилизацию состояния пациента и подготовку к дальнейшему лечению. Среди основных процедур:
Получить больше информации – нарколог на дом ярославская область
После стабилизации назначаются препараты, снижающие влечение к алкоголю, нормализующие работу нервной системы и улучшающие общее самочувствие. К методам кодирования относятся уколы, вшивание препаратов, аппаратные методики и психотерапевтические техники. Врач всегда индивидуально подбирает программу — с учётом предыдущего опыта, наличия хронических болезней, особенностей организма.
Ознакомиться с деталями – lechenie alkogolizma stoimost
Когда организм уже не может обходиться без алкоголя, возникает запой. Вызов нарколога на дом в Волгограде – это безопасно и эффективно. Нарколог приедет на дом, проведет детоксикацию и поможет стабилизировать состояние, не нарушая привычный ритм жизни. Своевременная помощь нарколога поможет избежать осложнений, вызванных запоем. Дома нарколог поможет очистить организм и восстановить его нормальную работу. Избавление от запоя на дому – это сочетание лекарств и психологической помощи. Сначала нужно очистить организм от токсинов, и в этом помогут специальные препараты.
Получить больше информации – vivod iz zapoya volgograd
Фундаментом качественного лечения является профессиональная команда. Только при участии врачей-наркологов, психиатров, клинических психологов, терапевтов и консультантов по зависимому поведению можно говорить о комплексной помощи. По словам специалистов ФГБУН «Национальный научный центр наркологии», именно междисциплинарный подход формирует устойчивую динамику на всех этапах терапии — от стабилизации состояния до ресоциализации пациента.
Получить больше информации – https://narkologicheskaya-klinika-tula10.ru/chastnaya-narkologicheskaya-klinika-tula
Кодирование от алкоголизма в Пушкино — это современная и надёжная методика лечения, заключающаяся в создании устойчивого барьера к употреблению спиртного. В наркологической клинике «Орион-Клиник» применяется сочетание медицинских и психотерапевтических технологий, благодаря чему пациент получает не только химическое, но и психологическое подкрепление трезвости. Процедура проводится после полной диагностики, с учётом индивидуальных особенностей, анамнеза и текущего состояния организма.
Детальнее – кодирование от алкоголизма на дому
Многие пациенты, обращаясь за помощью, уже имеют опыт самостоятельных попыток прекратить употребление, возможно — неоднократный вывод из запоя или даже амбулаторное лечение. Однако без поддержки со стороны специалистов и внутреннего «якоря» сохранить трезвость удаётся редко. Кодирование как раз и становится этим «якорем» — формирует в человеке стойкое отрицание алкоголя, как на физиологическом, так и на психологическом уровне.
Ознакомиться с деталями – кодирование от алкоголизма в щелково
Обращение к специалисту должно происходить при первых тревожных признаках абстиненции. Сигналом к безотлагательному вызову могут служить:
Узнать больше – https://narkolog-na-dom-ramenskoe4.ru/narkolog-na-dom-ceny-v-ramenskom/
Наркологическая клиника в Ярославле представляет собой специализированное учреждение, оказывающее медицинскую помощь пациентам с алкогольной, наркотической и медикаментозной зависимостью. Ключевыми направлениями работы являются детоксикация, стабилизация состояния, последующее реабилитационное сопровождение и профилактика рецидивов. Комплексный подход к лечению обеспечивается взаимодействием специалистов различных профилей, включая наркологов, психиатров, психотерапевтов и медицинских сестёр.
Подробнее – https://narkologicheskaya-klinika-v-yaroslavle12.ru/narkologicheskaya-klinika-telefon-v-yaroslavle/
Первый и самый важный момент — какие методики применяются в клинике. Качественное лечение наркозависимости включает несколько этапов: детоксикация, стабилизация состояния, психотерапия, ресоциализация. Одного лишь выведения токсинов из организма недостаточно — без проработки психологических причин употребления высокий риск рецидива.
Разобраться лучше – лечение наркомании и алкоголизма владимир.
Для успешного лечения зависимости необходима тщательная диагностика. В клинике проводят полное обследование пациента, включающее:
Ознакомиться с деталями – наркологическая клиника
Существуют определённые признаки, свидетельствующие о необходимости срочного обращения за профессиональной помощью:
Углубиться в тему – vyvod iz zapoya orekhovo zuevo
При необходимости применяется симптоматическое лечение для снижения болевого синдрома, устранения тошноты и рвоты, а также нормализации психоэмоционального состояния пациента. Врачи наркологи строго контролируют течение процедуры, что обеспечивает безопасность и снижает риски осложнений.
Получить дополнительную информацию – срочный вывод из запоя в мурманске
Вывод из запоя в Реутове — это экстренная комплексная помощь при алкогольной интоксикации, направленная на быстрое и безопасное выведение токсинов из организма, восстановление водно-электролитного баланса и купирование опасных симптомов абстинентного синдрома. В наркологической клинике «Феникс-Мед» вы можете заказать выезд квалифицированного врача на дом или пройти лечение в стационаре, доверив своё здоровье команде опытных специалистов.
Подробнее можно узнать тут – вывод из запоя вызов
Запой – критическая фаза зависимости, когда организм не может регулировать потребление алкоголя. Нарколог поможет провести детоксикацию и стабилизировать состояние в привычной обстановке, сохраняя конфиденциальность. Быстрое вмешательство при запое очень важно, чтобы избежать серьезных последствий для здоровья. Нарколог на дому поможет вывести токсины, восстановить водно-электролитный баланс и нормализовать работу органов. Вывод из запоя на дому включает медикаментозную терапию и психологическую поддержку для долгосрочной ремиссии. Сначала очищают организм от токсинов с помощью внутривенных инфузий и других современных препаратов.
Детальнее – https://vyvod-iz-zapoya-volgograd0.ru/
В ходе процедуры врач контролирует жизненные показатели пациента, корректирует состав раствора при необходимости и оказывает дополнительную поддержку. После завершения капельницы часто назначается курс восстановительной терапии, направленный на стабилизацию функций организма.
Разобраться лучше – капельница от запоя выезд в мурманске
Эффективная капельница должна включать несколько компонентов, каждый из которых направлен на решение конкретной задачи: выведение токсинов, восстановление функций организма, нормализация психоэмоционального состояния.
Ознакомиться с деталями – капельница от запоя на дому свердловская область
Обеспечение своевременной наркологической помощи с выездом на дом в Каменске-Уральском — важный аспект комплексного лечения алкогольной и наркотической зависимости. Услуга вызова нарколога на дом позволяет получить квалифицированную медицинскую помощь в комфортных условиях, что снижает стресс и способствует более быстрому восстановлению.
Выяснить больше – http://
Все вызовы фиксируются под кодовым номером без указания ФИО, что обеспечивает полную конфиденциальность каждого пациента.
Исследовать вопрос подробнее – https://narkologicheskaya-klinika-vladimir10.ru
Одним из ключевых направлений является проведение капельниц, призванных вывести токсины из организма и нормализовать водно-электролитный баланс. Используемые препараты и состав растворов подбираются индивидуально, исходя из клинической картины и истории болезни пациента.
Исследовать вопрос подробнее – нарколог на дом срочно
Терапия начинается с подробного обследования: врачи выясняют не только текущее физическое состояние, но и личные мотивы пациента, его страхи и ожидания от лечения. Диагностика включает анализы, ЭКГ, ультразвуковое исследование, а также психодиагностику. Уже на этом этапе формируется контакт между специалистом и пациентом, выстраивается доверие, что крайне важно для успеха последующей терапии.
Выяснить больше – lechenie pivnogo alkogolizma
Служба круглосуточного вывода из запоя организована таким образом, чтобы обеспечить максимальную оперативность и надежность. Независимо от времени суток, квалифицированные специалисты готовы выехать на дом или принять пациента в медицинском учреждении, чтобы приступить к детоксикации и стабилизации состояния.
Подробнее можно узнать тут – http://
Во многих регионах, в том числе и в Тульской области, работают десятки учреждений, предоставляющих услуги по наркологической помощи. Однако далеко не каждое из них соответствует современным стандартам. Часть клиник работает без лицензии, другие используют устаревшие методики или предлагают исключительно детоксикацию, без последующей психотерапевтической поддержки. Чтобы не ошибиться, важно заранее проанализировать основные характеристики надёжного медицинского учреждения.
Подробнее тут – платная наркологическая клиника
Во Владимире и области работают десятки клиник, предлагающих помощь зависимым, но не все учреждения соответствуют современным медицинским и психологическим стандартам. Чтобы выбрать действительно эффективное лечение, нужно ориентироваться на проверенные критерии. В этом материале мы рассмотрим, на что стоит обратить внимание при выборе наркологического центра.
Получить дополнительную информацию – лечение наркомании и алкоголизма
Мы рекомендуем рассмотреть кодирование, если:
Исследовать вопрос подробнее – http://www.domen.ru
Современная наркологическая клиника в Каменске-Уральском предоставляет комплексные услуги по диагностике и лечению различных видов зависимостей. Заболевания, связанные с алкоголизмом и наркоманией, требуют индивидуального подхода и применения современных медицинских технологий. В условиях клиники обеспечивается полный медицинский контроль и психологическая поддержка, что способствует успешной реабилитации пациентов.
Разобраться лучше – chastnaya narkologicheskaya klinika kamensk-ural’skij
Запой – критическая фаза зависимости, когда организм не может регулировать потребление алкоголя. Нарколог поможет провести детоксикацию и стабилизировать состояние в привычной обстановке, сохраняя конфиденциальность. Быстрое вмешательство при запое очень важно, чтобы избежать серьезных последствий для здоровья. Нарколог на дому поможет вывести токсины, восстановить водно-электролитный баланс и нормализовать работу органов. Вывод из запоя на дому включает медикаментозную терапию и психологическую поддержку для долгосрочной ремиссии. Сначала очищают организм от токсинов с помощью внутривенных инфузий и других современных препаратов.
Получить дополнительную информацию – вывод из запоя волгоград
Для успешного лечения зависимости необходима тщательная диагностика. В клинике проводят полное обследование пациента, включающее:
Подробнее тут – https://narkologicheskaya-klinika-v-murmanske12.ru/chastnaya-narkologicheskaya-klinika-v-murmanske/
Запой – потеря контроля над алкоголем и резкое отравление организма. Лечение на дому – это быстро, конфиденциально и с индивидуальным подходом. Экстренный вывод из запоя – это быстрая детоксикация и восстановление обмена веществ. Мы выезжаем круглосуточно, чтобы оперативно оценить состояние и начать лечение. На дому мы используем лекарства и психологическую поддержку для достижения максимального эффекта. Мы сначала очистим организм от алкоголя с помощью специальных лекарств.
Изучить вопрос глубже – вывод из запоя круглосуточно волгоград
Преимущества вызова нарколога на дом:
Ознакомиться с деталями – https://vyvod-iz-zapoya-v-murmanske12.ru/vyvod-iz-zapoya-na-domu-v-murmanske
Капельница от запоя в Мурманске является одной из наиболее востребованных процедур для снятия острого состояния алкогольной интоксикации. Эта методика позволяет быстро вывести токсины из организма, нормализовать водно-солевой баланс и улучшить самочувствие пациента. Современная капельная терапия считается эффективным средством в лечении запоя, обеспечивая поддержку жизненно важных функций и минимизируя риски осложнений.
Изучить вопрос глубже – http://kapelnicza-ot-zapoya-v-murmanske12.ru/
В таких случаях медлить нельзя — своевременный вызов нарколога может спасти жизнь и предотвратить тяжёлую инвалидизацию.
Подробнее можно узнать тут – http://
Компоненты
Подробнее можно узнать тут – капельница от запоя выезд в первоуральске
Лечение хронического алкоголизма начинается с купирования абстинентного синдрома, после чего проводятся мероприятия по нормализации работы печени, сердечно-сосудистой и нервной системы. Назначаются гепатопротекторы, ноотропы, витамины группы B. Также проводится противорецидивная терапия.
Ознакомиться с деталями – наркологическая клиника ярославская область
Мы предлагаем вам подробное руководство, основанное на проверенных источниках и реальных примерах. Каждая часть публикации направлена на то, чтобы помочь вам разобраться в сложных вопросах и применить знания на практике.
Лучшее решение — прямо здесь – https://evolve.pt/nail-care-in-winter-protecting-your-nails-from-the-cold
Эта статья предлагает живое освещение актуальной темы с множеством интересных фактов. Мы рассмотрим ключевые моменты, которые делают данную тему важной и актуальной. Подготовьтесь к насыщенному путешествию по неизвестным аспектам и узнайте больше о значимых событиях.
Получить полную информацию – https://f5fashion.vn/sakina-karchaoui-net-worth-in-2023-how-rich-is-she-now-update
Этот информационный материал собраны данные, которые помогут лучше понять текущие тенденции и процессы в различных сферах жизни. Мы предоставляем четкий анализ, графики и примеры, чтобы информация была не только понятной, но и практичной для принятия решений.
Расширить кругозор по теме – https://barijan.com/mag/oily-skin-routine
В наркологической клинике применяются проверенные методики терапии, включая медикаментозное лечение, детоксикацию и психотерапевтические программы. Детоксикация проводится с использованием современных капельниц, обеспечивающих безопасное выведение токсинов из организма. Важно отметить, что качественное лечение включает и работу с психологическими аспектами зависимости, что достигается посредством групповых и индивидуальных консультаций.
Получить больше информации – наркологическая клиника на дом
Мы предлагаем вам подробное руководство, основанное на проверенных источниках и реальных примерах. Каждая часть публикации направлена на то, чтобы помочь вам разобраться в сложных вопросах и применить знания на практике.
Обратиться к источнику – https://bthomerepair.com/product/reverse-osmosis-under-sink-compact-tankless-ro-water-filter-system-dual-filter-reduces-tds-600-gpd-4-stage-filtration-smart
Эта информационная заметка содержит увлекательные сведения, которые могут вас удивить! Мы собрали интересные факты, которые сделают вашу жизнь ярче и полнее. Узнайте нечто новое о привычных аспектах повседневности и откройте для себя удивительный мир информации.
Смотри, что ещё есть – https://www.osbornehotel-devon.co.uk/discover-ilfracombes-hidden-gems-a-guide-to-tunnels-beaches-and-beyond
Этот информативный текст выделяется своими захватывающими аспектами, которые делают сложные темы доступными и понятными. Мы стремимся предложить читателям глубину знаний вместе с разнообразием интересных фактов. Откройте новые горизонты и развивайте свои способности познавать мир!
Узнать напрямую – https://www.mhumphries.org/?psp_projects=youth-ministry
Первое, что необходимо уточнить перед вызовом — наличие у врача лицензии и профильного медицинского образования. Только сертифицированный нарколог может назначить препараты, поставить капельницу и провести детоксикацию без ущерба для здоровья пациента.
Выяснить больше – http://narkolog-na-dom-nizhnij-tagil11.ru/narkolog-na-dom-czeny-v-nizhnem-tagile/
Предлагаем вашему вниманию интересную справочную статью, в которой собраны ключевые моменты и нюансы по актуальным вопросам. Эта информация будет полезна как для профессионалов, так и для тех, кто только начинает изучать тему. Узнайте ответы на важные вопросы и расширьте свои знания!
Смотри, что ещё есть – https://www.piachoi.com/my-grannys-old-fashioned-biscuits
Эта информационная заметка содержит увлекательные сведения, которые могут вас удивить! Мы собрали интересные факты, которые сделают вашу жизнь ярче и полнее. Узнайте нечто новое о привычных аспектах повседневности и откройте для себя удивительный мир информации.
Изучить вопрос глубже – https://autosalesreviews.com/blog/car-dealership-employee-discount-guide
В этой информационной статье вы найдете интересное содержание, которое поможет вам расширить свои знания. Мы предлагаем увлекательный подход и уникальные взгляды на обсуждаемые темы, побуждая пользователей к активному мышлению и критическому анализу.
Детальнее – https://aemtk.ru/?paged=4&cat=1
В этой статье представлен занимательный и актуальный контент, который заставит вас задуматься. Мы обсуждаем насущные вопросы и проблемы, а также освещаем истории, которые вдохновляют на действия и изменения. Узнайте, что стоит за событиями нашего времени!
Обратитесь за информацией – https://100etiket2.ru/?paged=42
Алкогольная и наркотическая зависимости могут привести к тяжелым и опасным для жизни состояниям. Вызов нарколога становится необходимым, если:
Выяснить больше – нарколог на дом воронеж
В Химках решение есть — наркологическая клиника. Здесь помогают людям выйти из запоя без страха и осуждения. Всё анонимно, грамотно и с заботой о каждом пациенте.
Подробнее можно узнать тут – вывод из запоя капельница город химки
Когда запой превращается в острую угрозу здоровью, оперативное вмешательство становится необходимым условием для спасения жизни и предотвращения серьезных осложнений. В Уфе наркологи выезжают на дом для оказания качественной помощи при запое, предлагая детоксикацию, корректировку обменных процессов и психологическую поддержку. Такой формат лечения обеспечивает комфортную обстановку, индивидуальный подход и полную конфиденциальность для каждого пациента.
Ознакомиться с деталями – нарколог на дом уфа
При длительном запое токсические вещества накапливаются в организме, нарушая работу сердца, печени, почек и других жизненно важных систем. Своевременное вмешательство помогает предотвратить необратимые повреждения и снизить риск развития хронических заболеваний. В Уфе вызов нарколога на дом позволяет начать лечение в самые критические моменты, когда каждая минута имеет решающее значение для сохранения здоровья и жизни пациента.
Получить дополнительную информацию – вызов нарколога на дом уфа
Как поясняет медицинский психолог Елена Мусатова, «пациенту важно доверять специалисту, понимать его подход и чувствовать профессиональную уверенность ещё на этапе первичного осмотра».
Детальнее – https://narkologicheskaya-klinika-pervouralsk11.ru/chastnaya-narkologicheskaya-klinika-v-pervouralske/
После первичной диагностики начинается активная фаза медикаментозного вмешательства. Современные препараты вводятся капельничным методом, что позволяет оперативно снизить уровень токсинов в крови, восстановить нормальный обмен веществ и нормализовать работу внутренних органов, таких как печень, почки и сердце. Этот этап критически важен для стабилизации состояния пациента и предотвращения дальнейших осложнений.
Исследовать вопрос подробнее – вывод из запоя в туле
Клиника «УралМед» работает без выходных и праздников: прием пациентов — круглосуточно. Это позволяет оказывать экстренную помощь при острых состояниях, а также вести наблюдение за динамикой восстановления здоровья в ночные часы.
Исследовать вопрос подробнее – анонимное лечение алкоголизма в екатеринбурге
Процесс вывода из запоя на дому в Ярославле строится по четко отлаженной схеме, включающей несколько последовательных этапов, направленных на максимально быстрое и безопасное восстановление здоровья пациента.
Детальнее – vyvod-iz-zapoya-na-domu jaroslavl’
Автоматизированные системы дозирования обеспечивают точное введение лекарственных средств, что минимизирует риск передозировки и побочных эффектов. Постоянный мониторинг жизненных показателей позволяет оперативно корректировать терапию в режиме реального времени, обеспечивая максимальную безопасность процедуры.
Получить больше информации – narkolog na dom
Первичный этап заключается в оценке состояния пациента и быстром подборе схемы инфузионной терапии. Врач фиксирует показания ЭКГ, сатурацию кислорода и биохимический параметр глюкозы в крови. После этого подключается капельница с раствором для выведения продуктов распада алкоголя и одновременной коррекции показателей обмена веществ. Последующие визиты врача позволяют скорректировать терапию и предотвратить развитие побочных реакций.
Подробнее можно узнать тут – https://narkologicheskaya-pomoshh-ekaterinburg0.ru/skoraya-narkologicheskaya-pomoshh-v-ekb/
На основе полученных диагностических данных врач подбирает оптимальные препараты и дозировки, разрабатывая персональный план лечебных мероприятий.
Получить дополнительную информацию – http://
На втором этапе с пациентом работают психотерапевты, используя когнитивно-поведенческие и мотивационные техники. Основная задача — изменить стереотипы мышления и поведения, приводящие к употреблению веществ.
Получить дополнительную информацию – принудительное лечение наркомании
Близкий человек в запое? Не ждите ухудшения. Обратитесь в клинику — здесь проведут профессиональный вывод из запоя с последующим восстановлением организма.
Подробнее тут – http://vyvod-iz-zapoya-himki11.ru
Врач уточняет продолжительность запоя, характер употребляемого алкоголя и наличие сопутствующих заболеваний. Детальное обследование позволяет оперативно подобрать необходимые медикаменты и минимизировать риск осложнений.
Получить дополнительную информацию – капельница от запоя на дому в тюмени
Перед началом терапии врач проводит предварительный осмотр: измеряет давление, пульс, оценивает общее состояние пациента, наличие сопутствующих хронических заболеваний и признаков тяжёлой интоксикации. После этого разрабатывается индивидуальная схема лечения. В большинстве случаев она включает внутривенное введение растворов, улучшающих водно-солевой баланс, а также медикаментов, направленных на снятие абстиненции, нормализацию сна и снижение тревожности.
Углубиться в тему – vyvod-iz-zapoya-na-domu-cena
Использование автоматизированных систем дозирования позволяет точно подобрать необходимое количество медикаментов, минимизируя риск передозировки и побочных эффектов. Постоянный мониторинг жизненно важных показателей дает возможность врачу корректировать схему лечения в режиме реального времени, что повышает безопасность и эффективность процедуры.
Получить дополнительную информацию – vyvod-iz-zapoya-kruglosutochno jaroslavl’
Врач уточняет, как долго продолжается запой, какой алкоголь употребляется, а также наличие сопутствующих заболеваний. Этот тщательный анализ позволяет оперативно подобрать оптимальные методы детоксикации и снизить риск осложнений.
Исследовать вопрос подробнее – вывод из запоя капельница
Когда запой становится критическим, оперативное вмешательство имеет решающее значение для спасения здоровья и предотвращения необратимых последствий. Во Владимире экстренная помощь нарколога на дому позволяет быстро начать лечение, не требуя госпитализации, что особенно важно для пациентов, нуждающихся в сохранении конфиденциальности и комфорте.
Подробнее тут – вывод из запоя владимирская область
Многие думают, что запой — это просто привычка. На деле же это глубокий физиологический и психологический кризис. Он может привести к очень серьёзным осложнениям — от инфаркта до алкогольного делирия, сопровождающегося агрессией, страхами и бредовыми состояниями. Это не преувеличение. Алкоголь разрушает организм молча — и делает это быстрее, чем кажется.
Выяснить больше – https://vyvod-iz-zapoya-ehlektrostal3.ru/vyvod-iz-zapoya-na-domu-v-ehlektrostali
Самостоятельно выйти из запоя — почти невозможно. В Химках врачи клиники проводят медикаментозный вывод из запоя с круглосуточным выездом. Доверяйте профессионалам.
Разобраться лучше – наркология вывод из запоя в химках
Самостоятельно выйти из запоя — почти невозможно. В Химках врачи клиники проводят медикаментозный вывод из запоя с круглосуточным выездом. Доверяйте профессионалам.
Подробнее можно узнать тут – вывод из запоя капельница
Алкогольная интоксикация и запой могут стремительно ухудшить состояние здоровья, став угрозой жизни, поэтому оперативное вмешательство имеет первостепенное значение. В Туле квалифицированные наркологи предоставляют круглосуточную помощь на дому, что позволяет начать лечение незамедлительно и в комфортных условиях. Такой формат терапии гарантирует индивидуальный подход, всестороннюю поддержку и полную конфиденциальность, что особенно важно для пациентов, стремящихся восстановить своё здоровье без лишних стрессовых ситуаций.
Подробнее – vyvod-iz-zapoya-klinika tula
Пациенты клиники «НаркоМед» полностью застрахованы от утечки личной информации. Приём и лечение оформляются по псевдониму, документы не передаются в другие организации.
Изучить вопрос глубже – http://narkologicheskaya-klinika-ekaterinburg0.ru
На данном этапе специалист уточняет, как долго продолжается запой, какой вид алкоголя употребляется и имеются ли сопутствующие заболевания. Тщательный анализ информации позволяет оперативно определить степень интоксикации и выбрать оптимальные методы терапии для быстрого и безопасного вывода из запоя.
Исследовать вопрос подробнее – вывод из запоя тула.
Алкоголизм — хроническое заболевание, требующее комплексного подхода и круглосуточного контроля. Клиника «УралМед» в Екатеринбурге предлагает полный спектр услуг для пациентов любого уровня зависимости: от экстренной детоксикации до долгосрочной реабилитации. Главные принципы работы — абсолютная анонимность, индивидуальный план лечения и постоянное сопровождение квалифицированной командой специалистов.
Выяснить больше – лечение алкоголизма екатеринбург.
Запой характеризуется накоплением токсинов и ухудшением работы внутренних органов. Чем дольше продолжается состояние интоксикации, тем выше риск серьезных осложнений. Помощь нарколога на дому позволяет начать детоксикацию в первые часы кризиса, что существенно повышает шансы на успешное восстановление и предотвращает развитие хронических заболеваний.
Получить дополнительную информацию – вывод из запоя владимир
Когда запой угрожает здоровью, каждая минута имеет решающее значение. В Ярославле квалифицированные специалисты по наркологии оказывают помощь на дому, позволяя оперативно начать лечение алкогольной интоксикации и вывести токсины из организма. Такой формат терапии обеспечивает комфортные условия для пациента, максимальную конфиденциальность и индивидуальный подход, что особенно важно для быстрого и безопасного восстановления здоровья.
Ознакомиться с деталями – vyvod-iz-zapoya jaroslavl’
Медицинский вывод из запоя включает несколько обязательных этапов:
Получить дополнительную информацию – http://vyvod-iz-zapoya-kolomna3.ru/anonimnyj-vyvod-iz-zapoya-v-kolomne/
Когда запой превращается в угрозу для жизни, оперативное вмешательство становится критически важным. В Тюмени, Тюменская область, опытные наркологи предлагают услугу установки капельницы от запоя прямо на дому. Такой метод позволяет начать детоксикацию с использованием современных медикаментов, что способствует быстрому выведению токсинов, восстановлению обменных процессов и нормализации работы внутренних органов. Лечение на дому обеспечивает комфортную обстановку, полную конфиденциальность и индивидуальный подход к каждому пациенту.
Изучить вопрос глубже – https://kapelnica-ot-zapoya-tyumen00.ru/postavit-kapelniczu-ot-zapoya-tyumen
Процесс вывода из запоя капельничным методом организован по строгой схеме, позволяющей обеспечить максимальную эффективность терапии. Каждая стадия направлена на комплексное восстановление организма и минимизацию риска осложнений.
Подробнее – https://kapelnica-ot-zapoya-tyumen0.ru/kapelnicza-ot-zapoya-na-domu-czena-tyumen
Затяжной запой опасен для жизни. Врачи наркологической клиники в Химках проводят срочный вывод из запоя — на дому или в стационаре. Анонимно, безопасно, круглосуточно.
Подробнее тут – вывод из запоя на дому в химках
Алкогольная зависимость — это хроническое заболевание, которое со временем разрушает здоровье, отношения, профессиональную сферу и личную идентичность человека. Многие сталкиваются с этим не сразу: поначалу кажется, что всё под контролем, но с каждым срывом становится всё труднее остановиться. Постепенно алкоголь перестаёт быть выбором и превращается в навязчивую необходимость.
Разобраться лучше – http://kodirovanie-ot-alkogolizma-shchelkovo3.ru
Обращение за помощью на дому имеет ряд неоспоримых преимуществ, особенно для тех, кто ценит конфиденциальность и стремится избежать дополнительных стрессовых факторов, связанных с посещением клиники:
Исследовать вопрос подробнее – https://narcolog-na-dom-ufa00.ru/narkolog-na-dom-kruglosutochno-ufa
Служба выездных бригад работает круглосуточно и готова выехать по любому адресу в черте города и ближайших пригородах. Врач прибывает полностью оснащённым — с набором препаратов для восстановления водно-электролитного баланса, коррекции артериального давления и поддержки функций печени. Первая помощь включает введение детоксикационных растворов, средств для нормализации работы сердечно-сосудистой системы и купирования абстинентного синдрома.
Узнать больше – narkologicheskaya-pomoshh-ekaterinburg0.ru/
После вашего звонка нарколог выезжает на дом в течение 30–60 минут. Прибыв на место, специалист проводит всесторонний медицинский осмотр, включая измерение артериального давления, пульса и уровня кислорода в крови, а также собирает анамнез для определения степени интоксикации.
Ознакомиться с деталями – http://narcolog-na-dom-voronezh0.ru/
В клинике используются запатентованные наборы для капельниц, включающие витамины группы B, мембранопротекторы и низкомолекулярные антиоксиданты. Автоматизированные насосы обеспечивают равномерный ввод растворов, минимизируя риск осложнений.
Получить дополнительные сведения – лечение наркомании и алкоголизма екатеринбург.
Услуга
Выяснить больше – нарколог на дом срочно раменское
Услуга вызова нарколога на дом в Уфе разработана для оперативного вывода из запоя без необходимости госпитализации. Это особенно актуально для тех, кто столкнулся с алкогольной интоксикацией в условиях, когда каждая минута имеет значение. Своевременная помощь позволяет не только устранить негативное воздействие алкоголя на организм, но и предотвратить возможные осложнения, такие как нарушения работы сердца, печени и почек.
Углубиться в тему – https://narcolog-na-dom-ufa0.ru/narkolog-na-dom-czena-ufa
Когда запой становится критическим, оперативное вмешательство имеет решающее значение для спасения здоровья и предотвращения необратимых последствий. Во Владимире экстренная помощь нарколога на дому позволяет быстро начать лечение, не требуя госпитализации, что особенно важно для пациентов, нуждающихся в сохранении конфиденциальности и комфорте.
Подробнее – вывод. из. запоя. владимир.
Перед началом терапии врач проводит предварительный осмотр: измеряет давление, пульс, оценивает общее состояние пациента, наличие сопутствующих хронических заболеваний и признаков тяжёлой интоксикации. После этого разрабатывается индивидуальная схема лечения. В большинстве случаев она включает внутривенное введение растворов, улучшающих водно-солевой баланс, а также медикаментов, направленных на снятие абстиненции, нормализацию сна и снижение тревожности.
Выяснить больше – http://vyvod-iz-zapoya-domodedovo3.ru
После первичной диагностики начинается активная фаза медикаментозного вмешательства. Современные препараты вводятся капельничным методом, что позволяет оперативно снизить уровень токсинов в крови, восстановить нормальный обмен веществ и нормализовать работу внутренних органов, таких как печень, почки и сердце. Этот этап критически важен для стабилизации состояния пациента и предотвращения дальнейших осложнений.
Получить больше информации – вывод из запоя клиника в туле
Самостоятельно выйти из запоя — почти невозможно. В Химках врачи клиники проводят медикаментозный вывод из запоя с круглосуточным выездом. Доверяйте профессионалам.
Исследовать вопрос подробнее – narkolog-vyvod-iz-zapoya himki
Услуга “Нарколог на дом” в Уфе охватывает широкий спектр лечебных мероприятий, направленных как на устранение токсической нагрузки, так и на работу с психоэмоциональным состоянием пациента. Комплексная терапия включает в себя медикаментозную детоксикацию, корректировку обменных процессов, а также психотерапевтическую поддержку, что позволяет не только вывести пациента из состояния запоя, но и помочь ему справиться с наркотической зависимостью.
Углубиться в тему – http://narcolog-na-dom-ufa000.ru
Путь к свободе от зависимости начинается не с обещаний «просто перестать», а с профессионального медицинского вмешательства. В «Чистом Дыхании» мы применяем проверенные методы, которые работают там, где сила воли без нужной поддержки оказывается бессильной. Наша клиника в Долгопрудном работает круглосуточно — чтобы помощь была доступна в самый критический момент, когда человек ощущает острую потребность в детоксикации, снятии абстинентного синдрома или психологической поддержке.
Углубиться в тему – https://narkologicheskaya-klinika-dolgoprudnyj3.ru/chastnaya-narkologicheskaya-klinika-v-dolgoprudnom/
Клиника «УралМед» работает без выходных и праздников: прием пациентов — круглосуточно. Это позволяет оказывать экстренную помощь при острых состояниях, а также вести наблюдение за динамикой восстановления здоровья в ночные часы.
Подробнее – лечение наркомании и алкоголизма
– затяжной запой более 5–7 дней; – наличие галлюцинаций, судорог, бредовых состояний; – тяжёлое общее состояние (высокая температура, спутанность сознания, обезвоживание); – хронические болезни в стадии обострения.
Подробнее можно узнать тут – быстрый вывод из запоя
При длительном запое в организме накапливаются вредные токсины, что ведёт к нарушениям работы сердца, печени, почек и других жизненно важных органов. Чем быстрее начинается терапия, тем выше шансы избежать серьёзных осложнений и обеспечить качественное восстановление. Метод капельничного лечения позволяет оперативно начать детоксикацию, что особенно важно для спасения жизни и предупреждения хронических последствий злоупотребления алкоголем.
Узнать больше – капельницы от запоя в тюмени
Обращение за помощью нарколога на дому имеет ряд преимуществ, способствующих быстрому и эффективному лечению:
Узнать больше – срочный вывод из запоя ярославль
Затяжной запой опасен для жизни. Врачи наркологической клиники в Химках проводят срочный вывод из запоя — на дому или в стационаре. Анонимно, безопасно, круглосуточно.
Углубиться в тему – вывод из запоя на дому цена город химки
Когда запой начинает угрожать здоровью, оперативное вмешательство становится жизненно необходимым. В Туле опытные специалисты оказывают помощь на дому, позволяя начать лечение сразу же в комфортной обстановке. Такой формат терапии обеспечивает оперативную детоксикацию, восстановление нормального обмена веществ и стабилизацию работы внутренних органов, что особенно важно для пациентов, желающих избежать лишнего стресса и сохранить конфиденциальность.
Изучить вопрос глубже – http://vyvod-iz-zapoya-tula0.ru
Многие думают, что запой — это просто привычка. На деле же это глубокий физиологический и психологический кризис. Он может привести к очень серьёзным осложнениям — от инфаркта до алкогольного делирия, сопровождающегося агрессией, страхами и бредовыми состояниями. Это не преувеличение. Алкоголь разрушает организм молча — и делает это быстрее, чем кажется.
Разобраться лучше – экстренный вывод из запоя
В Химках решение есть — наркологическая клиника. Здесь помогают людям выйти из запоя без страха и осуждения. Всё анонимно, грамотно и с заботой о каждом пациенте.
Выяснить больше – вывод из запоя цена московская область
Пациенты клиники «НаркоМед» полностью застрахованы от утечки личной информации. Приём и лечение оформляются по псевдониму, документы не передаются в другие организации.
Получить дополнительную информацию – https://narkologicheskaya-klinika-ekaterinburg0.ru
Сразу после поступления вызова нарколог прибывает на дом для проведения детального первичного осмотра. Врач собирает краткий анамнез, измеряет жизненно важные показатели, такие как пульс, артериальное давление и температура, и оценивает степень интоксикации. Эта информация является фундаментом для разработки индивидуального плана терапии, который учитывает особенности состояния пациента.
Получить больше информации – вывод из запоя анонимно в туле
Нарколог устанавливает внутривенную капельницу, через которую вводятся растворы, обеспечивающие быстрое выведение токсинов, восстановление водно-электролитного баланса и стабилизацию состояния.
Получить больше информации – https://narcolog-na-dom-voronezh00.ru/zapoj-narkolog-na-dom-voronezh/
Специалист выясняет, как долго продолжается запой, какие симптомы наблюдаются, а также наличие сопутствующих заболеваний. Эти данные позволяют сформировать индивидуальный план лечения и выбрать оптимальные методы детоксикации.
Получить больше информации – вывод из запоя цены владимир
Каждый день запоя увеличивает риск для жизни. Не рискуйте — специалисты в Химках приедут на дом и окажут экстренную помощь. Без боли, стресса и ожидания.
Выяснить больше – вывод из запоя в химках
При длительном запое токсические вещества накапливаются в организме, нарушая работу сердца, печени, почек и других жизненно важных систем. Своевременное вмешательство помогает предотвратить необратимые повреждения и снизить риск развития хронических заболеваний. В Уфе вызов нарколога на дом позволяет начать лечение в самые критические моменты, когда каждая минута имеет решающее значение для сохранения здоровья и жизни пациента.
Получить больше информации – narkolog na dom
Многие пациенты, обращаясь за помощью, уже имеют опыт самостоятельных попыток прекратить употребление, возможно — неоднократный вывод из запоя или даже амбулаторное лечение. Однако без поддержки со стороны специалистов и внутреннего «якоря» сохранить трезвость удаётся редко. Кодирование как раз и становится этим «якорем» — формирует в человеке стойкое отрицание алкоголя, как на физиологическом, так и на психологическом уровне.
Подробнее тут – http://kodirovanie-ot-alkogolizma-shchelkovo3.ru/kodirovanie-ot-alkogolizma-na-domu-v-shchelkovo/https://kodirovanie-ot-alkogolizma-shchelkovo3.ru
Первичный этап заключается в оценке состояния пациента и быстром подборе схемы инфузионной терапии. Врач фиксирует показания ЭКГ, сатурацию кислорода и биохимический параметр глюкозы в крови. После этого подключается капельница с раствором для выведения продуктов распада алкоголя и одновременной коррекции показателей обмена веществ. Последующие визиты врача позволяют скорректировать терапию и предотвратить развитие побочных реакций.
Детальнее – анонимная наркологическая помощь в екатеринбурге
Вывод из запоя — это не просто капельница, а многоуровневая медицинская процедура, направленная на устранение интоксикации, стабилизацию состояния пациента и предотвращение осложнений. В клинике «Жизненный Луч» мы проводим эту процедуру в домашних условиях и в стационаре, в зависимости от тяжести состояния. К каждому пациенту применяем индивидуальный подход, исходя из возраста, сопутствующих заболеваний и длительности запоя.
Изучить вопрос глубже – вывод из алкогольного запоя
После первичной диагностики начинается активная фаза медикаментозного вмешательства. Современные препараты вводятся капельничным методом, что позволяет оперативно снизить уровень токсинов в крови, восстановить нормальный обмен веществ и нормализовать работу внутренних органов, таких как печень, почки и сердце. Этот этап критически важен для стабилизации состояния пациента и предотвращения дальнейших осложнений.
Подробнее тут – http://vyvod-iz-zapoya-tula00.ru/
В случаях, когда транспортировка в клинику затруднительна или пациент испытывает выраженный стресс, возможно выездное консультирование и начальная детоксикация на дому. Врач прибывает с портативным набором для инфузий, оперативно stabilizирует состояние и даёт рекомендации по дальнейшим действиям.
Подробнее тут – https://lechenie-alkogolizma-ekaterinburg0.ru/lechenie-khronicheskogo-alkogolizma-v-ekb
Услуга вывода из запоя на дому в Ярославле включает комплекс мер, направленных на оперативную детоксикацию организма и стабилизацию жизненно важных функций. При поступлении вызова нарколог приезжает на дом, проводит первичный осмотр, собирает анамнез и определяет степень алкогольной интоксикации. На основе полученных данных формируется индивидуальный план терапии, который может включать капельничное введение медикаментов, коррекцию обмена веществ и психологическую поддержку.
Получить больше информации – http://vyvod-iz-zapoya-yaroslavl00.ru/vyvod-iz-zapoya-czena-yaroslavl/
Путь к свободе от зависимости начинается не с обещаний «просто перестать», а с профессионального медицинского вмешательства. В «Чистом Дыхании» мы применяем проверенные методы, которые работают там, где сила воли без нужной поддержки оказывается бессильной. Наша клиника в Долгопрудном работает круглосуточно — чтобы помощь была доступна в самый критический момент, когда человек ощущает острую потребность в детоксикации, снятии абстинентного синдрома или психологической поддержке.
Получить дополнительные сведения – http://narkologicheskaya-klinika-dolgoprudnyj3.ru
При поступлении вызова нарколог незамедлительно приезжает на дом для проведения тщательного осмотра. На этом этапе специалист измеряет жизненно важные показатели, собирает подробный анамнез и определяет степень интоксикации. Эти данные являются ключевыми для составления индивидуального плана лечения.
Углубиться в тему – https://kapelnica-ot-zapoya-tyumen00.ru/kapelnicza-ot-zapoya-na-domu-tyumen
Самостоятельно выйти из запоя — почти невозможно. В Химках врачи клиники проводят медикаментозный вывод из запоя с круглосуточным выездом. Доверяйте профессионалам.
Углубиться в тему – вывод из запоя капельница город химки
В зависимости от степени выраженности абстинентного синдрома и наличия сопутствующих осложнений клиника «Азимут Здоровья» предлагает два основных формата оказания помощи, позволяющих оптимально сочетать эффективность лечения и комфорт пациента. Каждый вариант тщательно продуман: мы учитываем не только медицинские показания, но и личные предпочтения, чтобы вы или ваш близкий чувствовали себя максимально защищённо и спокойно. Оба формата подразумевают строгий контроль жизненных показателей и сопровождение на всех этапах — от первой капельницы до завершения курса поддерживающей терапии.
Детальнее – нарколог на дом круглосуточно раменское
В клинике используются запатентованные наборы для капельниц, включающие витамины группы B, мембранопротекторы и низкомолекулярные антиоксиданты. Автоматизированные насосы обеспечивают равномерный ввод растворов, минимизируя риск осложнений.
Узнать больше – http://lechenie-narkomanii-ekaterinburg0.ru
Врач уточняет, как долго продолжается запой, какой алкоголь употребляется, а также наличие сопутствующих заболеваний. Этот тщательный анализ позволяет оперативно подобрать оптимальные методы детоксикации и снизить риск осложнений.
Получить больше информации – вывод из запоя цена тульская область
Использование автоматизированных систем дозирования обеспечивает точное введение лекарственных средств, что минимизирует риск передозировки и побочных эффектов. Постоянный мониторинг жизненно важных показателей позволяет врачу оперативно корректировать дозировки и адаптировать терапию под динамику состояния пациента.
Детальнее – http://vyvod-iz-zapoya-vladimir000.ru
Каждый день запоя увеличивает риск для жизни. Не рискуйте — специалисты в Химках приедут на дом и окажут экстренную помощь. Без боли, стресса и ожидания.
Детальнее – вывод из запоя круглосуточно город химки
Клиника «НаркоМед» в Екатеринбурге предоставляет полный спектр наркологической помощи круглосуточно и анонимно. Благодаря мобильным бригадам и выездам на дом, пациенты получают профессиональное лечение прямо в комфортной обстановке, без стресса, связанного с госпитализацией. В статье подробно рассматриваются услуги клиники, этапы терапии и ключевые преимущества обращения в «НаркоМед».
Узнать больше – бесплатная наркологическая клиника екатеринбург
Алкогольная и наркотическая зависимости могут привести к тяжелым и опасным для жизни состояниям. Вызов нарколога становится необходимым, если:
Ознакомиться с деталями – https://narcolog-na-dom-voronezh0.ru/vyzov-narkologa-na-dom-voronezh
Близкий человек в запое? Не ждите ухудшения. Обратитесь в клинику — здесь проведут профессиональный вывод из запоя с последующим восстановлением организма.
Исследовать вопрос подробнее – вывод из запоя цена в химках
Системы автоматизированного дозирования обеспечивают точное введение медикаментов, что минимизирует риск побочных эффектов. Постоянный мониторинг жизненно важных показателей позволяет врачу корректировать терапию в режиме реального времени, гарантируя безопасность процедуры.
Ознакомиться с деталями – вывод из запоя круглосуточно владимир
При длительном запое токсические вещества накапливаются в организме, нарушая работу сердца, печени, почек и других жизненно важных систем. Своевременное вмешательство помогает предотвратить необратимые повреждения и снизить риск развития хронических заболеваний. В Уфе вызов нарколога на дом позволяет начать лечение в самые критические моменты, когда каждая минута имеет решающее значение для сохранения здоровья и жизни пациента.
Выяснить больше – вызов нарколога на дом уфа
Перед началом терапии врач проводит предварительный осмотр: измеряет давление, пульс, оценивает общее состояние пациента, наличие сопутствующих хронических заболеваний и признаков тяжёлой интоксикации. После этого разрабатывается индивидуальная схема лечения. В большинстве случаев она включает внутривенное введение растворов, улучшающих водно-солевой баланс, а также медикаментов, направленных на снятие абстиненции, нормализацию сна и снижение тревожности.
Узнать больше – http://vyvod-iz-zapoya-domodedovo3.ru
Доступность услуги и оперативность реагирования гарантируют, что помощь будет оказана в течение 30–60 минут после вызова. Это позволяет не только быстро начать детоксикацию, но и минимизировать риск развития осложнений, таких как повреждение печени, почек и сердечно-сосудистой системы.
Подробнее можно узнать тут – vyvod-iz-zapoya-kruglosutochno tula
Запой — это не просто бытовое пьянство, а одно из наиболее опасных проявлений алкогольной зависимости. Во время запоя организм перестаёт функционировать в нормальном режиме: сердечно-сосудистая система работает на износ, нервная система перегружена токсинами, а печень не справляется с нагрузкой. На этом фоне могут возникать тяжёлые осложнения — от судорог и гипогликемии до нарушения дыхания и алкогольного психоза. Чем дольше длится запой, тем глубже метаболические нарушения и выше риск серьёзных последствий.
Получить больше информации – http://vyvod-iz-zapoya-kolomna3.ru/vyvod-iz-zapoya-stacionar-v-kolomne/https://vyvod-iz-zapoya-kolomna3.ru
Когда запой превращается в угрозу для жизни, оперативное вмешательство становится критически важным. В Тюмени, Тюменская область, опытные наркологи предлагают услугу установки капельницы от запоя прямо на дому. Такой метод позволяет начать детоксикацию с использованием современных медикаментов, что способствует быстрому выведению токсинов, восстановлению обменных процессов и нормализации работы внутренних органов. Лечение на дому обеспечивает комфортную обстановку, полную конфиденциальность и индивидуальный подход к каждому пациенту.
Узнать больше – https://kapelnica-ot-zapoya-tyumen00.ru/kapelnicza-ot-zapoya-na-domu-tyumen
На данном этапе специалист уточняет, как долго продолжается запой, какой вид алкоголя употребляется и имеются ли сопутствующие заболевания. Тщательный анализ информации позволяет оперативно определить степень интоксикации и выбрать оптимальные методы терапии для быстрого и безопасного вывода из запоя.
Изучить вопрос глубже – вывод из запоя
В «Трезвом Истоке» мы понимаем: принять решение о вызове — это шаг, требующий смелости. Особенно если речь идёт о близком человеке, который отрицает наличие проблемы. Именно поэтому наши врачи умеют работать тактично, без давления. Мы не заставляем — мы объясняем. Спокойно, профессионально и по-человечески.
Подробнее можно узнать тут – http://
Сразу после вызова нарколог прибывает на дом для проведения тщательного первичного осмотра. На этом этапе специалист собирает краткий анамнез, измеряет жизненно важные показатели – пульс, артериальное давление, температуру – и оценивает степень алкогольной интоксикации. Полученные данные служат основой для составления индивидуального плана лечения, позволяющего подобрать оптимальные методы детоксикации.
Узнать больше – вывод из запоя недорого ярославль
В случаях, когда транспортировка в клинику затруднительна или пациент испытывает выраженный стресс, возможно выездное консультирование и начальная детоксикация на дому. Врач прибывает с портативным набором для инфузий, оперативно stabilizирует состояние и даёт рекомендации по дальнейшим действиям.
Подробнее – https://lechenie-alkogolizma-ekaterinburg0.ru/anonimnoe-lechenie-alkogolizma-v-ekb
Этот текст призван помочь читателю расширить кругозор и получить практические знания. Мы используем простой язык, наглядные примеры и структурированное изложение, чтобы сделать обучение максимально эффективным и увлекательным.
Изучить вопрос глубже – https://www.medallasramirez.cl/articulos-de-regalo
Публикация приглашает вас исследовать неизведанное — от древних тайн до современных достижений науки. Вы узнаете, как случайные находки превращались в революции, а смелые мысли — в новые эры человеческого прогресса.
Ознакомьтесь с аналитикой – https://risenshinedriving.com/index.php/testimonial/i-highly-recommend-rise-n
Эффективная капельница должна включать несколько компонентов, каждый из которых направлен на решение конкретной задачи: выведение токсинов, восстановление функций организма, нормализация психоэмоционального состояния.
Углубиться в тему – капельница от запоя на дому
Этот увлекательный информационный материал подарит вам массу новых знаний и ярких эмоций. Мы собрали для вас интересные факты и сведения, которые обогатят ваш опыт. Откройте для себя увлекательный мир информации и насладитесь процессом изучения!
Переходите по ссылке ниже – https://advance-in-cambodia.com/?p=949
В этой статье собраны факты, которые освещают целый ряд важных вопросов. Мы стремимся предложить читателям четкую, достоверную информацию, которая поможет сформировать собственное мнение и лучше понять сложные аспекты рассматриваемой темы.
Ссылка на источник – https://bestpointonline.com/portfolio/data-analysis
Этот информативный текст отличается привлекательным содержанием и актуальными данными. Мы предлагаем читателям взглянуть на привычные вещи под новым углом, предоставляя интересный и доступный материал. Получите удовольствие от чтения и расширьте кругозор!
Практические советы ждут тебя – http://sarakaradakhi.com/2022/03/31/i-need-more-growth-and-healing
Услуга
Подробнее тут – частная наркологическая клиника в рязани
Эта информационная заметка содержит увлекательные сведения, которые могут вас удивить! Мы собрали интересные факты, которые сделают вашу жизнь ярче и полнее. Узнайте нечто новое о привычных аспектах повседневности и откройте для себя удивительный мир информации.
Это ещё не всё… – http://smiledesigncenter.ir/blog/?p=108
Эта статья для ознакомления предлагает читателям общее представление об актуальной теме. Мы стремимся представить ключевые факты и идеи, которые помогут читателям получить представление о предмете и решить, стоит ли углубляться в изучение.
Только для своих – https://prime-renovationglobale.fr/bonjour-tout-le-monde
Мы предлагаем вам подробное руководство, основанное на проверенных источниках и реальных примерах. Каждая часть публикации направлена на то, чтобы помочь вам разобраться в сложных вопросах и применить знания на практике.
Почему это важно? – https://e-veiculos.pt/product/winter-jacket
В этой информационной статье вы найдете интересное содержание, которое поможет вам расширить свои знания. Мы предлагаем увлекательный подход и уникальные взгляды на обсуждаемые темы, побуждая пользователей к активному мышлению и критическому анализу.
Получить полную информацию – https://all4holidays.ru/?paged=38&cat=1
Эта информационная заметка содержит увлекательные сведения, которые могут вас удивить! Мы собрали интересные факты, которые сделают вашу жизнь ярче и полнее. Узнайте нечто новое о привычных аспектах повседневности и откройте для себя удивительный мир информации.
Ссылка на источник – https://f5fashion.vn/thien-binh-hay-thay-doi-neu-khong-muon-fa
Этот информативный текст выделяется своими захватывающими аспектами, которые делают сложные темы доступными и понятными. Мы стремимся предложить читателям глубину знаний вместе с разнообразием интересных фактов. Откройте новые горизонты и развивайте свои способности познавать мир!
Обратиться к источнику – http://5kmotors.com/category/sport-cars
В этой статье представлен занимательный и актуальный контент, который заставит вас задуматься. Мы обсуждаем насущные вопросы и проблемы, а также освещаем истории, которые вдохновляют на действия и изменения. Узнайте, что стоит за событиями нашего времени!
Изучить вопрос глубже – https://liver.works/asency/3582/%E3%80%90tiktok-live%E3%80%91%E3%82%B9%E3%83%86%E3%83%83%E3%83%97%E3%82%A2%E3%83%83%E3%83%97%E3%82%AD%E3%83%A3%E3%83%B3%E3%83%9A%E3%83%BC%E3%83%B3%E2%98%80%EF%B8%8F%F0%9F%8C%88
Эта информационная заметка содержит увлекательные сведения, которые могут вас удивить! Мы собрали интересные факты, которые сделают вашу жизнь ярче и полнее. Узнайте нечто новое о привычных аспектах повседневности и откройте для себя удивительный мир информации.
Более подробно об этом – https://all-hit.ru/?paged=4
Клиника располагается в зелёной зоне на окраине города, что обеспечивает тишину и возможность уединённого выздоровления. Интерьеры помещений спроектированы с учётом принципов эргономики и психотерапевтического комфорта: мягкое освещение, натуральные материалы, удобная мебель. Все сотрудники прошли специальную подготовку по работе с зависимыми пациентами и знают, как создать доверительную атмосферу с первого визита.
Детальнее – lechenie narkomanii i alkogolizma arhangel’sk
Когда организм на пределе, важна срочная помощь в Химках — это команда опытных наркологов, которые помогут быстро и мягко выйти из запоя без вреда для здоровья.
Выяснить больше – вывод из запоя на дому круглосуточно город химки
Таблица: Основные признаки надёжного центра лечения наркомании
Выяснить больше – лечение наркомании наркология
Как подчёркивает специалист ФГБУ «НМИЦ психиатрии и наркологии», «без участия квалифицированной команды невозможно обеспечить комплексный подход к пациенту, особенно если речь идёт о длительном стаже употребления и осложнённой картине заболевания». Отсюда следует — изучение состава персонала должно быть одним из первых шагов.
Выяснить больше – lechenie alkogolizma murmansk
Дополнительно выясняются аллергические реакции, приём других препаратов и предпочтения пациента по времени визита врача.
Получить дополнительную информацию – капельница от запоя на дому воронеж.
Как отмечает руководитель клинико-диагностического отдела ФГБУ «Национальный центр наркологии», «участие в терапии нескольких специалистов разных направлений позволяет учитывать не только симптомы, но и глубинные причины зависимости». Именно такой подход снижает риск рецидивов и повышает эффективность лечения.
Разобраться лучше – частная наркологическая клиника ярославская область
В этом материале мы разберём 7 основ лечения алкоголизма и расскажем, как в Ярославле получить помощь, соответствующую современным стандартам терапии.
Углубиться в тему – http://lechenie-alkogolizma-yaroslavl0.ru
На первом этапе пациент проходит лабораторные обследования (общий и биохимический анализ крови, ЭКГ, УЗИ печени и почек). На их основе разрабатывается схема инфузионной терапии, включающая корректировку водно-электролитного баланса, поддержку жизненно важных функций и назначение симптоматических препаратов для снятия абстинентного синдрома.
Получить больше информации – http://lechenie-narkomanii-arkhangelsk0.ru/lechenie-narkomanii-anonimno-arkhangelsk
Запой – это опасная стадия! В Волгоградской области нарколог поможет круглосуточно! Мы всегда на связи, чтобы помочь вам справиться с запоем. Мы предлагаем быстрое, безопасное и индивидуальное лечение. Наша служба вывода из запоя работает четко и без сбоев. Мы предлагаем детоксикацию и стабилизацию состояния в любом месте. Мы начинаем с диагностики, чтобы понять, как лучше вам помочь.
Ознакомиться с деталями – https://vyvod-iz-zapoya-volgograd000.ru/vyvod-iz-zapoya-kruglosutochno-volgograd
При запое организм теряет контроль над употреблением алкоголя. В Волгограде вызов нарколога на дом поможет быстро стабилизировать состояние. На дому можно получить квалифицированную помощь, провести детоксикацию и сохранить анонимность. Не затягивайте с вызовом нарколога, чтобы избежать необратимых последствий для организма. Вывод токсинов, восстановление баланса и нормализация работы организма – задачи нарколога на дому. Медикаменты и психология – основа лечения запоя на дому. Детоксикация – первый этап лечения, который проводится с помощью современных препаратов.
Ознакомиться с деталями – вывод из запоя круглосуточно волгоград
Выбор наркологической клиники — ответственное решение, от которого зависит не только эффективность терапии, но и общее физическое и психоэмоциональное состояние пациента. Квалифицированная помощь должна быть своевременной, организованной и соответствующей медицинским стандартам. Как указывает Минздрав РФ, медицинские учреждения, предоставляющие помощь при зависимостях, обязаны иметь лицензию, профессиональный персонал и комплексный подход к лечению.
Получить больше информации – http://narkologicheskaya-klinika-murmansk0.ru
При длительном запое в крови накапливаются ацетальдегид и другие токсичные метаболиты этанола, которые повреждают клетки печени, нарушают функцию почек и приводят к дисбалансу электролитов. Без своевременной детоксикации повышается риск острых состояний — судорог, инсультов, инфаркта, панкреатита и психоза. Чем раньше начато лечение, тем быстрее нормализуются показатели обмена веществ, возвращается водно-электролитный баланс и восстанавливается работа жизненно важных органов. Анонимный выезд нарколога помогает снять психологический барьер перед обращением за помощью.
Получить больше информации – https://kapelnica-ot-zapoya-voronezh.ru/kapelnicza-ot-zapoya-na-domu-v-voronezhe/
Вызов врача-нарколога на дом актуален в ситуациях, когда пациенту требуется срочная медицинская помощь, но его состояние не позволяет самостоятельно обратиться в клинику. Основными причинами вызова нарколога на дом являются:
Получить больше информации – https://narcolog-na-dom-sankt-peterburg00.ru/narkolog-na-dom-czena-spb/
Затяжной запой опасен для жизни. Врачи наркологической клиники в Химках проводят срочный вывод из запоя — на дому или в стационаре. Анонимно, безопасно, круглосуточно.
Детальнее – срочный вывод из запоя в химках
Критерий
Выяснить больше – https://narkologicheskaya-pomoshh-arkhangelsk0.ru/anonimnaya-narkologicheskaya-pomoshh-arkhangelsk
В «Пульсар-Мед» с пониманием относятся к каждому обратившемуся: здесь нет осуждения и формального отношения. Врач-нарколог ведёт пациента на всём пути, а команда психологов и социальных работников обеспечивает поддержку на каждом этапе. Мы предлагаем анонимное лечение — ваши данные не попадут к третьим лицам, а обращение в клинику не фиксируется в государственных реестрах.
Подробнее тут – лечение алкоголизма стоимость
После успешной детоксикации начинается этап реабилитации, который включает восстановление социального статуса пациента и формирование новых здоровых привычек. Мы предлагаем как групповые, так и индивидуальные занятия, направленные на изменение поведения и мышления, что способствует долгосрочному удержанию пациента от возвращения к зависимостям.
Подробнее можно узнать тут – капельница от запоя наркология
Когда организм на пределе, важна срочная помощь в Химках — это команда опытных наркологов, которые помогут быстро и мягко выйти из запоя без вреда для здоровья.
Подробнее тут – нарколог вывод из запоя город химки
В нашей клинике “Сила воли” в Иркутске вы можете получить помощь как в стационаре, так и на дому. Мы предлагаем два вида услуг:
Получить больше информации – kapelnicza-ot-zapoya-czena irkutsk
Сразу после поступления вызова специалист прибывает на дом для проведения первичного осмотра. На данном этапе нарколог:
Узнать больше – http://narcolog-na-dom-ryazan00.ru/vyzov-narkologa-na-dom-ryazan/
Перед кодированием важно снять острую интоксикацию и стабилизировать состояние. В «Орион-Клиник» пациенту проводят курс инфузионной терапии: капельницы с регидратационными растворами, гепатопротекторами и витаминно-минеральными комплексами. Это позволяет восстановить водно-электролитный баланс, поддержать функции печени и почек, нормализовать артериальное давление и работу сердца. Одновременно психолог проводит предварительные беседы для выяснения причин зависимости, уровня тревожности и мотивации. Подготовительный этап длится от одного до трёх дней в зависимости от тяжести состояния и поможет снизить риск побочных эффектов при введении кодирующего препарата.
Изучить вопрос глубже – кодирование от алкоголизма выезд на дом
Запой – это серьезная угроза для здоровья. Немедленно вызывайте нарколога на дом в Волгограде! Нарколог приедет к вам быстро, сохранит анонимность и подберет индивидуальное лечение. Мы быстро выведем токсины и вернем вам хорошее самочувствие. В любое время дня и ночи мы готовы приехать и начать лечение. Мы сочетаем медикаменты и психологическую поддержку для успешного лечения. Первый этап лечения – избавление от токсинов с помощью лекарств.
Углубиться в тему – вывести из запоя
После оформления заявки по телефону или на сайте оператор уточняет адрес и текущее состояние пациента. В критических ситуациях врач может прибыть в течение 60 минут, в стандартном режиме — за 1–2 часа. На месте проводится сбор анамнеза и оценка жизненных показателей: артериального давления, пульса, сатурации и температуры тела. Затем выбирается оптимальный протокол детоксикации — «мягкий» метод для постепенного выведения токсинов или экспресс-методика при острой интоксикации. Процедура капельного введения комбинированного раствора длится от двух до четырёх часов: специалист контролирует состояние пациента, корректирует дозировки и при необходимости вводит корригирующие препараты. По окончании врач оставляет детальный план поддерживающей терапии, включающий рекомендации по питанию, приёму сорбентов и витаминов, а также график повторных осмотров.
Получить дополнительные сведения – http://narkolog-na-dom-ramenskoe4.ru
Клиника «Феникс-Мед» предлагает два базовых формата лечения, позволяющих адаптировать помощь под состояние пациента и его предпочтения.
Детальнее – vyvod iz zapoya stacionar
Длительный запой приводит к нарастанию интоксикации, истощению нервной системы, серьёзным нарушениям в работе печени, почек и сердца. Могут возникнуть тяжёлые психозы (белая горячка), судороги, развитие алкогольной энцефалопатии, панкреатит, обострение хронических болезней. Самостоятельные попытки выйти из запоя с помощью «народных средств», внезапного отказа от алкоголя, промывания желудка или лекарств из домашней аптечки часто только усугубляют состояние.
Разобраться лучше – vyvod iz zapoya nedorogo
Запой – опасная стадия алкоголизма, когда организм требует постоянного поступления алкоголя. Лечение на дому – это конфиденциально, удобно и позволяет начать детоксикацию в комфортных условиях. При запое каждая минута на счету, поэтому важно быстро обратиться за помощью. Врач поможет очистить организм от токсинов, восстановить баланс и нормализовать работу внутренних органов. Для успешного лечения запоя важен комплексный подход, включающий лекарства и работу с психологом. Первый шаг – очищение организма от алкоголя с помощью капельниц и других препаратов.
Узнать больше – анонимный вывод из запоя волгоград
Чем раньше проведена детоксикация, тем меньше риск развития серьезных последствий, таких как инфаркт, инсульт, алкогольный психоз, цирроз печени.
Подробнее тут – капельница от запоя в москве
Во-вторых, реабилитация является неотъемлемой частью нашего подхода. Мы понимаем, что избавление от физической зависимости — это только первый шаг. Важной задачей является восстановление социального статуса, создание новых привычек и умение управлять своей жизнью без наркотиков или алкоголя. Наша клиника предлагает групповые и индивидуальные занятия, направленные на изменение поведения и мышления.
Подробнее – http://kapelnica-ot-zapoya-irkutsk.ru/kapelnica-ot-zapoya-v-stacionare-v-irkutske/https://kapelnica-ot-zapoya-irkutsk.ru
При запое важна каждая минута! Круглосуточный вызов нарколога в Волгоградской области – решение проблемы! Обращайтесь к нам в любое время суток, и мы вам поможем! Мы обеспечиваем оперативное вмешательство, индивидуальный подход и высокий уровень безопасности. Мы – это оперативная и надежная помощь в трудную минуту. Мы обеспечим детоксикацию и стабилизацию вашего состояния, где вам будет удобно. Первый шаг – диагностика, чтобы определить план лечения.
Выяснить больше – клиника вывод из запоя волгоград
В Химках решение есть — наркологическая клиника. Здесь помогают людям выйти из запоя без страха и осуждения. Всё анонимно, грамотно и с заботой о каждом пациенте.
Получить дополнительные сведения – химки.
Перед оформлением вызова проводится предварительная телефонная консультация, позволяющая оценить тяжесть состояния и заранее подготовить необходимые препараты.
Узнать больше – https://kapelnica-ot-zapoya-voronezh.ru/
На территории Мурманска работает множество клиник с разным уровнем сервиса и направленностью. Однако не каждая из них может обеспечить надёжную и безопасную помощь. Многие пациенты сталкиваются с формальным лечением, не включающим индивидуальный подход или постреабилитационную поддержку. Поэтому крайне важно заранее ознакомиться с основными признаками хорошей клиники и задать правильные вопросы при первичном обращении.
Получить дополнительную информацию – наркологические клиники алкоголизм мурманская область
Лечение алкоголизма в Видном — это системная, комплексная терапия, сочетающая современные медицинские и психологические методики, которая позволяет не только справиться с физической зависимостью, но и обрести устойчивую трезвость на долгие годы. В наркологической клинике «Пульсар-Мед» пациентам доступен полный цикл помощи: от экстренной детоксикации и купирования абстинентного синдрома до долгосрочной реабилитации и поддержки на всех этапах восстановления. Каждая программа подбирается индивидуально, с учётом возраста, стажа употребления, сопутствующих заболеваний и особенностей семейной и социальной ситуации.
Детальнее – https://lechenie-alkogolizma-vidnoe4.ru/lechenie-alkogolizma-na-domu-v-vidnom/
Запой — это серьёзное состояние, при котором организм страдает от накопления токсинов, обезвоживания и нарушения обмена веществ. Клиника «ВоронежЛайф» предлагает услугу выездного инфузионного лечения от запоя с возможностью круглосуточного реагирования. Благодаря персонализированному подходу и использованию современных автоматизированных систем дозирования, наши специалисты обеспечивают безопасную и эффективную детоксикацию в условиях домашнего уюта.
Разобраться лучше – вызвать капельницу от запоя на дому воронеж
В программе используются когнитивно-поведенческая терапия, мотивационное интервьюирование, арт- и телесно-ориентированные практики. Занятия помогают пациенту осознать причины употребления, выработать навыки управления эмоциями и стрессом, сформировать устойчивую внутреннюю мотивацию к отказу от вещества.
Подробнее тут – лечение наркомании архангельск.
Таблица: Основные признаки надёжного центра лечения наркомании
Ознакомиться с деталями – наркологическое лечение наркомания мурманск
Каждый день запоя увеличивает риск для жизни. Не рискуйте — специалисты в Химках приедут на дом и окажут экстренную помощь. Без боли, стресса и ожидания.
Получить дополнительные сведения – vyvod-iz-zapoya-kruglosutochno himki
Клиника располагается в зелёной зоне на окраине города, что обеспечивает тишину и возможность уединённого выздоровления. Интерьеры помещений спроектированы с учётом принципов эргономики и психотерапевтического комфорта: мягкое освещение, натуральные материалы, удобная мебель. Все сотрудники прошли специальную подготовку по работе с зависимыми пациентами и знают, как создать доверительную атмосферу с первого визита.
Исследовать вопрос подробнее – лечение наркомании и алкоголизма в архангельске
Проблема зависимости от алкоголя, наркотиков и азартных игр остается одной из наиболее острых в современном обществе. Эти состояния оказывают значительное воздействие не только на здоровье самого человека, но и на его семью, друзей и общественные связи. Наркологическая клиника “Восстановление души” предлагает широкий спектр услуг для тех, кто борется с различными формами зависимости, такими как алкоголизм, наркомания и игромания. Наша цель — предоставить комплексный подход к лечению, что обеспечивает высокие показатели успешности среди наших пациентов.
Подробнее тут – поставить капельницу от запоя иркутск
Перед оформлением вызова проводится предварительная телефонная консультация, позволяющая оценить тяжесть состояния и заранее подготовить необходимые препараты.
Подробнее можно узнать тут – вызвать капельницу от запоя на дому в воронеже
Запой – это крайняя степень алкоголизма, требующая профессионального вмешательства. Нарколог на дом в Волгограде – ваш выбор. Лечение на дому помогает избежать стресса и сохранить анонимность, получив необходимую помощь. Важно как можно быстрее начать лечение, чтобы избежать токсического воздействия алкоголя на организм. Лечение на дому направлено на очищение организма, восстановление баланса и нормальную работу органов. Для достижения долгосрочного результата важно сочетать медикаментозную терапию и психологическую поддержку. Начинаем с детоксикации, используя капельницы и современные препараты.
Получить дополнительные сведения – вывод из запоя цены волгоград
Запой – критическое состояние, грозящее жизни! Не ждите, вызывайте нарколога в Волгоградской области круглосуточно! Не важно, день или ночь – нарколог приедет к вам в любое время! Мы гарантируем быструю, безопасную и индивидуальную помощь. Мы гарантируем быструю и надежную помощь при запое. Мы готовы помочь вам, где бы вы ни находились – дома или в клинике! Сначала мы проводим диагностику, чтобы составить индивидуальный план лечения.
Детальнее – вывод из запоя волгоградская область
По информации ГБУЗ «Областной центр медицинской профилактики» Мурманской области, учреждения, ориентированные на результат, открыто информируют о применяемых методиках и допусках к лечению. Важно, чтобы уже на этапе первого контакта вы получили не только цену, но и понимание того, что вам предстоит.
Получить дополнительные сведения – http://lechenie-alkogolizma-murmansk0.ru/klinika-lecheniya-alkogolizma-marmansk/
Вызов врача-нарколога на дом актуален в ситуациях, когда пациенту требуется срочная медицинская помощь, но его состояние не позволяет самостоятельно обратиться в клинику. Основными причинами вызова нарколога на дом являются:
Подробнее можно узнать тут – https://narcolog-na-dom-sankt-peterburg00.ru/narkolog-na-dom-czena-spb/
Второй этап — купирование абстинентного синдрома. Под контролем нарколога вводятся современные инфузионные растворы, витамины, седативные и поддерживающие препараты. Это позволяет вывести токсины, нормализовать работу сердца, печени и почек, снять тревогу, восстановить сон. При необходимости, особенно в случаях тяжёлых запоев, может быть подключена аппаратная детоксикация (плазмаферез, гемосорбция), что помогает быстро облегчить состояние даже при длительных и тяжёлых формах зависимости.
Выяснить больше – http://lechenie-alkogolizma-vidnoe4.ru
На территории Мурманска работает множество клиник с разным уровнем сервиса и направленностью. Однако не каждая из них может обеспечить надёжную и безопасную помощь. Многие пациенты сталкиваются с формальным лечением, не включающим индивидуальный подход или постреабилитационную поддержку. Поэтому крайне важно заранее ознакомиться с основными признаками хорошей клиники и задать правильные вопросы при первичном обращении.
Разобраться лучше – наркологическая клиника
Критерии оценки профессионального уровня сотрудников:
Исследовать вопрос подробнее – лечение наркомании и алкоголизма ярославль
Каждый день запоя увеличивает риск для жизни. Не рискуйте — специалисты в Химках приедут на дом и окажут экстренную помощь. Без боли, стресса и ожидания.
Получить больше информации – narkolog-vyvod-iz-zapoya himki
В зависимости от состояния пациента, помощь может быть оказана в домашних условиях или в стационаре. Вызов нарколога на дом особенно актуален при абстинентном синдроме или тяжелом алкогольном опьянении. Как отмечается в материалах НМИЦ психиатрии и наркологии, в таких ситуациях крайне важно избежать самолечения и довериться врачам, способным правильно подобрать препараты и дозировки.
Подробнее тут – срочная наркологическая помощь в архангельске
Близкий человек в запое? Не ждите ухудшения. Обратитесь в клинику — здесь проведут профессиональный вывод из запоя с последующим восстановлением организма.
Получить дополнительные сведения – вывод из запоя анонимно город химки
Мы понимаем, что лечение от алкогольной зависимости — это только первый шаг на пути к восстановлению. Профилактика рецидивов — важная часть нашего подхода. Мы проводим тренинги и курсы, направленные на развитие навыков борьбы с соблазнами и стрессом. Психотерапевтическая поддержка помогает пациентам справиться с эмоциональными трудностями, а также укрепляет мотивацию для сохранения трезвости.
Исследовать вопрос подробнее – http://kapelnica-ot-zapoya-irkutsk3.ru/kapelnica-ot-zapoya-cena-v-irkutske/
Диагностика включает общий и биохимический анализ крови, оценку работы печени и почек, электрокардиографию и психологическое тестирование для выявления уровня мотивации.
Подробнее тут – кодирование от алкоголизма в пушкино
Выбор клиники — задача не только медицинская, но и стратегическая. Учитывать нужно не только наличие лицензии, но и содержание программ, их гибкость, участие родственников в процессе, а также прозрачность взаимодействия с пациентом. Именно эти аспекты позволяют отличить профессиональное учреждение от формального.
Изучить вопрос глубже – http://narkologicheskaya-klinika-yaroslavl0.ru
Сразу после поступления вызова специалист прибывает на дом для проведения первичного осмотра. На данном этапе нарколог:
Выяснить больше – http://narcolog-na-dom-ryazan00.ru/vrach-narkolog-na-dom-ryazan/
Своевременный выезд нарколога снижает риск осложнений и ускоряет вывод из запоя, а под контролем профессионала каждая процедура проходит максимально безопасно.
Детальнее – https://vyvod-iz-zapoya-reutov4.ru/vyvod-iz-zapoya-na-domu-v-reutove
Медицинский вывод из запоя — это единственно правильное и безопасное решение. Врач-нарколог не только устранит симптомы отравления, но и грамотно скорректирует все жизненно важные параметры, предотвратит резкое падение давления, судорожный синдром, обеспечит защиту печени, почек и сердца.
Ознакомиться с деталями – http://vyvod-iz-zapoya-orekhovo-zuevo4.ru/anonimnyj-vyvod-iz-zapoya-v-orekhovo-zuevo/
После оформления заявки по телефону или на сайте оператор уточняет адрес и текущее состояние пациента. В критических ситуациях врач может прибыть в течение 60 минут, в стандартном режиме — за 1–2 часа. На месте проводится сбор анамнеза и оценка жизненных показателей: артериального давления, пульса, сатурации и температуры тела. Затем выбирается оптимальный протокол детоксикации — «мягкий» метод для постепенного выведения токсинов или экспресс-методика при острой интоксикации. Процедура капельного введения комбинированного раствора длится от двух до четырёх часов: специалист контролирует состояние пациента, корректирует дозировки и при необходимости вводит корригирующие препараты. По окончании врач оставляет детальный план поддерживающей терапии, включающий рекомендации по питанию, приёму сорбентов и витаминов, а также график повторных осмотров.
Исследовать вопрос подробнее – выезд нарколога на дом
Основные показания для проведения капельницы на дому:
Подробнее – капельница от запоя клиника
Дополнительно выясняются аллергические реакции, приём других препаратов и предпочтения пациента по времени визита врача.
Детальнее – капельница от запоя цена воронежская область
Запой – это серьезная угроза для здоровья. Немедленно вызывайте нарколога на дом в Волгограде! Нарколог приедет к вам быстро, сохранит анонимность и подберет индивидуальное лечение. Мы быстро выведем токсины и вернем вам хорошее самочувствие. В любое время дня и ночи мы готовы приехать и начать лечение. Мы сочетаем медикаменты и психологическую поддержку для успешного лечения. Первый этап лечения – избавление от токсинов с помощью лекарств.
Получить дополнительную информацию – вывод из запоя цены волгоград
Лечение выводом из запоя на дому в «ВоронежМед» организовано по отработанному протоколу, включающему несколько ключевых этапов.
Разобраться лучше – капельница от запоя воронеж.
Особую роль на первом этапе играет диагностика: важно выявить не только тип наркотика, но и наличие сопутствующих расстройств, стадию зависимости, мотивационное состояние пациента. От этого зависит, будет ли выбрана амбулаторная или стационарная форма лечения, какие методы будут применяться.
Выяснить больше – лечение наркомании
Запой – это опасная стадия! В Волгоградской области нарколог поможет круглосуточно! Мы всегда на связи, чтобы помочь вам справиться с запоем. Мы предлагаем быстрое, безопасное и индивидуальное лечение. Наша служба вывода из запоя работает четко и без сбоев. Мы предлагаем детоксикацию и стабилизацию состояния в любом месте. Мы начинаем с диагностики, чтобы понять, как лучше вам помочь.
Узнать больше – вывод из запоя волгоград
Лечение алкоголизма в Видном — это системная, комплексная терапия, сочетающая современные медицинские и психологические методики, которая позволяет не только справиться с физической зависимостью, но и обрести устойчивую трезвость на долгие годы. В наркологической клинике «Пульсар-Мед» пациентам доступен полный цикл помощи: от экстренной детоксикации и купирования абстинентного синдрома до долгосрочной реабилитации и поддержки на всех этапах восстановления. Каждая программа подбирается индивидуально, с учётом возраста, стажа употребления, сопутствующих заболеваний и особенностей семейной и социальной ситуации.
Узнать больше – клиника лечения алкоголизма
Клиника располагается в зелёной зоне на окраине города, что обеспечивает тишину и возможность уединённого выздоровления. Интерьеры помещений спроектированы с учётом принципов эргономики и психотерапевтического комфорта: мягкое освещение, натуральные материалы, удобная мебель. Все сотрудники прошли специальную подготовку по работе с зависимыми пациентами и знают, как создать доверительную атмосферу с первого визита.
Узнать больше – http://lechenie-narkomanii-arkhangelsk0.ru
Запой – это крайняя степень алкоголизма, требующая профессионального вмешательства. Нарколог на дом в Волгограде – ваш выбор. Лечение на дому помогает избежать стресса и сохранить анонимность, получив необходимую помощь. Важно как можно быстрее начать лечение, чтобы избежать токсического воздействия алкоголя на организм. Лечение на дому направлено на очищение организма, восстановление баланса и нормальную работу органов. Для достижения долгосрочного результата важно сочетать медикаментозную терапию и психологическую поддержку. Начинаем с детоксикации, используя капельницы и современные препараты.
Получить дополнительные сведения – http://vyvod-iz-zapoya-volgograd0.ru/vyvod-iz-zapoya-kapelnicza-volgograd
Каждый день запоя увеличивает риск для жизни. Не рискуйте — специалисты в Химках приедут на дом и окажут экстренную помощь. Без боли, стресса и ожидания.
Получить дополнительные сведения – вывод из запоя на дому круглосуточно город химки
Выбор наркологической клиники — ответственное решение, от которого зависит не только эффективность терапии, но и общее физическое и психоэмоциональное состояние пациента. Квалифицированная помощь должна быть своевременной, организованной и соответствующей медицинским стандартам. Как указывает Минздрав РФ, медицинские учреждения, предоставляющие помощь при зависимостях, обязаны иметь лицензию, профессиональный персонал и комплексный подход к лечению.
Подробнее тут – наркологическая клиника цены в мурманске
Зависимость от алкоголя или наркотиков — серьёзная проблема, требующая немедленного вмешательства квалифицированных специалистов. Если у вас или вашего близкого возникли признаки тяжелого похмелья, запоя или интоксикации, клиника «НаркологПлюс» предлагает услугу вызова нарколога на дом в Санкт-Петербурге. Наши врачи оперативно прибывают по указанному адресу, оказывают всю необходимую медицинскую помощь и помогают пациенту быстро вернуться к нормальной жизни.
Получить дополнительные сведения – https://narcolog-na-dom-sankt-peterburg00.ru/
Проблема зависимости от алкоголя, наркотиков и азартных игр остается одной из наиболее острых в современном обществе. Эти состояния оказывают значительное воздействие не только на здоровье самого человека, но и на его семью, друзей и общественные связи. Наркологическая клиника “Восстановление души” предлагает широкий спектр услуг для тех, кто борется с различными формами зависимости, такими как алкоголизм, наркомания и игромания. Наша цель — предоставить комплексный подход к лечению, что обеспечивает высокие показатели успешности среди наших пациентов.
Подробнее тут – капельница от запоя анонимно в иркутске
Близкий человек в запое? Не ждите ухудшения. Обратитесь в клинику — здесь проведут профессиональный вывод из запоя с последующим восстановлением организма.
Выяснить больше – вывод из запоя московская область
В зависимости от состояния пациента, помощь может быть оказана в домашних условиях или в стационаре. Вызов нарколога на дом особенно актуален при абстинентном синдроме или тяжелом алкогольном опьянении. Как отмечается в материалах НМИЦ психиатрии и наркологии, в таких ситуациях крайне важно избежать самолечения и довериться врачам, способным правильно подобрать препараты и дозировки.
Получить больше информации – http://narkologicheskaya-pomoshh-arkhangelsk0.ru/vyzov-narkologicheskoj-pomoshhi-arkhangelsk/https://narkologicheskaya-pomoshh-arkhangelsk0.ru
В нашей клинике “Сила воли” в Иркутске вы можете получить помощь как в стационаре, так и на дому. Мы предлагаем два вида услуг:
Детальнее – https://kapelnica-ot-zapoya-irkutsk3.ru/
После вашего звонка диспетчер фиксирует заявку и передаёт её свободному специалисту. Нарколог связывается для уточнения симптомов, времени начала запоя и наличия сопутствующих заболеваний, чтобы привезти нужные препараты.
Подробнее можно узнать тут – капельница от запоя клиника в воронеже
Терапия начинается с подробного обследования: врачи выясняют не только текущее физическое состояние, но и личные мотивы пациента, его страхи и ожидания от лечения. Диагностика включает анализы, ЭКГ, ультразвуковое исследование, а также психодиагностику. Уже на этом этапе формируется контакт между специалистом и пациентом, выстраивается доверие, что крайне важно для успеха последующей терапии.
Подробнее тут – lechenie alkogolizma vidnoe
После обращения оператор клиники уточняет все детали — состояние пациента, стаж запоев, наличие хронических болезней, принимаемые лекарства, аллергии. Далее в течение 30–60 минут на дом выезжает мобильная бригада: врач-нарколог и медсестра со всем необходимым оборудованием и медикаментами.
Получить больше информации – https://vyvod-iz-zapoya-orekhovo-zuevo4.ru/anonimnyj-vyvod-iz-zapoya-v-orekhovo-zuevo
Этот текст призван помочь читателю расширить кругозор и получить практические знания. Мы используем простой язык, наглядные примеры и структурированное изложение, чтобы сделать обучение максимально эффективным и увлекательным.
Почему это важно? – https://welovegeorgia.ge/test-1
Клиника «Орион-Клиник» располагает собственной лабораторией и оснащением для аппаратных методик, что позволяет проводить все этапы лечения под одним крышей. Наши врачи имеют международные сертификаты по наркологии и гипнотерапии, а психологи прошли дополнительное обучение по работе с зависимостями. Мы гарантируем:
Углубиться в тему – кодирование от алкоголизма на дому в пушкино
В статье представлены ключевые моменты по актуальной теме, дополненные советами экспертов и ссылками на дополнительные ресурсы. Цель материала — дать читателю инструменты для самостоятельного развития и принятия осознанных решений.
Как достичь результата? – https://rentsbuy.com/2021/02/kai-marcus-schroter
Публикация предлагает уникальную подборку информации, которая будет интересна как специалистам, так и широкому кругу читателей. Здесь вы найдете ответы на часто задаваемые вопросы и полезные инсайты для дальнейшего применения.
Подробнее – https://en.article19ao.org/photo-gallery/img_73122015
Этот информативный текст отличается привлекательным содержанием и актуальными данными. Мы предлагаем читателям взглянуть на привычные вещи под новым углом, предоставляя интересный и доступный материал. Получите удовольствие от чтения и расширьте кругозор!
Практические советы ждут тебя – https://greatmindhub.com/navigating-the-modern-career-landscape
Этот интересный отчет представляет собой сборник полезных фактов, касающихся актуальных тем. Мы проанализируем данные, чтобы вы могли сделать обоснованные выводы. Читайте, чтобы узнать больше о последних трендах и значимых событиях!
Подробнее тут – https://alisohani.com/connecting-readers-from-around-the-world-4
Этот информационный материал собраны данные, которые помогут лучше понять текущие тенденции и процессы в различных сферах жизни. Мы предоставляем четкий анализ, графики и примеры, чтобы информация была не только понятной, но и практичной для принятия решений.
Узнай первым! – https://ho.gctu.edu.gh/2021/03/04/hello-world
В этой публикации мы предлагаем подробные объяснения по актуальным вопросам, чтобы помочь читателям глубже понять их. Четкость и структурированность материала сделают его удобным для усвоения и применения в повседневной жизни.
Почему это важно? – https://tmsltd-x08c5pxewd.live-website.com/harnessing-the-power-of-social-media-for-business-growth
Этот информационный материал собраны данные, которые помогут лучше понять текущие тенденции и процессы в различных сферах жизни. Мы предоставляем четкий анализ, графики и примеры, чтобы информация была не только понятной, но и практичной для принятия решений.
Уточнить детали – https://imgtrix.ru
В этой статье представлен занимательный и актуальный контент, который заставит вас задуматься. Мы обсуждаем насущные вопросы и проблемы, а также освещаем истории, которые вдохновляют на действия и изменения. Узнайте, что стоит за событиями нашего времени!
Что ещё? Расскажи всё! – https://www.vigashpk.com/projects/cnc-machinery
Эта статья для ознакомления предлагает читателям общее представление об актуальной теме. Мы стремимся представить ключевые факты и идеи, которые помогут читателям получить представление о предмете и решить, стоит ли углубляться в изучение.
Почему это важно? – https://thaiseasalt.doae.go.th/?p=2119
В этой статье вы найдете познавательную и занимательную информацию, которая поможет вам лучше понять мир вокруг. Мы собрали интересные данные, которые вдохновляют на размышления и побуждают к действиям. Открывайте новую информацию и получайте удовольствие от чтения!
Лучшее решение — прямо здесь – https://www.konferenciadobrehozivota.sk/hello-world
Эта обзорная заметка содержит ключевые моменты и факты по актуальным вопросам. Она поможет читателям быстро ориентироваться в теме и узнать о самых важных аспектах сегодня. Получите краткий курс по современной информации и оставайтесь в курсе событий!
Узнай первым! – https://1xbonus2020.ru
Эта обзорная заметка содержит ключевые моменты и факты по актуальным вопросам. Она поможет читателям быстро ориентироваться в теме и узнать о самых важных аспектах сегодня. Получите краткий курс по современной информации и оставайтесь в курсе событий!
Расширить кругозор по теме – https://emergency-support.domei.church/?p=190
Эта информационная заметка содержит увлекательные сведения, которые могут вас удивить! Мы собрали интересные факты, которые сделают вашу жизнь ярче и полнее. Узнайте нечто новое о привычных аспектах повседневности и откройте для себя удивительный мир информации.
Смотри, что ещё есть – https://www.mdpiscines.fr/fond-piscines
Предлагаем вашему вниманию интересную справочную статью, в которой собраны ключевые моменты и нюансы по актуальным вопросам. Эта информация будет полезна как для профессионалов, так и для тех, кто только начинает изучать тему. Узнайте ответы на важные вопросы и расширьте свои знания!
Смотри, что ещё есть – https://luxurypoolsandbackyards.com/hello-world
Предлагаем вашему вниманию интересную справочную статью, в которой собраны ключевые моменты и нюансы по актуальным вопросам. Эта информация будет полезна как для профессионалов, так и для тех, кто только начинает изучать тему. Узнайте ответы на важные вопросы и расширьте свои знания!
Изучить аспект более тщательно – http://irabordo.ru
Запой – это неконтролируемое употребление алкоголя, которое приводит к серьезным последствиям. Алкогольное отравление организма приводит к серьезным проблемам со здоровьем. Выходить из запоя самостоятельно – рискованно и неэффективно. Мы предлагаем помощь при запое на дому, в привычных для вас условиях. Круглосуточная помощь при запое с выездом на дом за 30-60 минут. Длительный запой разрушает организм и может быть смертельным. Чем раньше вы обратитесь за помощью, тем больше шансов на выздоровление.
Выяснить больше – нарколог вывод из запоя красноярск
Основной этап – введение внутривенной капельницы с специально разработанными растворами. Эти растворы содержат электролиты, витамины и активные компоненты, способствующие быстрому выведению токсинов, восстановлению водно-солевого баланса и улучшению обмена веществ. Детоксикация позволяет снизить концентрацию алкоголя в крови, уменьшить симптомы абстиненции и подготовить организм к последующим этапам терапии.
Детальнее – нарколог на дом красноярск
Нужна срочная помощь при алкогольном отравлении или запое? Вызовите нарколога на дом в Иркутске! Квалифицированная помощь нарколога на дому: диагностика, капельница, стабилизация состояния. Круглосуточный выезд нарколога, анонимность и снижение рисков – с «ТрезвоМед». Самостоятельный отказ невозможен? Необходима наркологическая помощь. Васильев: «Не затягивайте с помощью при алкогольном отравлении!».
Подробнее – https://narcolog-na-dom-v-irkutske0.ru/vyzov-narkologa-na-dom-irkutsk/
Обратившись к нам, вы получите анонимное и безопасное лечение, полностью соответствующее медицинским стандартам.
Детальнее – https://narcolog-na-dom-novokuznetsk00.ru/narkolog-na-dom-czena-novokuzneczk
Не стоит медлить с вызовом врача-нарколога, если у человека проявляются тревожные признаки ухудшения состояния. Среди наиболее серьезных симптомов, требующих немедленного вмешательства врача, можно выделить продолжительный запой (более двух дней подряд), частую рвоту, невыносимую головную боль, выраженный тремор рук и тела, повышение артериального давления, нарушение ритма сердца, а также психические нарушения, включая тревогу, галлюцинации и бессонницу. Чем раньше пациент обратится за профессиональной помощью, тем выше шансы избежать серьезных осложнений и быстро вернуться к нормальной жизни.
Подробнее можно узнать тут – вывод из запоя на дому цена новосибирск
Если в состоянии пациента наблюдаются такие признаки, как судороги, панические атаки, или гипертонический криз, необходимо немедленно вызвать врачей. Задержка может привести к необратимым последствиям.
Подробнее можно узнать тут – http://narcolog-na-dom-novokuznetsk0.ru/narkolog-lechenie-na-domu-novokuzneczk/
После поступления вашего звонка специалист оперативно выезжает по указанному адресу в Нижнем Новгороде и проводит первичную диагностику. Врач измеряет основные жизненные показатели: артериальное давление, пульс, сатурацию кислорода в крови и оценивает степень алкогольной интоксикации. Затем подбирается индивидуальный состав капельницы, который позволяет максимально быстро снять симптомы похмелья и абстиненции.
Выяснить больше – https://kapelnica-ot-zapoya-nizhniy-novgorod0.ru/kapelnicza-ot-zapoya-czena-nizhnij-novgorod/
Клинические протоколы стационарной терапии рекомендуют госпитализацию при средней и тяжёлой степени интоксикации.
Получить больше информации – http://vyvod-iz-zapoya-v-ryazani12.ru/anonimnyj-vyvod-iz-zapoya-v-ryazani/
Наша клиника сочетает в себе оперативность, комфорт и высокие стандарты безопасности. Вот основные преимущества сотрудничества:
Выяснить больше – вызвать капельницу от запоя на дому
Алкогольная и наркотическая зависимости требуют незамедлительного медицинского вмешательства. Длительные запои или острое отравление могут привести к тяжелым осложнениям и серьезным проблемам со здоровьем. Клиника «МедТрезвость» в Санкт-Петербурге предлагает квалифицированную наркологическую помощь прямо на дому, обеспечивая полную конфиденциальность и безопасность пациента. Наши специалисты оперативно выезжают по адресу, проводят все необходимые процедуры и помогают максимально быстро стабилизировать состояние пациента в комфортных домашних условиях.
Получить дополнительные сведения – нарколог на дом цена санкт-петербург
Современное общество сталкивается с множеством вызовов, связанных с различными зависимостями, которые наносят серьезный урон как физическому, так и психоэмоциональному состоянию человека. Алкоголизм, наркомания и другие виды зависимости не только нарушают здоровье, но и разрушают личные отношения, затрудняют трудовую деятельность и социальную адаптацию. В наркологической клинике “Сила воли” в Иркутске мы предлагаем профессиональную помощь в лечении зависимости и проведении реабилитационных мероприятий, направленных на восстановление здоровья и социальной интеграции пациентов.
Подробнее тут – kapelnicza-ot-zapoya-czena irkutsk
После первичной диагностики начинается активная фаза медикаментозного вмешательства. Современные препараты вводятся капельничным методом, что позволяет оперативно снизить концентрацию токсинов в крови и восстановить нормальные обменные процессы. Этот этап критически важен для стабилизации работы внутренних органов, таких как печень, почки и сердце.
Изучить вопрос глубже – вызвать нарколога на дом в рязани
При запое организм отравляется, и нужна экстренная помощь нарколога в Волгограде. Получите квалифицированную помощь на дому, сохраняя конфиденциальность и удобство. Быстрая детоксикация и восстановление здоровья – наша задача. Мы приедем к вам как можно скорее и окажем всю необходимую помощь. Мы подберем лекарства и поможем вам справиться с психологическими проблемами. Начинаем с детоксикации, чтобы очистить организм от вредных веществ.
Углубиться в тему – вывод из запоя в волгограде
Стоимость услуг по установке капельницы определяется индивидуально и зависит от нескольких факторов. В первую очередь, цена обусловлена тяжестью состояния пациента: при более сильной интоксикации и выраженных симптомах абстинентного синдрома может потребоваться расширенная терапия. Кроме того, итоговая сумма зависит от продолжительности запоя, так как длительное употребление спиртного ведет к более серьезному накоплению токсинов, требующему дополнительных лечебных мероприятий.
Получить больше информации – http://kapelnica-ot-zapoya-nizhniy-novgorod000.ru/
После обращения пациента в клинику «НаркоЩит» наш специалист выезжает на дом в течение 30–60 минут. По прибытии врач проводит подробный осмотр: измеряет артериальное давление, пульс и уровень кислорода в крови, а также собирает анамнез, чтобы оценить степень интоксикации и тяжесть запоя. На основе полученной информации формируется индивидуальный план лечения.
Узнать больше – вызвать капельницу от запоя на дому нижний новгород
Мы работаем круглосуточно и гарантируем строгое соблюдение конфиденциальности, используя только сертифицированные препараты и проверенные методики лечения.
Исследовать вопрос подробнее – вызов нарколога на дом
Второй этап — купирование абстинентного синдрома. Под контролем нарколога вводятся современные инфузионные растворы, витамины, седативные и поддерживающие препараты. Это позволяет вывести токсины, нормализовать работу сердца, печени и почек, снять тревогу, восстановить сон. При необходимости, особенно в случаях тяжёлых запоев, может быть подключена аппаратная детоксикация (плазмаферез, гемосорбция), что помогает быстро облегчить состояние даже при длительных и тяжёлых формах зависимости.
Получить больше информации – лечение алкоголизма
Кодирование основано на блокировке механизмов зависимости на биохимическом и поведенческом уровнях. Медикаментозные методы включают введение препаратов пролонгированного действия, которые нарушают метаболизм этанола: при попытке выпить даже небольшую дозу алкоголь вызывает выражённые неприятные реакции, что психологически отвращает от новой пробы спиртного. Психотерапевтические техники, такие как гипноз или метод Довженко, направлены на переустановку подсознательных программ, удаление эмоционального влечения к алкоголю и укрепление мотивации к здоровому образу жизни. Аппаратные методики (электроимпульсная стимуляция, транскраниальная микрополяризация) воздействуют на нейроны, участвующие в развитии зависимости, снижая их активность и уменьшая физиологический дискомфорт. В «Орион-Клиник» часто используют комбинированные программы: сначала проводится детоксикация организма, затем вводится медикаментозное средство, после чего реализуется психотерапевтический блок влияния на подсознание.
Получить дополнительные сведения – кодирование от алкоголизма цены
При запое организм теряет контроль над употреблением алкоголя. В Волгограде вызов нарколога на дом поможет быстро стабилизировать состояние. На дому можно получить квалифицированную помощь, провести детоксикацию и сохранить анонимность. Не затягивайте с вызовом нарколога, чтобы избежать необратимых последствий для организма. Вывод токсинов, восстановление баланса и нормализация работы организма – задачи нарколога на дому. Медикаменты и психология – основа лечения запоя на дому. Детоксикация – первый этап лечения, который проводится с помощью современных препаратов.
Выяснить больше – http://vyvod-iz-zapoya-volgograd0.ru
Вызывать нарколога на дом рекомендуется при следующих состояниях:
Выяснить больше – выезд нарколога на дом
Запой – критическое состояние, грозящее жизни! Не ждите, вызывайте нарколога в Волгоградской области круглосуточно! Не важно, день или ночь – нарколог приедет к вам в любое время! Мы гарантируем быструю, безопасную и индивидуальную помощь. Мы гарантируем быструю и надежную помощь при запое. Мы готовы помочь вам, где бы вы ни находились – дома или в клинике! Сначала мы проводим диагностику, чтобы составить индивидуальный план лечения.
Исследовать вопрос подробнее – https://vyvod-iz-zapoya-volgograd000.ru
В течение процедуры пациент находится под непрерывным наблюдением: внутривенные капельницы с регидратационными растворами, витаминно-минеральными комплексами и гепатопротекторами обеспечивают восстановление функций печени, нормализацию обменных процессов и поддержку работы сердечно-сосудистой системы. При необходимости к лечению привлекаются узкопрофильные врачи — кардиолог, невролог или терапевт — что делает процесс максимально комплексным. По завершении выведения из запоя врач предоставляет подробный план поддерживающей терапии с рекомендациями по питанию, питьевому режиму и графику повторных консультаций.
Подробнее тут – vyvod iz zapoya kruglosutochno
Пациенту устанавливают катетер в вену на руке или предплечье, используя лёгкий местный анестетик для минимизации дискомфорта. Затем подключают автоматизированную помпу, обеспечивающую равномерную подачу раствора в течение 3–6 часов.
Выяснить больше – http://kapelnica-ot-zapoya-voronezh2.ru
В зависимости от степени выраженности абстинентного синдрома и наличия сопутствующих осложнений клиника «Азимут Здоровья» предлагает два основных формата оказания помощи, позволяющих оптимально сочетать эффективность лечения и комфорт пациента. Каждый вариант тщательно продуман: мы учитываем не только медицинские показания, но и личные предпочтения, чтобы вы или ваш близкий чувствовали себя максимально защищённо и спокойно. Оба формата подразумевают строгий контроль жизненных показателей и сопровождение на всех этапах — от первой капельницы до завершения курса поддерживающей терапии.
Узнать больше – врач нарколог на дом раменское
Наша клиника сочетает в себе оперативность, комфорт и высокие стандарты безопасности. Вот основные преимущества сотрудничества:
Получить дополнительную информацию – врача капельницу от запоя воронеж
Поддержка — ключевой элемент на пути к выздоровлению. Мы предлагаем программы, которые продолжаются даже после завершения основного курса лечения. Пациенты имеют возможность участвовать в регулярных встречах с психологами и наркологами, где они могут делиться своими успехами и получать необходимую помощь.
Получить дополнительные сведения – капельница от запоя цена в иркутске
Алкогольный запой представляет собой тяжелое состояние, вызванное длительным бесконтрольным употреблением спиртных напитков. Без медицинского вмешательства вывести организм из запоя может быть сложно и даже опасно. Срочная помощь нарколога требуется при следующих признаках:
Подробнее тут – https://kapelnica-ot-zapoya-nizhniy-novgorod0.ru/kapelnicza-ot-zapoya-czena-nizhnij-novgorod
Не стоит медлить с вызовом врача-нарколога, если у человека проявляются тревожные признаки ухудшения состояния. Среди наиболее серьезных симптомов, требующих немедленного вмешательства врача, можно выделить продолжительный запой (более двух дней подряд), частую рвоту, невыносимую головную боль, выраженный тремор рук и тела, повышение артериального давления, нарушение ритма сердца, а также психические нарушения, включая тревогу, галлюцинации и бессонницу. Чем раньше пациент обратится за профессиональной помощью, тем выше шансы избежать серьезных осложнений и быстро вернуться к нормальной жизни.
Подробнее – наркологический вывод из запоя новосибирск
Запой – это не просто пьянство, а состояние, когда организм становится зависимым от алкоголя. Накопление токсинов приводит к сбоям в работе органов и ослаблению защиты организма. Самостоятельный выход из запоя может быть опасен и только усугубить состояние. Мы предлагаем лечение запоя на дому, чтобы избежать больницы и создать комфорт. Наши специалисты быстро приедут к вам и окажут всю необходимую помощь круглосуточно. Запой приводит к серьезным проблемам со здоровьем, ухудшает качество жизни и угрожает жизни. Очень важно вовремя обратиться за помощью, чтобы избежать необратимых последствий.
Получить дополнительные сведения – вывод из запоя красноярск
Медицинский вывод из запоя — это единственно правильное и безопасное решение. Врач-нарколог не только устранит симптомы отравления, но и грамотно скорректирует все жизненно важные параметры, предотвратит резкое падение давления, судорожный синдром, обеспечит защиту печени, почек и сердца.
Узнать больше – http://vyvod-iz-zapoya-orekhovo-zuevo4.ru
Вся процедура проходит под полным контролем врача и занимает от 40 минут до 2 часов. Пациенту и его родственникам даются рекомендации по дальнейшему лечению и профилактике повторных запоев.
Подробнее тут – http://
Поскольку запой – это не только физическое, но и психологическое испытание, своевременная помощь нарколога является ключевым фактором для предотвращения серьезных осложнений и сохранения жизни пациента. Чем раньше начнется лечение, тем больше шанс на успешное восстановление и предотвращение повторных эпизодов.
Разобраться лучше – вызов нарколога на дом цена красноярск
Специалист уточняет, сколько времени продолжается запой, какой тип алкоголя употребляется, а также наличие сопутствующих заболеваний. Тщательный анализ этих данных помогает определить оптимальные методы детоксикации и скорректировать терапевтическую стратегию для минимизации риска осложнений.
Разобраться лучше – нарколог на дом анонимно рязань
Наркологическая помощь на дому становится всё более востребованной благодаря своей доступности, конфиденциальности и эффективности. Клиника «МедТрезвость» предлагает пациентам целый ряд важных преимуществ:
Получить дополнительную информацию – врач нарколог на дом ленинградская область
Запой – это очень опасно, нужно срочно вызывать нарколога на дом в Волгограде! Помощь нарколога на дому – это оперативно, удобно и анонимно. Мы быстро очистим ваш организм от алкоголя и восстановим его работу. Наши специалисты готовы приехать к вам в любое время суток. Лечение комплексное: лекарства, индивидуальный подход и психологическая помощь. Первый шаг – детоксикация, мы поможем вам избавиться от алкогольной интоксикации.
Получить больше информации – вывод из запоя цены волгоград
Запой, интоксикация? Вызовите нарколога на дом в Иркутске для быстрой и анонимной помощи. На дому: осмотр, подбор лечения, капельница для вывода токсинов и улучшение самочувствия. «ТрезвоМед» – круглосуточная наркологическая помощь на дому с гарантией анонимности. Не справляетесь с зависимостью сами? Вызовите нарколога на дом. Васильев подчеркивает: «Оперативная помощь – ключ к выздоровлению при отравлении алкоголем».
Подробнее можно узнать тут – narcolog-na-dom-v-irkutske0.ru/vrach-narkolog-na-dom-irkutsk/
Терапия начинается с подробного обследования: врачи выясняют не только текущее физическое состояние, но и личные мотивы пациента, его страхи и ожидания от лечения. Диагностика включает анализы, ЭКГ, ультразвуковое исследование, а также психодиагностику. Уже на этом этапе формируется контакт между специалистом и пациентом, выстраивается доверие, что крайне важно для успеха последующей терапии.
Разобраться лучше – lechenie pivnogo alkogolizma
При звонке на горячую линию операторы уточняют основные параметры: возраст пациента, длительность запоя, частоту и количество употреблённого алкоголя, наличие хронических заболеваний. Это позволяет заранее подготовить необходимый набор медикаментов и оборудования.
Выяснить больше – posle-kapelniczy-ot-zapoya voronezh
В нашей клинике используются только эффективные и безопасные препараты, что гарантирует вам быстрое восстановление и минимальные риски.
Исследовать вопрос подробнее – капельница от запоя иркутск
Алкогольный запой представляет собой тяжелое состояние, вызванное длительным бесконтрольным употреблением спиртных напитков. Без медицинского вмешательства вывести организм из запоя может быть сложно и даже опасно. Срочная помощь нарколога требуется при следующих признаках:
Подробнее можно узнать тут – https://kapelnica-ot-zapoya-nizhniy-novgorod0.ru/kapelnicza-ot-zapoya-czena-nizhnij-novgorod/
Если в состоянии пациента наблюдаются такие признаки, как судороги, панические атаки, или гипертонический криз, необходимо немедленно вызвать врачей. Задержка может привести к необратимым последствиям.
Разобраться лучше – http://narcolog-na-dom-novokuznetsk0.ru/
Клиника «Орион-Клиник» располагает собственной лабораторией и оснащением для аппаратных методик, что позволяет проводить все этапы лечения под одним крышей. Наши врачи имеют международные сертификаты по наркологии и гипнотерапии, а психологи прошли дополнительное обучение по работе с зависимостями. Мы гарантируем:
Детальнее – кодирование от алкоголизма выезд на дом
Стоимость услуг по установке капельницы определяется индивидуально и зависит от нескольких факторов. В первую очередь, цена обусловлена тяжестью состояния пациента: при более сильной интоксикации и выраженных симптомах абстинентного синдрома может потребоваться расширенная терапия. Кроме того, итоговая сумма зависит от продолжительности запоя, так как длительное употребление спиртного ведет к более серьезному накоплению токсинов, требующему дополнительных лечебных мероприятий.
Исследовать вопрос подробнее – капельница от запоя наркология нижний новгород
Вызов врача-нарколога на дом актуален в ситуациях, когда пациенту требуется срочная медицинская помощь, но его состояние не позволяет самостоятельно обратиться в клинику. Основными причинами вызова нарколога на дом являются:
Разобраться лучше – вызов нарколога на дом в санкт-петербурге
После поступления вызова нарколог клиники «АльфаНаркология» оперативно выезжает по указанному адресу. На месте врач проводит первичную диагностику, оценивая степень интоксикации, физическое и психологическое состояние пациента. По результатам осмотра врач подбирает индивидуальный комплекс лечебных процедур, в который входит постановка капельницы с растворами для детоксикации, препараты для стабилизации работы органов и нормализации психического состояния.
Исследовать вопрос подробнее – http://narcolog-na-dom-sankt-peterburg000.ru/vyzov-narkologa-na-dom-spb/https://narcolog-na-dom-sankt-peterburg000.ru
При звонке на горячую линию операторы уточняют основные параметры: возраст пациента, длительность запоя, частоту и количество употреблённого алкоголя, наличие хронических заболеваний. Это позволяет заранее подготовить необходимый набор медикаментов и оборудования.
Ознакомиться с деталями – http://kapelnica-ot-zapoya-voronezh3.ru/kapelnicza-ot-zapoya-czena-v-voronezhe/
После стабилизации назначаются препараты, снижающие влечение к алкоголю, нормализующие работу нервной системы и улучшающие общее самочувствие. К методам кодирования относятся уколы, вшивание препаратов, аппаратные методики и психотерапевтические техники. Врач всегда индивидуально подбирает программу — с учётом предыдущего опыта, наличия хронических болезней, особенностей организма.
Узнать больше – https://lechenie-alkogolizma-vidnoe4.ru/lechenie-alkogolizma-stoimost-v-vidnom/
Клиника «Феникс-Мед» предлагает два базовых формата лечения, позволяющих адаптировать помощь под состояние пациента и его предпочтения.
Получить дополнительные сведения – vyvod iz zapoya cena
Запой – опасная стадия алкоголизма, когда организм требует постоянного поступления алкоголя. Лечение на дому – это конфиденциально, удобно и позволяет начать детоксикацию в комфортных условиях. При запое каждая минута на счету, поэтому важно быстро обратиться за помощью. Врач поможет очистить организм от токсинов, восстановить баланс и нормализовать работу внутренних органов. Для успешного лечения запоя важен комплексный подход, включающий лекарства и работу с психологом. Первый шаг – очищение организма от алкоголя с помощью капельниц и других препаратов.
Получить дополнительную информацию – http://vyvod-iz-zapoya-volgograd0.ru/vyvod-iz-zapoya-kruglosutochno-volgograd/
Инфузионная терапия при запое основывается на принципе постепенной и контролируемой доставки лекарственных препаратов и питательных смесей непосредственно в кровеносное русло. Это позволяет:
Получить больше информации – врач на дом капельница от запоя
По окончании курса детоксикации нарколог дает пациенту и его близким подробные рекомендации, помогающие быстрее восстановить здоровье и предотвратить повторные случаи запоев.
Подробнее можно узнать тут – вывод из запоя на дому новосибирск
Игнорирование состояния пациента или попытки самостоятельно справиться с запоем могут привести к опасным последствиям для жизни и здоровья. Поэтому важно своевременно обращаться за профессиональной медицинской помощью.
Получить больше информации – https://narcolog-na-dom-sankt-peterburg0.ru/psikhiatr-narkolog-na-dom-spb/
В условиях, когда алкогольная зависимость угрожает жизни, оперативное вмешательство становится ключевым фактором для сохранения здоровья. В Рязани круглосуточная помощь нарколога на дому позволяет начать комплексное лечение запоя и алкогольной интоксикации в самые критические моменты. Такая услуга обеспечивает детоксикацию организма, стабилизацию жизненно важных показателей и психологическую поддержку, что способствует скорейшему восстановлению в комфортной обстановке, без необходимости посещения стационара.
Узнать больше – нарколог на дом недорого в рязани
Запой – потеря контроля над алкоголем и резкое отравление организма. Лечение на дому – это быстро, конфиденциально и с индивидуальным подходом. Экстренный вывод из запоя – это быстрая детоксикация и восстановление обмена веществ. Мы выезжаем круглосуточно, чтобы оперативно оценить состояние и начать лечение. На дому мы используем лекарства и психологическую поддержку для достижения максимального эффекта. Мы сначала очистим организм от алкоголя с помощью специальных лекарств.
Исследовать вопрос подробнее – нарколог на дом вывод из запоя на дому
Запой – это опасная стадия! В Волгоградской области нарколог поможет круглосуточно! Мы всегда на связи, чтобы помочь вам справиться с запоем. Мы предлагаем быстрое, безопасное и индивидуальное лечение. Наша служба вывода из запоя работает четко и без сбоев. Мы предлагаем детоксикацию и стабилизацию состояния в любом месте. Мы начинаем с диагностики, чтобы понять, как лучше вам помочь.
Получить дополнительную информацию – вывод из запоя цена волгоград
Клиника «ТоксинНет» предлагает профессиональную помощь при алкогольной зависимости и запоях в Нижнем Новгороде. Наши опытные наркологи круглосуточно выезжают на дом для оказания экстренной медицинской помощи. Основным методом лечения является капельница от запоя, которая позволяет оперативно снять интоксикацию и стабилизировать общее состояние пациента. Мы обеспечиваем конфиденциальность, индивидуальный подход и высокий уровень безопасности процедур.
Исследовать вопрос подробнее – https://kapelnica-ot-zapoya-nizhniy-novgorod0.ru/kapelnicza-ot-zapoya-na-domu-nizhnij-novgorod/
После оформления заявки по телефону или на сайте оператор уточняет адрес и текущее состояние пациента. В критических ситуациях врач может прибыть в течение 60 минут, в стандартном режиме — за 1–2 часа. На месте проводится сбор анамнеза и оценка жизненных показателей: артериального давления, пульса, сатурации и температуры тела. Затем выбирается оптимальный протокол детоксикации — «мягкий» метод для постепенного выведения токсинов или экспресс-методика при острой интоксикации. Процедура капельного введения комбинированного раствора длится от двух до четырёх часов: специалист контролирует состояние пациента, корректирует дозировки и при необходимости вводит корригирующие препараты. По окончании врач оставляет детальный план поддерживающей терапии, включающий рекомендации по питанию, приёму сорбентов и витаминов, а также график повторных осмотров.
Исследовать вопрос подробнее – https://narkolog-na-dom-ramenskoe4.ru/narkolog-na-dom-srochno-v-ramenskom
Стоимость услуг по установке капельницы определяется индивидуально и зависит от нескольких факторов. В первую очередь, цена обусловлена тяжестью состояния пациента: при более сильной интоксикации и выраженных симптомах абстинентного синдрома может потребоваться расширенная терапия. Кроме того, итоговая сумма зависит от продолжительности запоя, так как длительное употребление спиртного ведет к более серьезному накоплению токсинов, требующему дополнительных лечебных мероприятий.
Получить больше информации – [url=https://kapelnica-ot-zapoya-nizhniy-novgorod000.ru/]капельница от запоя цена нижний новгород.[/url]
Запой – это не просто пьянство, а состояние, когда организм становится зависимым от алкоголя. Накопление токсинов приводит к сбоям в работе органов и ослаблению защиты организма. Самостоятельный выход из запоя может быть опасен и только усугубить состояние. Мы предлагаем лечение запоя на дому, чтобы избежать больницы и создать комфорт. Наши специалисты быстро приедут к вам и окажут всю необходимую помощь круглосуточно. Запой приводит к серьезным проблемам со здоровьем, ухудшает качество жизни и угрожает жизни. Очень важно вовремя обратиться за помощью, чтобы избежать необратимых последствий.
Изучить вопрос глубже – https://vyvod-iz-zapoya-krasnoyarsk0.ru/vyvod-iz-zapoya-kruglosutochno-krasnoyarsk/
Наша клиника сочетает в себе оперативность, комфорт и высокие стандарты безопасности. Вот основные преимущества сотрудничества:
Изучить вопрос глубже – вызвать капельницу от запоя воронеж
Вызывать нарколога на дом рекомендуется при следующих состояниях:
Детальнее – нарколог на дом цена в санкт-петербурге
Мы понимаем, что лечение от алкогольной зависимости — это только первый шаг на пути к восстановлению. Профилактика рецидивов — важная часть нашего подхода. Мы проводим тренинги и курсы, направленные на развитие навыков борьбы с соблазнами и стрессом. Психотерапевтическая поддержка помогает пациентам справиться с эмоциональными трудностями, а также укрепляет мотивацию для сохранения трезвости.
Исследовать вопрос подробнее – капельница от запоя на дому в иркутске
В «Пульсар-Мед» с пониманием относятся к каждому обратившемуся: здесь нет осуждения и формального отношения. Врач-нарколог ведёт пациента на всём пути, а команда психологов и социальных работников обеспечивает поддержку на каждом этапе. Мы предлагаем анонимное лечение — ваши данные не попадут к третьим лицам, а обращение в клинику не фиксируется в государственных реестрах.
Подробнее – клиника лечения алкоголизма
Вызов врача-нарколога на дом актуален в ситуациях, когда пациенту требуется срочная медицинская помощь, но его состояние не позволяет самостоятельно обратиться в клинику. Основными причинами вызова нарколога на дом являются:
Исследовать вопрос подробнее – нарколог на дом вывод из запоя
Поскольку запой – это не только физическое, но и психологическое испытание, своевременная помощь нарколога является ключевым фактором для предотвращения серьезных осложнений и сохранения жизни пациента. Чем раньше начнется лечение, тем больше шанс на успешное восстановление и предотвращение повторных эпизодов.
Углубиться в тему – https://narcolog-na-dom-krasnoyarsk0.ru/
Алкогольная и наркотическая зависимости требуют незамедлительного медицинского вмешательства. Длительные запои или острое отравление могут привести к тяжелым осложнениям и серьезным проблемам со здоровьем. Клиника «МедТрезвость» в Санкт-Петербурге предлагает квалифицированную наркологическую помощь прямо на дому, обеспечивая полную конфиденциальность и безопасность пациента. Наши специалисты оперативно выезжают по адресу, проводят все необходимые процедуры и помогают максимально быстро стабилизировать состояние пациента в комфортных домашних условиях.
Разобраться лучше – нарколог на дом недорого санкт-петербург
Перед кодированием важно снять острую интоксикацию и стабилизировать состояние. В «Орион-Клиник» пациенту проводят курс инфузионной терапии: капельницы с регидратационными растворами, гепатопротекторами и витаминно-минеральными комплексами. Это позволяет восстановить водно-электролитный баланс, поддержать функции печени и почек, нормализовать артериальное давление и работу сердца. Одновременно психолог проводит предварительные беседы для выяснения причин зависимости, уровня тревожности и мотивации. Подготовительный этап длится от одного до трёх дней в зависимости от тяжести состояния и поможет снизить риск побочных эффектов при введении кодирующего препарата.
Разобраться лучше – принудительное кодирование от алкоголизма
Инфузионная терапия при запое основывается на принципе постепенной и контролируемой доставки лекарственных препаратов и питательных смесей непосредственно в кровеносное русло. Это позволяет:
Выяснить больше – https://kapelnica-ot-zapoya-voronezh2.ru/kapelnicza-ot-zapoya-czena-v-voronezhe
При запое организм теряет контроль над употреблением алкоголя. В Волгограде вызов нарколога на дом поможет быстро стабилизировать состояние. На дому можно получить квалифицированную помощь, провести детоксикацию и сохранить анонимность. Не затягивайте с вызовом нарколога, чтобы избежать необратимых последствий для организма. Вывод токсинов, восстановление баланса и нормализация работы организма – задачи нарколога на дому. Медикаменты и психология – основа лечения запоя на дому. Детоксикация – первый этап лечения, который проводится с помощью современных препаратов.
Детальнее – vyvod-iz-zapoya-volgograd0.ru/
Специалист уточняет, сколько времени продолжается запой, какой тип алкоголя употребляется, а также наличие сопутствующих заболеваний. Тщательный анализ этих данных помогает определить оптимальные методы детоксикации и скорректировать терапевтическую стратегию для минимизации риска осложнений.
Получить больше информации – запой нарколог на дом
Запой – потеря контроля над алкоголем и резкое отравление организма. Лечение на дому – это быстро, конфиденциально и с индивидуальным подходом. Экстренный вывод из запоя – это быстрая детоксикация и восстановление обмена веществ. Мы выезжаем круглосуточно, чтобы оперативно оценить состояние и начать лечение. На дому мы используем лекарства и психологическую поддержку для достижения максимального эффекта. Мы сначала очистим организм от алкоголя с помощью специальных лекарств.
Узнать больше – вывести из запоя
Если требуется срочное кодирование или детоксикация, вызов нарколога на дом – лучшее решение в Иркутске. Профессиональный нарколог приедет, оценит состояние, проведет детоксикацию на дому. «ТрезвоМед»: анонимный выезд нарколога 24/7, помощь при отказе от алкоголя. Тяжело бросить пить в одиночку? Обратитесь к наркологу! Главное – быстро оказать помощь при интоксикации, – нарколог Васильев.
Разобраться лучше – нарколог в иркутске
Игнорирование этих симптомов или попытки самолечения могут привести к серьезным осложнениям. Своевременная установка капельницы на дому позволяет быстро улучшить состояние пациента и минимизировать последствия запоя.
Получить больше информации – врач на дом капельница от запоя в нижний новгороде
Стоимость услуг по установке капельницы определяется индивидуально и зависит от нескольких факторов. В первую очередь, цена обусловлена тяжестью состояния пациента: при более сильной интоксикации и выраженных симптомах абстинентного синдрома может потребоваться расширенная терапия. Кроме того, итоговая сумма зависит от продолжительности запоя, так как длительное употребление спиртного ведет к более серьезному накоплению токсинов, требующему дополнительных лечебных мероприятий.
Получить больше информации – после капельницы от запоя в нижний новгороде
Наши специалисты используют проверенные и сертифицированные медикаменты, которые подбираются индивидуально для каждого пациента:
Разобраться лучше – вызвать капельницу от запоя в нижний новгороде
Запой – это опасная стадия! В Волгоградской области нарколог поможет круглосуточно! Мы всегда на связи, чтобы помочь вам справиться с запоем. Мы предлагаем быстрое, безопасное и индивидуальное лечение. Наша служба вывода из запоя работает четко и без сбоев. Мы предлагаем детоксикацию и стабилизацию состояния в любом месте. Мы начинаем с диагностики, чтобы понять, как лучше вам помочь.
Углубиться в тему – http://vyvod-iz-zapoya-volgograd000.ru/vyvod-iz-zapoya-kapelnicza-volgograd/
Наша клиника сочетает в себе оперативность, комфорт и высокие стандарты безопасности. Вот основные преимущества сотрудничества:
Исследовать вопрос подробнее – http://www.domen.ru
Длительное и бесконтрольное употребление алкоголя может привести к состоянию запоя — опасному и тяжелому состоянию, при котором человек не способен самостоятельно отказаться от спиртного. Во время запоя организм постепенно накапливает токсины, что негативно сказывается на работе всех внутренних органов и систем. В таких случаях пациенту необходима экстренная врачебная помощь, и специалисты наркологической клиники «АнтиТокс» готовы оперативно оказать профессиональную медицинскую поддержку на дому в Новосибирске.
Подробнее можно узнать тут – вывод из запоя капельница
Этот информативный текст выделяется своими захватывающими аспектами, которые делают сложные темы доступными и понятными. Мы стремимся предложить читателям глубину знаний вместе с разнообразием интересных фактов. Откройте новые горизонты и развивайте свои способности познавать мир!
Посмотреть подробности – https://luman-precision.ru/koltsa-bystrosemnye-luman-precision-26-mm-nizkie-bh-7mm-alyuminiy-lp26lwal/reviews
Этот информативный текст отличается привлекательным содержанием и актуальными данными. Мы предлагаем читателям взглянуть на привычные вещи под новым углом, предоставляя интересный и доступный материал. Получите удовольствие от чтения и расширьте кругозор!
Погрузиться в детали – https://www.muggenronde.nl/3675-2
Этот текст сочетает в себе элементы познавательного рассказа и аналитической подачи информации. Читатель получает доступ к уникальным данным, которые соединяют прошлое с настоящим и открывают двери в будущее.
Более подробно об этом – http://ohtaki-agency.com/?p=2490
В этом информативном обзоре собраны самые интересные статистические данные и факты, которые помогут лучше понять текущие тренды. Мы представим вам цифры и графики, которые иллюстрируют, как развиваются различные сферы жизни. Эта информация станет отличной основой для глубокого анализа и принятия обоснованных решений.
Подробнее – https://ofasportsfoundation.com/lobortis-elementum-nibhtellus-molestie-adipiscing
Этот текст призван помочь читателю расширить кругозор и получить практические знания. Мы используем простой язык, наглядные примеры и структурированное изложение, чтобы сделать обучение максимально эффективным и увлекательным.
Почему это важно? – https://topic.lk/14828
Этот информационный материал собраны данные, которые помогут лучше понять текущие тенденции и процессы в различных сферах жизни. Мы предоставляем четкий анализ, графики и примеры, чтобы информация была не только понятной, но и практичной для принятия решений.
Не упусти важное! – https://trend.zenchin-fair.com/762516-afp01
Этот информативный текст выделяется своими захватывающими аспектами, которые делают сложные темы доступными и понятными. Мы стремимся предложить читателям глубину знаний вместе с разнообразием интересных фактов. Откройте новые горизонты и развивайте свои способности познавать мир!
Подробнее – https://biosector.com.br/06-2
Публикация приглашает вас исследовать неизведанное — от древних тайн до современных достижений науки. Вы узнаете, как случайные находки превращались в революции, а смелые мысли — в новые эры человеческого прогресса.
Получить полную информацию – https://www.nuffiland.no/testside
В этой информационной статье вы найдете интересное содержание, которое поможет вам расширить свои знания. Мы предлагаем увлекательный подход и уникальные взгляды на обсуждаемые темы, побуждая пользователей к активному мышлению и критическому анализу.
Нажми и узнай всё – https://newdesignhomes.com/how-to-lower-the-cost-of-home-renovation
Публикация приглашает вас исследовать неизведанное — от древних тайн до современных достижений науки. Вы узнаете, как случайные находки превращались в революции, а смелые мысли — в новые эры человеческого прогресса.
Продолжить изучение – https://guitarvideos.ru
Этот интересный отчет представляет собой сборник полезных фактов, касающихся актуальных тем. Мы проанализируем данные, чтобы вы могли сделать обоснованные выводы. Читайте, чтобы узнать больше о последних трендах и значимых событиях!
Лови подробности – https://divi-jo.com/all-images-of-gardeners
Этот текст сочетает в себе элементы познавательного рассказа и аналитической подачи информации. Читатель получает доступ к уникальным данным, которые соединяют прошлое с настоящим и открывают двери в будущее.
Нажмите, чтобы узнать больше – https://phelionline.co.za/_sb_country/french-southern-territories
В этом обзорном материале представлены увлекательные детали, которые находят отражение в различных аспектах жизни. Мы исследуем непонятные и интересные моменты, позволяя читателю увидеть картину целиком. Погрузитесь в мир знаний и удивительных открытий!
Лови подробности – https://houlihanlokeyglobalgetaway.com/keo-tai-xiu
Эта статья предлагает уникальную подборку занимательных фактов и необычных историй, которые вы, возможно, не знали. Мы постараемся вдохновить ваше воображение и разнообразить ваш кругозор, погружая вас в мир, полный интересных открытий. Читайте и открывайте для себя новое!
Получить больше информации – https://nonatoday.com/health/jeff-sessions-sued-by-12-year-old-girl-with-epilepsy-who-wants-to-legalize-medical-marijuana
Эта информационная заметка содержит увлекательные сведения, которые могут вас удивить! Мы собрали интересные факты, которые сделают вашу жизнь ярче и полнее. Узнайте нечто новое о привычных аспектах повседневности и откройте для себя удивительный мир информации.
Лови подробности – https://japanstours.com/5-most-beautiful-islands-in-asia
Этот увлекательный информационный материал подарит вам массу новых знаний и ярких эмоций. Мы собрали для вас интересные факты и сведения, которые обогатят ваш опыт. Откройте для себя увлекательный мир информации и насладитесь процессом изучения!
Смотрите также… – http://vipjetbet.online/post/34
Этот текст призван помочь читателю расширить кругозор и получить практические знания. Мы используем простой язык, наглядные примеры и структурированное изложение, чтобы сделать обучение максимально эффективным и увлекательным.
Только для своих – https://topic.lk/11715
Публикация приглашает вас исследовать неизведанное — от древних тайн до современных достижений науки. Вы узнаете, как случайные находки превращались в революции, а смелые мысли — в новые эры человеческого прогресса.
Более того — здесь – https://airconditioningrepairdallastx.com/hello-world
Эта обзорная заметка содержит ключевые моменты и факты по актуальным вопросам. Она поможет читателям быстро ориентироваться в теме и узнать о самых важных аспектах сегодня. Получите краткий курс по современной информации и оставайтесь в курсе событий!
Уточнить детали – http://carlists.ru
Этот информационный материал собраны данные, которые помогут лучше понять текущие тенденции и процессы в различных сферах жизни. Мы предоставляем четкий анализ, графики и примеры, чтобы информация была не только понятной, но и практичной для принятия решений.
Провести детальное исследование – https://rickromano.com/rick-romano-sea-turtles-on-bamboo
Эта статья для ознакомления предлагает читателям общее представление об актуальной теме. Мы стремимся представить ключевые факты и идеи, которые помогут читателям получить представление о предмете и решить, стоит ли углубляться в изучение.
Обратитесь за информацией – https://www.pocenistran.si/spletni-marketing/email-marketing
Первым этапом лечения является медицинская детоксикация, которая направлена на удаление токсинов из организма и стабилизацию физического состояния пациента. Мы используем современные методики, которые помогают минимизировать симптомы абстиненции, такие как головная боль, тошнота и слабость, обеспечивая комфортное пребывание в клинике.
Подробнее тут – https://kapelnica-ot-zapoya-irkutsk2.ru/kapelnica-ot-zapoya-anonimno-v-irkutske
Пациенту устанавливают катетер в вену на руке или предплечье, используя лёгкий местный анестетик для минимизации дискомфорта. Затем подключают автоматизированную помпу, обеспечивающую равномерную подачу раствора в течение 3–6 часов.
Получить дополнительные сведения – капельница от запоя воронежская область
В-третьих, поддержка является критически важным компонентом на пути к выздоровлению. Мы предлагаем программы, которые продолжаются даже после завершения основного курса лечения. Пациенты имеют возможность участвовать в регулярных встречах, где они могут делиться своими успехами и получать помощь от специалистов.
Ознакомиться с деталями – https://kapelnica-ot-zapoya-irkutsk.ru/kapelnica-ot-zapoya-v-kruglosutochno-v-irkutske/
Затяжной запой опасен для жизни. Врачи наркологической клиники в Химках проводят срочный вывод из запоя — на дому или в стационаре. Анонимно, безопасно, круглосуточно.
Подробнее – вывод из запоя капельница город химки
Перед оформлением вызова проводится предварительная телефонная консультация, позволяющая оценить тяжесть состояния и заранее подготовить необходимые препараты.
Исследовать вопрос подробнее – вызвать капельницу от запоя
Игнорирование состояния пациента или попытки самостоятельно справиться с запоем могут привести к опасным последствиям для жизни и здоровья. Поэтому важно своевременно обращаться за профессиональной медицинской помощью.
Углубиться в тему – нарколог на дом вывод из запоя санкт-петербург
Современное общество сталкивается с множеством вызовов, связанных с различными зависимостями, которые наносят серьезный урон как физическому, так и психоэмоциональному состоянию человека. Алкоголизм, наркомания и другие виды зависимости не только нарушают здоровье, но и разрушают личные отношения, затрудняют трудовую деятельность и социальную адаптацию. В наркологической клинике “Сила воли” в Иркутске мы предлагаем профессиональную помощь в лечении зависимости и проведении реабилитационных мероприятий, направленных на восстановление здоровья и социальной интеграции пациентов.
Углубиться в тему – капельница от запоя на дому иркутская область
Вызывать нарколога на дом рекомендуется при следующих состояниях:
Узнать больше – нарколог на дом недорого в санкт-петербурге
Запой – опасная стадия алкоголизма, когда организм требует постоянного поступления алкоголя. Лечение на дому – это конфиденциально, удобно и позволяет начать детоксикацию в комфортных условиях. При запое каждая минута на счету, поэтому важно быстро обратиться за помощью. Врач поможет очистить организм от токсинов, восстановить баланс и нормализовать работу внутренних органов. Для успешного лечения запоя важен комплексный подход, включающий лекарства и работу с психологом. Первый шаг – очищение организма от алкоголя с помощью капельниц и других препаратов.
Углубиться в тему – http://vyvod-iz-zapoya-volgograd0.ru/vyvod-iz-zapoya-na-domu-volgograd
Лечение зависимости требует не только физической детоксикации, но и работы с психоэмоциональным состоянием пациента. Психотерапевтическая поддержка помогает выявить глубинные причины зависимости, снизить уровень стресса и сформировать устойчивые навыки самоконтроля, что существенно снижает риск рецидивов.
Ознакомиться с деталями – http://narcolog-na-dom-ufa000.ru/
Запой – это опасная стадия! В Волгоградской области нарколог поможет круглосуточно! Мы всегда на связи, чтобы помочь вам справиться с запоем. Мы предлагаем быстрое, безопасное и индивидуальное лечение. Наша служба вывода из запоя работает четко и без сбоев. Мы предлагаем детоксикацию и стабилизацию состояния в любом месте. Мы начинаем с диагностики, чтобы понять, как лучше вам помочь.
Ознакомиться с деталями – алкоголизм лечение вывод из запоя волгоград
Наши врачи уделяют внимание не только медицинским аспектам, но также социальным и психологическим факторам. Мы помогаем пациентам находить новый смысл в жизни, формировать новые увлечения и восстанавливать старые связи с близкими.
Узнать больше – после капельницы от запоя
При запое организм отравляется, и нужна экстренная помощь нарколога в Волгограде. Получите квалифицированную помощь на дому, сохраняя конфиденциальность и удобство. Быстрая детоксикация и восстановление здоровья – наша задача. Мы приедем к вам как можно скорее и окажем всю необходимую помощь. Мы подберем лекарства и поможем вам справиться с психологическими проблемами. Начинаем с детоксикации, чтобы очистить организм от вредных веществ.
Ознакомиться с деталями – срочный вывод из запоя волгоград
Близкий человек в запое? Не ждите ухудшения. Обратитесь в клинику — здесь проведут профессиональный вывод из запоя с последующим восстановлением организма.
Узнать больше – срочный вывод из запоя город химки
Услуга вызова нарколога на дом в Уфе разработана для оперативного вывода из запоя без необходимости госпитализации. Это особенно актуально для тех, кто столкнулся с алкогольной интоксикацией в условиях, когда каждая минута имеет значение. Своевременная помощь позволяет не только устранить негативное воздействие алкоголя на организм, но и предотвратить возможные осложнения, такие как нарушения работы сердца, печени и почек.
Разобраться лучше – врач нарколог на дом платный уфа
Пациенты выбирают нашу клинику для срочного вызова врача-нарколога благодаря следующим важным преимуществам:
Подробнее – врач нарколог на дом новосибирская область
Вызов врача-нарколога на дом актуален в ситуациях, когда пациенту требуется срочная медицинская помощь, но его состояние не позволяет самостоятельно обратиться в клинику. Основными причинами вызова нарколога на дом являются:
Получить больше информации – врач нарколог на дом
Эти данные являются основой для составления индивидуального плана лечения, позволяющего оперативно скорректировать терапевтические меры.
Узнать больше – http://narcolog-na-dom-ryazan00.ru
В клинике “Восстановление души” работает команда высококвалифицированных специалистов, готовых предложить современное и эффективное лечение зависимостей. Наши врачи-наркологи обладают обширным опытом работы и постоянно совершенствуют свои навыки, чтобы использовать самые передовые методы терапии.
Выяснить больше – http://kapelnica-ot-zapoya-irkutsk2.ru
Затяжной запой опасен для жизни. Врачи наркологической клиники в Химках проводят срочный вывод из запоя — на дому или в стационаре. Анонимно, безопасно, круглосуточно.
Получить дополнительную информацию – наркологический вывод из запоя в химках
Комплексная терапия при выводе из запоя на дому включает в себя два основных направления: медикаментозную детоксикацию и психологическую поддержку. Такой подход позволяет добиться быстрого и устойчивого эффекта, минимизируя риск осложнений и обеспечивая долгосрочную ремиссию.
Выяснить больше – врач нарколог на дом платный в уфе
Алкогольная и наркотическая зависимости требуют незамедлительного медицинского вмешательства. Длительные запои или острое отравление могут привести к тяжелым осложнениям и серьезным проблемам со здоровьем. Клиника «МедТрезвость» в Санкт-Петербурге предлагает квалифицированную наркологическую помощь прямо на дому, обеспечивая полную конфиденциальность и безопасность пациента. Наши специалисты оперативно выезжают по адресу, проводят все необходимые процедуры и помогают максимально быстро стабилизировать состояние пациента в комфортных домашних условиях.
Подробнее тут – нарколог на дом клиника
Домашний вывод из запоя подходит тем, кто сохраняет относительно стабильные жизненные показатели и нуждается в минимальном мониторинге. Врач приезжает в удобное для вас время, проводит все необходимые манипуляции в привычной обстановке и остаётся на связи после процедуры для оперативной консультации.
Подробнее – http://vyvod-iz-zapoya-reutov4.ru/vyvod-iz-zapoya-na-domu-v-reutove/
Специалист выясняет продолжительность запоя, характер симптомов и наличие сопутствующих заболеваний. Полученные данные являются основой для составления индивидуальной программы терапии и выбора оптимальных медикаментов.
Исследовать вопрос подробнее – https://narcolog-na-dom-ufa00.ru/narkolog-na-dom-ufa-czeny/
После процедуры пациент и его близкие получают развернутые рекомендации по дальнейшему восстановлению, советы по профилактике рецидивов и возможности прохождения кодирования при желании пациента.
Получить дополнительную информацию – http://narcolog-na-dom-sankt-peterburg000.ru/psikhiatr-narkolog-na-dom-spb/
Проблема зависимости от алкоголя, наркотиков и азартных игр остается одной из наиболее острых в современном обществе. Эти состояния оказывают значительное воздействие не только на здоровье самого человека, но и на его семью, друзей и общественные связи. Наркологическая клиника “Восстановление души” предлагает широкий спектр услуг для тех, кто борется с различными формами зависимости, такими как алкоголизм, наркомания и игромания. Наша цель — предоставить комплексный подход к лечению, что обеспечивает высокие показатели успешности среди наших пациентов.
Получить дополнительные сведения – https://kapelnica-ot-zapoya-irkutsk2.ru/
После поступления вызова наш нарколог выезжает к пациенту в кратчайшие сроки, прибывая по адресу в пределах 30–60 минут. Специалист начинает процедуру с подробного осмотра и диагностики, измеряя ключевые показатели организма: артериальное давление, частоту пульса, насыщенность кислородом и собирая подробный анамнез.
Получить дополнительные сведения – нарколог на дом вывод новосибирск
Клиника «МедАльянс» оказывает профессиональную медицинскую помощь на дому в Москве и Московской области круглосуточно. Опытные врачи-наркологи приедут в течение часа после вызова, проведут полную диагностику, поставят капельницу и быстро вернут пациента в стабильное состояние.
Получить дополнительные сведения – kapelnicza-ot-zapoya-na-domu moskva
Инфузионная терапия при запое основывается на принципе постепенной и контролируемой доставки лекарственных препаратов и питательных смесей непосредственно в кровеносное русло. Это позволяет:
Получить дополнительную информацию – капельница от запоя выезд воронеж
Запой – это очень опасно! Круглосуточная помощь нарколога в Волгоградской области – ваш шанс выжить. Мы оказываем помощь круглосуточно, чтобы вы могли начать лечение в любой момент. Мы обеспечиваем оперативное вмешательство, индивидуальный подход и высокий уровень безопасности. Служба круглосуточного вывода из запоя работает оперативно и надежно. При ухудшении состояния, мы готовы выехать на дом или принять вас в клинике для детоксикации. Начинаем с диагностики: сбор анамнеза, измерение показателей и оценка степени интоксикации.
Получить дополнительные сведения – нарколог на дом вывод из запоя на дому
Обращение к врачу требуется в тех случаях, когда человек не может самостоятельно справиться с последствиями запоя, а отказ от медицинской помощи может привести к серьезным осложнениям.
Подробнее – капельница от запоя вызов
Когда организм уже не может обходиться без алкоголя, возникает запой. Вызов нарколога на дом в Волгограде – это безопасно и эффективно. Нарколог приедет на дом, проведет детоксикацию и поможет стабилизировать состояние, не нарушая привычный ритм жизни. Своевременная помощь нарколога поможет избежать осложнений, вызванных запоем. Дома нарколог поможет очистить организм и восстановить его нормальную работу. Избавление от запоя на дому – это сочетание лекарств и психологической помощи. Сначала нужно очистить организм от токсинов, и в этом помогут специальные препараты.
Исследовать вопрос подробнее – вывод из запоя дешево волгоград
Запой — опасное состояние, связанное с длительным и бесконтрольным употреблением алкоголя, которое требует срочного медицинского вмешательства. Обычные методы самолечения не способны обеспечить полноценную очистку организма от токсинов и стабилизацию состояния пациента. Наиболее эффективным и безопасным способом является постановка капельницы от запоя на дому под контролем профессионального врача.
Детальнее – https://kapelnica-ot-zapoya-moskva00.ru/kapelnicza-ot-zapoya-anonimno-msk/
В Химках решение есть — наркологическая клиника. Здесь помогают людям выйти из запоя без страха и осуждения. Всё анонимно, грамотно и с заботой о каждом пациенте.
Детальнее – vyvod-iz-zapoya-himki12.ru
При запое организм отравляется, и нужна экстренная помощь нарколога в Волгограде. Получите квалифицированную помощь на дому, сохраняя конфиденциальность и удобство. Быстрая детоксикация и восстановление здоровья – наша задача. Мы приедем к вам как можно скорее и окажем всю необходимую помощь. Мы подберем лекарства и поможем вам справиться с психологическими проблемами. Начинаем с детоксикации, чтобы очистить организм от вредных веществ.
Выяснить больше – срочный вывод из запоя волгоград
В Химках решение есть — наркологическая клиника. Здесь помогают людям выйти из запоя без страха и осуждения. Всё анонимно, грамотно и с заботой о каждом пациенте.
Получить дополнительные сведения – вывод из запоя на дому московская область
Зависимость от алкоголя или наркотиков — серьёзная проблема, требующая немедленного вмешательства квалифицированных специалистов. Если у вас или вашего близкого возникли признаки тяжелого похмелья, запоя или интоксикации, клиника «НаркологПлюс» предлагает услугу вызова нарколога на дом в Санкт-Петербурге. Наши врачи оперативно прибывают по указанному адресу, оказывают всю необходимую медицинскую помощь и помогают пациенту быстро вернуться к нормальной жизни.
Подробнее тут – нарколог на дом вывод
Услуга вызова нарколога на дом в Уфе разработана для оперативного вывода из запоя без необходимости госпитализации. Это особенно актуально для тех, кто столкнулся с алкогольной интоксикацией в условиях, когда каждая минута имеет значение. Своевременная помощь позволяет не только устранить негативное воздействие алкоголя на организм, но и предотвратить возможные осложнения, такие как нарушения работы сердца, печени и почек.
Углубиться в тему – врач нарколог на дом платный в уфе
Когда запой становится угрозой для жизни, оперативное вмешательство становится ключевым для спасения здоровья и предотвращения серьезных осложнений. В Рязани вызов нарколога на дом позволяет начать лечение в самые критические моменты, обеспечивая детоксикацию организма и восстановление его нормального функционирования в условиях, где пациент чувствует себя комфортно и сохраняет свою конфиденциальность. Этот формат оказания медицинской помощи особенно актуален для тех, кто хочет избежать длительного ожидания в стационаре и предпочитает лечение в привычной домашней обстановке.
Получить дополнительные сведения – narkolog-na-dom-czena rjazan’
Клиника “Обновление” также активно занимается просветительской деятельностью. Мы организуем семинары и лекции, которые помогают обществу лучше понять проблемы зависимостей, их последствия и пути решения. Повышение осведомленности является важным шагом на пути к улучшению ситуации в этой области.
Получить больше информации – http://kapelnica-ot-zapoya-irkutsk.ru
Во-первых, мы фокусируемся на медицинской детоксикации, которая является первоочередной задачей при лечении зависимостей. Этот процесс позволяет удалить токсические вещества из организма и улучшить общее состояние пациента. Мы применяем современные методики, которые помогают минимизировать симптомы абстиненции и обеспечить комфортное пребывание в клинике.
Узнать больше – https://kapelnica-ot-zapoya-irkutsk.ru/kapelnica-ot-zapoya-na-domu-v-irkutske
Лечение зависимости требует не только физической детоксикации, но и работы с психоэмоциональным состоянием пациента. Психотерапевтическая поддержка помогает выявить глубинные причины зависимости, снизить уровень стресса и сформировать устойчивые навыки самоконтроля, что существенно снижает риск рецидивов.
Разобраться лучше – нарколог уфа
Проблема зависимости от алкоголя, наркотиков и азартных игр остается одной из наиболее острых в современном обществе. Эти состояния оказывают значительное воздействие не только на здоровье самого человека, но и на его семью, друзей и общественные связи. Наркологическая клиника “Восстановление души” предлагает широкий спектр услуг для тех, кто борется с различными формами зависимости, такими как алкоголизм, наркомания и игромания. Наша цель — предоставить комплексный подход к лечению, что обеспечивает высокие показатели успешности среди наших пациентов.
Подробнее тут – https://kapelnica-ot-zapoya-irkutsk2.ru/kapelnica-ot-zapoya-anonimno-v-irkutske/
Алкогольная и наркотическая зависимости требуют незамедлительного медицинского вмешательства. Длительные запои или острое отравление могут привести к тяжелым осложнениям и серьезным проблемам со здоровьем. Клиника «МедТрезвость» в Санкт-Петербурге предлагает квалифицированную наркологическую помощь прямо на дому, обеспечивая полную конфиденциальность и безопасность пациента. Наши специалисты оперативно выезжают по адресу, проводят все необходимые процедуры и помогают максимально быстро стабилизировать состояние пациента в комфортных домашних условиях.
Выяснить больше – нарколог на дом
Мы понимаем, что лечение от алкогольной зависимости — это только первый шаг на пути к восстановлению. Профилактика рецидивов — важная часть нашего подхода. Мы проводим тренинги и курсы, направленные на развитие навыков борьбы с соблазнами и стрессом. Психотерапевтическая поддержка помогает пациентам справиться с эмоциональными трудностями, а также укрепляет мотивацию для сохранения трезвости.
Подробнее можно узнать тут – капельница от запоя анонимно иркутск
После поступления вызова наш нарколог выезжает к пациенту в кратчайшие сроки, прибывая по адресу в пределах 30–60 минут. Специалист начинает процедуру с подробного осмотра и диагностики, измеряя ключевые показатели организма: артериальное давление, частоту пульса, насыщенность кислородом и собирая подробный анамнез.
Подробнее можно узнать тут – http://narcolog-na-dom-novosibirsk00.ru
В Химках решение есть — наркологическая клиника. Здесь помогают людям выйти из запоя без страха и осуждения. Всё анонимно, грамотно и с заботой о каждом пациенте.
Углубиться в тему – вывод из запоя в стационаре
Вызов врача-нарколога на дом позволяет избежать стресса госпитализации, обеспечивая комфорт и удобство как для пациента, так и для его близких.
Изучить вопрос глубже – http://
Лечение выводом из запоя на дому в «ВоронежМед» организовано по отработанному протоколу, включающему несколько ключевых этапов.
Подробнее – http://kapelnica-ot-zapoya-voronezh.ru
Нельзя игнорировать первые признаки серьёзного алкогольного отравления: промедление повышает риск судорожных припадков, остановки дыхания и комы. Нарколог на дом в Реутове рекомендован при следующих симптомах:
Подробнее тут – http://
Проблема зависимости от алкоголя, наркотиков и азартных игр остается одной из наиболее острых в современном обществе. Эти состояния оказывают значительное воздействие не только на здоровье самого человека, но и на его семью, друзей и общественные связи. Наркологическая клиника “Восстановление души” предлагает широкий спектр услуг для тех, кто борется с различными формами зависимости, такими как алкоголизм, наркомания и игромания. Наша цель — предоставить комплексный подход к лечению, что обеспечивает высокие показатели успешности среди наших пациентов.
Узнать больше – http://kapelnica-ot-zapoya-irkutsk2.ru
Самостоятельно выйти из запоя — почти невозможно. В Химках врачи клиники проводят медикаментозный вывод из запоя с круглосуточным выездом. Доверяйте профессионалам.
Подробнее – вывод из запоя клиника город химки
При запое важна каждая минута! Круглосуточный вызов нарколога в Волгоградской области – решение проблемы! Обращайтесь к нам в любое время суток, и мы вам поможем! Мы обеспечиваем оперативное вмешательство, индивидуальный подход и высокий уровень безопасности. Мы – это оперативная и надежная помощь в трудную минуту. Мы обеспечим детоксикацию и стабилизацию вашего состояния, где вам будет удобно. Первый шаг – диагностика, чтобы определить план лечения.
Подробнее можно узнать тут – вывод. из. запоя. волгоград.
При запое организм теряет контроль над употреблением алкоголя. В Волгограде вызов нарколога на дом поможет быстро стабилизировать состояние. На дому можно получить квалифицированную помощь, провести детоксикацию и сохранить анонимность. Не затягивайте с вызовом нарколога, чтобы избежать необратимых последствий для организма. Вывод токсинов, восстановление баланса и нормализация работы организма – задачи нарколога на дому. Медикаменты и психология – основа лечения запоя на дому. Детоксикация – первый этап лечения, который проводится с помощью современных препаратов.
Выяснить больше – вывести из запоя
При запое организм отравляется, и нужна экстренная помощь нарколога в Волгограде. Получите квалифицированную помощь на дому, сохраняя конфиденциальность и удобство. Быстрая детоксикация и восстановление здоровья – наша задача. Мы приедем к вам как можно скорее и окажем всю необходимую помощь. Мы подберем лекарства и поможем вам справиться с психологическими проблемами. Начинаем с детоксикации, чтобы очистить организм от вредных веществ.
Детальнее – вывести из запоя
Запой — опасное состояние, которое стремительно приводит к тяжелым последствиям для организма. Обычные домашние методы восстановления при алкогольной интоксикации не только малоэффективны, но и небезопасны. Для быстрого и безопасного выведения токсинов требуется профессиональная помощь нарколога с применением капельницы от запоя.
Подробнее тут – врач на дом капельница от запоя
Комплексная терапия при выводе из запоя на дому включает в себя два основных направления: медикаментозную детоксикацию и психологическую поддержку. Такой подход позволяет добиться быстрого и устойчивого эффекта, минимизируя риск осложнений и обеспечивая долгосрочную ремиссию.
Углубиться в тему – https://narcolog-na-dom-ufa000.ru/narkolog-na-dom-czena-ufa
Вызов врача-нарколога на дом в Санкт-Петербурге начинается с детального осмотра и оценки состояния пациента. Врач измеряет давление, пульс, уровень кислорода в крови и определяет степень интоксикации.
Узнать больше – нарколог на дом вывод из запоя санкт-петербург
Когда запой становится угрозой для жизни, оперативное вмешательство становится ключевым для спасения здоровья и предотвращения серьезных осложнений. В Рязани вызов нарколога на дом позволяет начать лечение в самые критические моменты, обеспечивая детоксикацию организма и восстановление его нормального функционирования в условиях, где пациент чувствует себя комфортно и сохраняет свою конфиденциальность. Этот формат оказания медицинской помощи особенно актуален для тех, кто хочет избежать длительного ожидания в стационаре и предпочитает лечение в привычной домашней обстановке.
Узнать больше – запой нарколог на дом в рязани
Когда организм на пределе, важна срочная помощь в Химках — это команда опытных наркологов, которые помогут быстро и мягко выйти из запоя без вреда для здоровья.
Получить дополнительную информацию – vyvod-iz-zapoya-kruglosutochno himki
После завершения процедур пациенту предоставляется подробная консультация с рекомендациями по дальнейшему восстановлению и профилактике повторных случаев зависимости.
Узнать больше – нарколог на дом в новосибирске
После вызова врач клиники «ЗдравЦентр» прибывает к пациенту в течение 30–60 минут. Он проводит первичный осмотр, оценивает степень тяжести алкогольной интоксикации, измеряет пульс, давление, уровень кислорода и другие показатели здоровья. На основании этих данных составляется индивидуальный план лечения.
Ознакомиться с деталями – капельница от запоя цена в москве
Современные методы лечения при выводе из запоя включают как медикаментозную детоксикацию, так и психологическую реабилитацию. В Уфе наркологи используют капельничное введение лекарственных средств, которые помогают быстро вывести токсины, нормализовать обмен веществ и стабилизировать работу внутренних органов. Одновременно с этим проводится психологическая поддержка для снижения эмоционального стресса, связанного с запоем.
Детальнее – платный нарколог на дом в уфе
Алкогольная и наркотическая зависимости требуют незамедлительного медицинского вмешательства. Длительные запои или острое отравление могут привести к тяжелым осложнениям и серьезным проблемам со здоровьем. Клиника «МедТрезвость» в Санкт-Петербурге предлагает квалифицированную наркологическую помощь прямо на дому, обеспечивая полную конфиденциальность и безопасность пациента. Наши специалисты оперативно выезжают по адресу, проводят все необходимые процедуры и помогают максимально быстро стабилизировать состояние пациента в комфортных домашних условиях.
Узнать больше – http://narcolog-na-dom-sankt-peterburg0.ru/narkolog-na-dom-czena-spb/
Поддержка — ключевой элемент на пути к выздоровлению. Мы предлагаем программы, которые продолжаются даже после завершения основного курса лечения. Пациенты имеют возможность участвовать в регулярных встречах с психологами и наркологами, где они могут делиться своими успехами и получать необходимую помощь.
Получить дополнительную информацию – врача капельницу от запоя иркутск
«ВоронежДоктор» сочетает в себе профессионализм, современное оборудование и заботу о приватности пациента. Ключевые преимущества:
Разобраться лучше – https://kapelnica-ot-zapoya-voronezh2.ru/kapelnicza-ot-zapoya-czena-v-voronezhe
Клиника “Обновление” также активно занимается просветительской деятельностью. Мы организуем семинары и лекции, которые помогают обществу лучше понять проблемы зависимостей, их последствия и пути решения. Повышение осведомленности является важным шагом на пути к улучшению ситуации в этой области.
Углубиться в тему – http://kapelnica-ot-zapoya-irkutsk.ru/kapelnica-ot-zapoya-v-kruglosutochno-v-irkutske/
Вызывать нарколога на дом рекомендуется при следующих состояниях:
Разобраться лучше – https://narcolog-na-dom-sankt-peterburg000.ru/narkolog-na-dom-czena-spb
Наши специалисты выезжают в любой район Москвы и ближайшего Подмосковья, чтобы помочь пациентам избежать осложнений и быстро прийти в норму после длительного запоя.
Получить дополнительные сведения – капельница от запоя вызов
Затяжной запой опасен для жизни. Врачи наркологической клиники в Химках проводят срочный вывод из запоя — на дому или в стационаре. Анонимно, безопасно, круглосуточно.
Выяснить больше – вывод из запоя анонимно
Алкогольная и наркотическая зависимость требуют незамедлительного и комплексного вмешательства для предотвращения серьезных осложнений и сохранения здоровья пациента. В Уфе, Республика Башкортостан, опытные наркологи выезжают на дом 24 часа в сутки, предоставляя оперативную помощь при запоях и в случаях наркотической интоксикации. Такой формат лечения позволяет начать детоксикацию в комфортной, привычной обстановке, обеспечивая максимальную конфиденциальность и индивидуальный подход к каждому пациенту.
Подробнее тут – http://narcolog-na-dom-ufa000.ru
Нельзя игнорировать первые признаки серьёзного алкогольного отравления: промедление повышает риск судорожных припадков, остановки дыхания и комы. Нарколог на дом в Реутове рекомендован при следующих симптомах:
Получить дополнительную информацию – https://vyvod-iz-zapoya-reutov4.ru/vyvod-iz-zapoya-stacionar-v-reutove
Пациенты выбирают нашу клинику для срочного вызова врача-нарколога благодаря следующим важным преимуществам:
Узнать больше – нарколог на дом цена в новосибирске
Запой – это опасная стадия! В Волгоградской области нарколог поможет круглосуточно! Мы всегда на связи, чтобы помочь вам справиться с запоем. Мы предлагаем быстрое, безопасное и индивидуальное лечение. Наша служба вывода из запоя работает четко и без сбоев. Мы предлагаем детоксикацию и стабилизацию состояния в любом месте. Мы начинаем с диагностики, чтобы понять, как лучше вам помочь.
Исследовать вопрос подробнее – вывод из запоя дешево волгоград
Теряете контроль над алкоголем? Экстренная помощь нарколога на дому в Волгограде – это выход! Лечитесь дома! Это быстро, удобно, анонимно и эффективно. Быстрая детоксикация – первый шаг к выздоровлению! Мы работаем 24/7, чтобы вы могли получить помощь в любой ситуации. Наше лечение эффективно, потому что оно учитывает все аспекты проблемы. Сначала нужно очистить организм от алкоголя, и мы вам в этом поможем.
Углубиться в тему – вывод из запоя дешево волгоград
Каждый день запоя увеличивает риск для жизни. Не рискуйте — специалисты в Химках приедут на дом и окажут экстренную помощь. Без боли, стресса и ожидания.
Изучить вопрос глубже – вывод из запоя на дому город химки
Миссия клиники “Обновление” заключается в предоставлении качественной и всесторонней помощи людям, страдающим от различных форм зависимости. Мы понимаем, что успешное лечение невозможно без индивидуального подхода, поэтому каждый пациент проходит детальную диагностику, после которой разрабатывается персонализированный план терапии. В процессе работы мы акцентируем внимание на следующих аспектах:
Изучить вопрос глубже – капельница от запоя на дому иркутская область
При запое организм теряет контроль над употреблением алкоголя. В Волгограде вызов нарколога на дом поможет быстро стабилизировать состояние. На дому можно получить квалифицированную помощь, провести детоксикацию и сохранить анонимность. Не затягивайте с вызовом нарколога, чтобы избежать необратимых последствий для организма. Вывод токсинов, восстановление баланса и нормализация работы организма – задачи нарколога на дому. Медикаменты и психология – основа лечения запоя на дому. Детоксикация – первый этап лечения, который проводится с помощью современных препаратов.
Углубиться в тему – вывод из запоя волгоград
Проблема зависимости от алкоголя, наркотиков и азартных игр остается одной из наиболее острых в современном обществе. Эти состояния оказывают значительное воздействие не только на здоровье самого человека, но и на его семью, друзей и общественные связи. Наркологическая клиника “Восстановление души” предлагает широкий спектр услуг для тех, кто борется с различными формами зависимости, такими как алкоголизм, наркомания и игромания. Наша цель — предоставить комплексный подход к лечению, что обеспечивает высокие показатели успешности среди наших пациентов.
Детальнее – капельница от запоя клиника в иркутске
Запой – это не просто временное ухудшение самочувствия, а состояние, при котором организм подвергается значительному токсическому воздействию алкоголя. Длительное злоупотребление приводит к накоплению вредных веществ, что может вызвать:
Узнать больше – vyzvat-narkologa-na-dom rjazan’
Наши специалисты применяют только сертифицированные и проверенные препараты. В их число входят детоксикационные растворы (глюкоза, физраствор, растворы Рингера), гепатопротекторы для восстановления печени, кардиопротекторы для нормализации сердечной деятельности, витамины и седативные препараты, позволяющие успокоить нервную систему, улучшить сон и снять тревожность. Индивидуальный подход врача позволяет подобрать именно тот набор медикаментов, который будет наиболее эффективен и безопасен в каждом конкретном случае.
Ознакомиться с деталями – http://narcolog-na-dom-sankt-peterburg0.ru
Публикация предлагает уникальную подборку информации, которая будет интересна как специалистам, так и широкому кругу читателей. Здесь вы найдете ответы на часто задаваемые вопросы и полезные инсайты для дальнейшего применения.
Посмотреть подробности – https://baanrista.nl/gallery-post-format
В нашей клинике используются только эффективные и безопасные препараты, что гарантирует вам быстрое восстановление и минимальные риски.
Подробнее – после капельницы от запоя в иркутске
В этой информационной статье вы найдете интересное содержание, которое поможет вам расширить свои знания. Мы предлагаем увлекательный подход и уникальные взгляды на обсуждаемые темы, побуждая пользователей к активному мышлению и критическому анализу.
Нажми и узнай всё – https://gophership.ru
Этот метод направлен на выявление и замену негативных мыслей и стереотипов поведения, связанных с потреблением алкоголя. Пациент учится отслеживать свои эмоциональные реакции и заменять деструктивные установки конструктивными стратегиями противостояния стрессу.
Выяснить больше – http://lechenie-alkogolizma-sochi0.ru
Психотерапия является неотъемлемой частью лечения, позволяя работать с психологическими причинами зависимости. В клинике применяются различные методы, включая когнитивно-поведенческую терапию, мотивационное интервью и групповую терапию. Это позволяет повысить мотивацию к выздоровлению и сформировать навыки, необходимые для жизни без наркотиков и алкоголя.
Получить больше информации – https://narkologicheskaya-klinika-krasnodar0.ru/anonimnaya-narkologicheskaya-klinika-v-krasnodare/
Наркологическая клиника в Краснодаре представляет собой специализированное медицинское учреждение, где оказывается профессиональная помощь пациентам с различными формами зависимости. Современные подходы к лечению позволяют обеспечить эффективную и безопасную терапию, направленную на восстановление физического и психического здоровья.
Выяснить больше – http://narkologicheskaya-klinika-krasnodar00.ru
«СочиМед» предлагает комплексный подход: диагностика, детоксикация, терапия сопутствующих состояний, психологическая и социальная поддержка. В стационаре доступны:
Узнать больше – бесплатная наркологическая клиника в сочи
Этот информативный текст выделяется своими захватывающими аспектами, которые делают сложные темы доступными и понятными. Мы стремимся предложить читателям глубину знаний вместе с разнообразием интересных фактов. Откройте новые горизонты и развивайте свои способности познавать мир!
Подробнее – https://moustfaahmed.com
В медицинской практике применяются разнообразные методы, позволяющие эффективно бороться с зависимостью. К ним относятся медикаментозная терапия, психотерапия, социальная реабилитация и физиотерапевтические процедуры. Медикаментозное лечение помогает снять острые симптомы интоксикации и предотвратить развитие осложнений, что подтверждают данные исследований на Национальном медицинском портале.
Узнать больше – анонимное лечение алкоголизма
Основной этап, направленный на очищение организма от продуктов распада алкоголя и нормализацию функций внутренних органов. Применяются современные препараты с антиоксидантным и гепатопротекторным эффектом.
Углубиться в тему – наркология лечение алкоголизма
Наши врачи уделяют внимание не только медицинским аспектам, но также социальным и психологическим факторам. Мы помогаем пациентам находить новый смысл в жизни, формировать новые увлечения и восстанавливать старые связи с близкими.
Подробнее тут – http://kapelnica-ot-zapoya-irkutsk.ru/kapelnica-ot-zapoya-anonimno-v-irkutske/
Кроме того, наличие медицинской базы с возможностью круглосуточного мониторинга состояния пациента является дополнительным преимуществом. Это особенно важно на этапе детоксикации, когда организм испытывает серьезные нагрузки.
Подробнее тут – https://lechenie-narkomanii-yaroslavl0.ru/lechenie-khronicheskogo-alkogolizma-yaroslavl
Основные задачи
Подробнее тут – лечение алкоголизма на дому
Клиника «НаркоМед» в Екатеринбурге предоставляет полный спектр наркологической помощи круглосуточно и анонимно. Благодаря мобильным бригадам и выездам на дом, пациенты получают профессиональное лечение прямо в комфортной обстановке, без стресса, связанного с госпитализацией. В статье подробно рассматриваются услуги клиники, этапы терапии и ключевые преимущества обращения в «НаркоМед».
Изучить вопрос глубже – https://narkologicheskaya-klinika-ekaterinburg0.ru/chastnaya-narkologicheskaya-klinika-v-ekb
Перед заключением договора стоит поинтересоваться:
Ознакомиться с деталями – https://narkologicheskaya-klinika-nizhnij-tagil11.ru/narkologicheskaya-klinika-telefon-v-nizhnem-tagile/
Эта публикация завернет вас в вихрь увлекательного контента, сбрасывая стереотипы и открывая двери к новым идеям. Каждый абзац станет для вас открытием, полным ярких примеров и впечатляющих достижений. Подготовьтесь быть вовлеченными и удивленными каждый раз, когда продолжите читать.
Узнай первым! – https://1001doska.ru
Мы предлагаем вам подробное руководство, основанное на проверенных источниках и реальных примерах. Каждая часть публикации направлена на то, чтобы помочь вам разобраться в сложных вопросах и применить знания на практике.
Ознакомьтесь с аналитикой – https://banskonews.com/atanas-ianchovichin-e-buditel-na-godinata-v-bansko
Проблема зависимости — это многогранная ситуация, которая требует комплексного подхода. Мы не ограничиваемся лишь лечением симптомов, а стремимся вернуть пациента к нормальной жизни. В клинике “Сила воли” используется индивидуальный подход к каждому пациенту, включающий как медицинские, так и психологические методы, направленные на полный восстановительный процесс. Одним из самых эффективных методов лечения при алкогольной зависимости является капельница от запоя — процедура, которая помогает снизить уровень токсинов в организме и нормализовать физическое состояние пациента.
Подробнее – http://kapelnica-ot-zapoya-irkutsk3.ru/kapelnica-ot-zapoya-v-kruglosutochno-v-irkutske/
Дополнительно выясняются аллергические реакции, приём других препаратов и предпочтения пациента по времени визита врача.
Ознакомиться с деталями – капельница от запоя клиника воронеж
Проблема зависимости от алкоголя, наркотиков и азартных игр остается одной из наиболее острых в современном обществе. Эти состояния оказывают значительное воздействие не только на здоровье самого человека, но и на его семью, друзей и общественные связи. Наркологическая клиника “Восстановление души” предлагает широкий спектр услуг для тех, кто борется с различными формами зависимости, такими как алкоголизм, наркомания и игромания. Наша цель — предоставить комплексный подход к лечению, что обеспечивает высокие показатели успешности среди наших пациентов.
Разобраться лучше – капельница от запоя на дому
При длительном запое в крови накапливаются ацетальдегид и другие токсичные метаболиты этанола, которые повреждают клетки печени, нарушают функцию почек и приводят к дисбалансу электролитов. Без своевременной детоксикации повышается риск острых состояний — судорог, инсультов, инфаркта, панкреатита и психоза. Чем раньше начато лечение, тем быстрее нормализуются показатели обмена веществ, возвращается водно-электролитный баланс и восстанавливается работа жизненно важных органов. Анонимный выезд нарколога помогает снять психологический барьер перед обращением за помощью.
Получить дополнительные сведения – капельница от запоя на дому в воронеже
Клиника “Обновление” также активно занимается просветительской деятельностью. Мы организуем семинары и лекции, которые помогают обществу лучше понять проблемы зависимостей, их последствия и пути решения. Повышение осведомленности является важным шагом на пути к улучшению ситуации в этой области.
Подробнее тут – http://kapelnica-ot-zapoya-irkutsk.ru
Когда запой становится критическим, оперативное вмешательство имеет решающее значение для спасения здоровья и предотвращения необратимых последствий. Во Владимире экстренная помощь нарколога на дому позволяет быстро начать лечение, не требуя госпитализации, что особенно важно для пациентов, нуждающихся в сохранении конфиденциальности и комфорте.
Изучить вопрос глубже – http://
Специалист выясняет, как долго продолжается запой, какие симптомы наблюдаются, а также наличие сопутствующих заболеваний. Эти данные позволяют сформировать индивидуальный план лечения и выбрать оптимальные методы детоксикации.
Исследовать вопрос подробнее – https://vyvod-iz-zapoya-vladimir0.ru
Лечение в наркологической клинике в Краснодаре строится на комплексном подходе, включающем медикаментозную терапию, психотерапевтическую помощь и социальную реабилитацию. Медикаментозное лечение направлено на детоксикацию организма и снижение симптомов абстиненции, что позволяет значительно улучшить состояние пациента в первые дни терапии. Современные препараты, применяемые в лечении зависимости, сертифицированы и соответствуют международным стандартам, что подтверждается на сайте Всемирной организации здравоохранения.
Углубиться в тему – https://narkologicheskaya-klinika-krasnodar0.ru/chastnaya-narkologicheskaya-klinika-v-krasnodare/
Этот метод направлен на выявление и замену негативных мыслей и стереотипов поведения, связанных с потреблением алкоголя. Пациент учится отслеживать свои эмоциональные реакции и заменять деструктивные установки конструктивными стратегиями противостояния стрессу.
Получить дополнительные сведения – lechenie alkogolizma sochi
Строго регламентированный алгоритм позволяет специалистам «ВоронежДоктор» добиваться устойчивых результатов при выводе из запоя.
Разобраться лучше – https://kapelnica-ot-zapoya-voronezh2.ru/vyezd-na-dom-kapelnicza-ot-zapoya-v-voronezhe/
Наши специалисты используют проверенные медикаменты, которые подбираются индивидуально для каждого пациента:
Детальнее – нарколог на дом клиника
Кроме стационара, клиника обеспечивает выезд нарколога на дом в любое время суток. Это позволяет оперативно начать детоксикацию и стабилизацию состояния, не дожидаясь свободного места в клинике или оформления госпитализации. Высокая мобильность специалистов и оснащённость автомобиля всем необходимым оборудованием гарантируют качественную помощь прямо на дому.
Получить дополнительную информацию – http://narkologicheskaya-klinika-sochi00.ru/narkologicheskaya-klinika-vyvod-iz-zapoya-sochi/
Наркологическая клиника в Краснодаре представляет собой специализированное медицинское учреждение, где оказывается профессиональная помощь пациентам с различными формами зависимости. Современные подходы к лечению позволяют обеспечить эффективную и безопасную терапию, направленную на восстановление физического и психического здоровья.
Получить дополнительные сведения – наркологическая клиника
Важным этапом лечения является детоксикация организма, которая направлена на выведение токсинов и нормализацию работы внутренних органов. Применение препаратов, таких как антабус и налтрексон, доказало свою эффективность в профилактике срывов, что подтверждают клинические исследования на Клиническом портале.
Изучить вопрос глубже – http://lechenie-alkogolizma-sochi00.ru/
«НаркоМед» основана группой узкопрофильных специалистов, чей опыт насчитывает более 15 лет в лечении зависимости. Клиника работает круглосуточно — вы можете рассчитывать на оперативное реагирование в любой час дня и ночи. Анонимность пациентов сохраняется на уровне медицинской тайны: персональные данные и диагноз не разглашаются.
Исследовать вопрос подробнее – http://narkologicheskaya-klinika-ekaterinburg0.ru
Психотерапия в лечении алкоголизма играет важнейшую роль. Используются когнитивно-поведенческие техники, групповые занятия, а также индивидуальные консультации с психологами и психотерапевтами. Применение методов мотивационного интервьюирования способствует формированию устойчивой мотивации на трезвость, что подробно описано в исследованиях Американской психиатрической ассоциации. Также актуальную информацию можно найти на портале Психологической ассоциации России.
Исследовать вопрос подробнее – http://lechenie-alkogolizma-krasnodar00.ru
Основной этап, направленный на очищение организма от продуктов распада алкоголя и нормализацию функций внутренних органов. Применяются современные препараты с антиоксидантным и гепатопротекторным эффектом.
Получить дополнительные сведения – https://lechenie-alkogolizma-krasnodar0.ru/lechenie-alkogolizma-anonimno-krasnodar/
Наши врачи уделяют внимание не только медицинским аспектам, но также социальным и психологическим факторам. Мы помогаем пациентам находить новый смысл в жизни, формировать новые увлечения и восстанавливать старые связи с близкими.
Подробнее можно узнать тут – врача капельницу от запоя в иркутске
Когда запой становится критическим, оперативное вмешательство имеет решающее значение для спасения здоровья и предотвращения необратимых последствий. Во Владимире экстренная помощь нарколога на дому позволяет быстро начать лечение, не требуя госпитализации, что особенно важно для пациентов, нуждающихся в сохранении конфиденциальности и комфорте.
Детальнее – вывод из запоя владимир
После поступления звонка нарколог оперативно выезжает по указанному адресу и прибывает в течение 30–60 минут. Врач незамедлительно приступает к оказанию помощи по четко отработанному алгоритму, состоящему из следующих этапов:
Изучить вопрос глубже – нарколог на дом вывод в воронеже
Современное общество сталкивается с множеством вызовов, связанных с различными зависимостями, которые наносят серьезный урон как физическому, так и психоэмоциональному состоянию человека. Алкоголизм, наркомания и другие виды зависимости не только нарушают здоровье, но и разрушают личные отношения, затрудняют трудовую деятельность и социальную адаптацию. В наркологической клинике “Сила воли” в Иркутске мы предлагаем профессиональную помощь в лечении зависимости и проведении реабилитационных мероприятий, направленных на восстановление здоровья и социальной интеграции пациентов.
Изучить вопрос глубже – капельница от запоя анонимно в иркутске
Первое, на что стоит обратить внимание — это профессиональный уровень сотрудников. Без квалифицированных наркологов, клинических психологов и психиатров реабилитационный процесс становится формальным и неэффективным.
Получить дополнительные сведения – https://narkologicheskaya-klinika-nizhnij-tagil11.ru/platnaya-narkologicheskaya-klinika-v-nizhnem-tagile
Системы автоматизированного дозирования обеспечивают точное введение медикаментов, что минимизирует риск побочных эффектов. Постоянный мониторинг жизненно важных показателей позволяет врачу корректировать терапию в режиме реального времени, гарантируя безопасность процедуры.
Подробнее можно узнать тут – клиника вывод из запоя владимир
После завершения основного курса лечения в наркологической клинике в Краснодаре пациентам предлагаются программы социальной реабилитации. Они направлены на восстановление социальных навыков, адаптацию в обществе и предотвращение рецидивов. Ключевым элементом здесь является поддержка со стороны профессиональных социальных работников и участие в группах взаимопомощи.
Углубиться в тему – http://narkologicheskaya-klinika-krasnodar0.ru/
Услуга выезда направлена на первичное стабилизирующее лечение при запое или наркотической интоксикации без необходимости госпитализации. Вызов выполняется в пределах города и пригорода максимум за 60 минут.
Исследовать вопрос подробнее – наркологическая клиника на дом
Этот метод направлен на выявление и замену негативных мыслей и стереотипов поведения, связанных с потреблением алкоголя. Пациент учится отслеживать свои эмоциональные реакции и заменять деструктивные установки конструктивными стратегиями противостояния стрессу.
Подробнее – клиника лечения алкоголизма в сочи
Клиника “Обновление” также активно занимается просветительской деятельностью. Мы организуем семинары и лекции, которые помогают обществу лучше понять проблемы зависимостей, их последствия и пути решения. Повышение осведомленности является важным шагом на пути к улучшению ситуации в этой области.
Узнать больше – капельница от запоя на дому
«НаркоМед» основана группой узкопрофильных специалистов, чей опыт насчитывает более 15 лет в лечении зависимости. Клиника работает круглосуточно — вы можете рассчитывать на оперативное реагирование в любой час дня и ночи. Анонимность пациентов сохраняется на уровне медицинской тайны: персональные данные и диагноз не разглашаются.
Углубиться в тему – http://narkologicheskaya-klinika-ekaterinburg0.ru
Алкогольная и наркотическая зависимости могут привести к тяжелым и опасным для жизни состояниям. Вызов нарколога становится необходимым, если:
Детальнее – https://narcolog-na-dom-voronezh0.ru/vyzov-narkologa-na-dom-voronezh
Наркологическая клиника гарантирует конфиденциальность и анонимность всех процедур. Пациенты могут обратиться за помощью без страха за сохранность личных данных. Важной составляющей является круглосуточная поддержка и возможность вызова нарколога на дом, что особенно актуально при острых состояниях. Дополнительные сведения по вопросам анонимности лечения доступны на официальных ресурсах Федеральной службы по надзору в сфере здравоохранения.
Узнать больше – частная наркологическая клиника в краснодаре
В медицинской практике применяются разнообразные методы, позволяющие эффективно бороться с зависимостью. К ним относятся медикаментозная терапия, психотерапия, социальная реабилитация и физиотерапевтические процедуры. Медикаментозное лечение помогает снять острые симптомы интоксикации и предотвратить развитие осложнений, что подтверждают данные исследований на Национальном медицинском портале.
Узнать больше – центр лечения алкоголизма сочи
Перед оформлением вызова проводится предварительная телефонная консультация, позволяющая оценить тяжесть состояния и заранее подготовить необходимые препараты.
Получить больше информации – https://kapelnica-ot-zapoya-voronezh.ru/vyezd-na-dom-kapelnicza-ot-zapoya-v-voronezhe/
Ключевым этапом является снятие интоксикации и устранение абстинентного синдрома. Применяются препараты, направленные на нормализацию работы внутренних органов и поддержание общего состояния здоровья. Медикаментозная терапия включает назначение антидепрессантов, препаратов, блокирующих тягу к алкоголю, что подтверждается исследованиями, опубликованными на научном портале PubMed. Актуальные рекомендации по медикаментозному лечению алкоголизма доступны на Национальном центре здоровья.
Узнать больше – https://lechenie-alkogolizma-krasnodar00.ru
Миссия нашей клиники заключается в оказании высококачественной помощи людям, страдающим от зависимостей. Мы стремимся создать безопасное и поддерживающее пространство для лечения, где каждый пациент получает необходимую поддержку и понимание. Наша задача — не только помочь избавиться от зависимости, но и вернуть полноценную жизнедеятельность человека, восстановив его социальные связи и жизненные ориентиры.
Подробнее тут – https://kapelnica-ot-zapoya-irkutsk2.ru/kapelnica-ot-zapoya-cena-v-irkutske/
Использование автоматизированных систем дозирования обеспечивает точное введение лекарственных средств, что минимизирует риск передозировки и побочных эффектов. Постоянный мониторинг жизненно важных показателей позволяет врачу оперативно корректировать дозировки и адаптировать терапию под динамику состояния пациента.
Детальнее – http://vyvod-iz-zapoya-vladimir000.ru/
Запой — это серьёзное состояние, при котором организм страдает от накопления токсинов, обезвоживания и нарушения обмена веществ. Клиника «ВоронежЛайф» предлагает услугу выездного инфузионного лечения от запоя с возможностью круглосуточного реагирования. Благодаря персонализированному подходу и использованию современных автоматизированных систем дозирования, наши специалисты обеспечивают безопасную и эффективную детоксикацию в условиях домашнего уюта.
Получить дополнительные сведения – http://kapelnica-ot-zapoya-voronezh3.ru
Каждый пациент уникален — именно поэтому мы не применяем «типовых» решений. После первичной консультации и диагностики специалисты «КубаньМед» разрабатывают персональную программу, учитывающую состояние здоровья, психологические особенности и социальные обстоятельства пациента.
Получить дополнительную информацию – https://lechenie-alkogolizma-krasnodar0.ru/lechenie-alkogolizma-anonimno-krasnodar/
Миссия клиники “Обновление” заключается в предоставлении качественной и всесторонней помощи людям, страдающим от различных форм зависимости. Мы понимаем, что успешное лечение невозможно без индивидуального подхода, поэтому каждый пациент проходит детальную диагностику, после которой разрабатывается персонализированный план терапии. В процессе работы мы акцентируем внимание на следующих аспектах:
Подробнее можно узнать тут – капельница от запоя цена иркутская область
В нашей клинике “Сила воли” в Иркутске вы можете получить помощь как в стационаре, так и на дому. Мы предлагаем два вида услуг:
Ознакомиться с деталями – капельница от запоя цена иркутск
Специалист выясняет, как долго продолжается запой, какие симптомы наблюдаются, а также наличие сопутствующих заболеваний. Эти данные позволяют сформировать индивидуальный план лечения и выбрать оптимальные методы детоксикации.
Получить больше информации – вывод из запоя цена владимир
Для начала комплексного лечения в наркологической клинике в Краснодаре проводится тщательная диагностика состояния пациента. Врач-нарколог назначает необходимые лабораторные и инструментальные исследования, среди которых общий анализ крови, биохимический анализ, ЭКГ, УЗИ внутренних органов, а также психодиагностические тесты. Такой комплексный подход позволяет выявить сопутствующие заболевания и оценить степень зависимости, что важно для выбора оптимальной терапии.
Узнать больше – http://narkologicheskaya-klinika-krasnodar0.ru
Острая алкогольная интоксикация — запой — может привести к серьёзным осложнениям: дегидратации, сбою сердечного ритма, ухудшению функций печени и почек. Клиника «ВоронежДоктор» предлагает инфузионную терапию на дому и в условиях стационара с полным соблюдением анонимности. Опытные специалисты проводят детоксикацию по индивидуальной программе, используя современные растворы и аппаратуру, что позволяет максимально быстро и безопасно вернуть пациента к нормальной жизни.
Выяснить больше – капельница от запоя вызов
Первое, на что стоит обратить внимание — это профессиональный уровень сотрудников. Без квалифицированных наркологов, клинических психологов и психиатров реабилитационный процесс становится формальным и неэффективным.
Подробнее тут – http://narkologicheskaya-klinika-nizhnij-tagil11.ru/platnaya-narkologicheskaya-klinika-v-nizhnem-tagile/
Совместные занятия с другими пациентами создают атмосферу поддержки и понимания. Под руководством психотерапевта участники группы делятся опытом, обсуждают сложные ситуации и находят оптимальные способы удержаться от срыва.
Исследовать вопрос подробнее – центр лечения алкоголизма сочи
Выезд на дом включает: первичный осмотр, необходимые анализы на месте, подготовку и введение инфузионных смесей, мониторинг динамики, а также рекомендации по дальнейшему лечению.
Узнать больше – http://narkologicheskaya-klinika-sochi00.ru
Когда запой становится критическим, оперативное вмешательство имеет решающее значение для спасения здоровья и предотвращения необратимых последствий. Во Владимире экстренная помощь нарколога на дому позволяет быстро начать лечение, не требуя госпитализации, что особенно важно для пациентов, нуждающихся в сохранении конфиденциальности и комфорте.
Узнать больше – вывод из запоя дешево владимир
Выездной формат позволяет избежать контактов с другими пациентами в клинике и очистить организм в привычной обстановке. Специалисты самостоятельно привозят весь необходимый набор медикаментов и расходных материалов.
Разобраться лучше – http://www.domen.ru
Метод лечения
Получить дополнительные сведения – narkologicheskaya klinika krasnodar
Согласно статье, опубликованной в Журнале клинической медицины, комплексный подход снижает вероятность рецидива и способствует длительной ремиссии.
Выяснить больше – анонимное лечение алкоголизма
В таких случаях своевременное обращение за помощью позволяет быстро стабилизировать состояние и предотвратить развитие серьезных осложнений.
Узнать больше – http://narcolog-na-dom-voronezh0.ru
Миссия клиники “Обновление” заключается в предоставлении качественной и всесторонней помощи людям, страдающим от различных форм зависимости. Мы понимаем, что успешное лечение невозможно без индивидуального подхода, поэтому каждый пациент проходит детальную диагностику, после которой разрабатывается персонализированный план терапии. В процессе работы мы акцентируем внимание на следующих аспектах:
Получить больше информации – http://kapelnica-ot-zapoya-irkutsk.ru/kapelnica-ot-zapoya-anonimno-v-irkutske/
Лечение алкоголизма в Краснодаре представляет собой комплекс мероприятий, направленных на полное восстановление физического и психологического состояния пациента. Этот процесс требует профессионального подхода, включающего диагностику, детоксикацию, терапию зависимости и реабилитацию. Информация о современных методах терапии доступна на официальном портале Минздрава РФ.
Ознакомиться с деталями – https://lechenie-alkogolizma-krasnodar00.ru/lechenie-alkogolizma-anonimno-krasnodar/
При длительном запое в крови накапливаются ацетальдегид и другие токсичные метаболиты этанола, которые повреждают клетки печени, нарушают функцию почек и приводят к дисбалансу электролитов. Без своевременной детоксикации повышается риск острых состояний — судорог, инсультов, инфаркта, панкреатита и психоза. Чем раньше начато лечение, тем быстрее нормализуются показатели обмена веществ, возвращается водно-электролитный баланс и восстанавливается работа жизненно важных органов. Анонимный выезд нарколога помогает снять психологический барьер перед обращением за помощью.
Подробнее можно узнать тут – вызвать капельницу от запоя воронеж
Каждый пациент уникален — именно поэтому мы не применяем «типовых» решений. После первичной консультации и диагностики специалисты «КубаньМед» разрабатывают персональную программу, учитывающую состояние здоровья, психологические особенности и социальные обстоятельства пациента.
Получить дополнительные сведения – http://lechenie-alkogolizma-krasnodar0.ru/lechenie-alkogolizma-anonimno-krasnodar/
Лечение в наркологической клинике в Краснодаре строится на комплексном подходе, включающем медикаментозную терапию, психотерапевтическую помощь и социальную реабилитацию. Медикаментозное лечение направлено на детоксикацию организма и снижение симптомов абстиненции, что позволяет значительно улучшить состояние пациента в первые дни терапии. Современные препараты, применяемые в лечении зависимости, сертифицированы и соответствуют международным стандартам, что подтверждается на сайте Всемирной организации здравоохранения.
Подробнее тут – частная наркологическая клиника в краснодаре
Специалист выясняет, как долго продолжается запой, какие симптомы наблюдаются, а также наличие сопутствующих заболеваний. Эти данные позволяют сформировать индивидуальный план лечения и выбрать оптимальные методы детоксикации.
Изучить вопрос глубже – вывод из запоя цена владимир
Использование автоматизированных систем дозирования обеспечивает точное введение лекарственных средств, что минимизирует риск передозировки и побочных эффектов. Постоянный мониторинг жизненно важных показателей позволяет врачу оперативно корректировать дозировки и адаптировать терапию под динамику состояния пациента.
Разобраться лучше – вывод из запоя дешево владимир
Мы понимаем, что лечение от алкогольной зависимости — это только первый шаг на пути к восстановлению. Профилактика рецидивов — важная часть нашего подхода. Мы проводим тренинги и курсы, направленные на развитие навыков борьбы с соблазнами и стрессом. Психотерапевтическая поддержка помогает пациентам справиться с эмоциональными трудностями, а также укрепляет мотивацию для сохранения трезвости.
Детальнее – поставить капельницу от запоя иркутск
В этих случаях вызов нарколога на дом не только оправдан, но и жизненно необходим для предотвращения опасных осложнений и стабилизации здоровья пациента.
Подробнее можно узнать тут – нарколог на дом клиника
Поддержка — ключевой элемент на пути к выздоровлению. Мы предлагаем программы, которые продолжаются даже после завершения основного курса лечения. Пациенты имеют возможность участвовать в регулярных встречах с психологами и наркологами, где они могут делиться своими успехами и получать необходимую помощь.
Ознакомиться с деталями – http://kapelnica-ot-zapoya-irkutsk2.ru
Клиника “Обновление” также активно занимается просветительской деятельностью. Мы организуем семинары и лекции, которые помогают обществу лучше понять проблемы зависимостей, их последствия и пути решения. Повышение осведомленности является важным шагом на пути к улучшению ситуации в этой области.
Изучить вопрос глубже – https://kapelnica-ot-zapoya-irkutsk.ru/kapelnica-ot-zapoya-v-stacionare-v-irkutske
Запой — это серьёзное состояние, при котором организм страдает от накопления токсинов, обезвоживания и нарушения обмена веществ. Клиника «ВоронежЛайф» предлагает услугу выездного инфузионного лечения от запоя с возможностью круглосуточного реагирования. Благодаря персонализированному подходу и использованию современных автоматизированных систем дозирования, наши специалисты обеспечивают безопасную и эффективную детоксикацию в условиях домашнего уюта.
Углубиться в тему – капельница от запоя цена воронеж
Выездной формат позволяет избежать контактов с другими пациентами в клинике и очистить организм в привычной обстановке. Специалисты самостоятельно привозят весь необходимый набор медикаментов и расходных материалов.
Детальнее – https://narkologicheskaya-klinika-ekaterinburg0.ru/narkologicheskaya-klinika-otzyvy-v-ekb
Совместные занятия с другими пациентами создают атмосферу поддержки и понимания. Под руководством психотерапевта участники группы делятся опытом, обсуждают сложные ситуации и находят оптимальные способы удержаться от срыва.
Детальнее – лечение алкоголизма
«СочиМед» предлагает комплексный подход: диагностика, детоксикация, терапия сопутствующих состояний, психологическая и социальная поддержка. В стационаре доступны:
Получить больше информации – наркологическая клиника цены сочи
Особенно важно на этапе поступления пройти полную психодиагностику и получить адаптированную под конкретного пациента программу. Это позволит учитывать возможные сопутствующие расстройства, включая тревожные, аффективные и когнитивные нарушения.
Подробнее тут – наркологические клиники алкоголизм нижний тагил
Применение современных средств медикаментозного лечения обеспечивает безопасность процедуры и минимизирует риски осложнений.
Выяснить больше – http://lechenie-alkogolizma-sochi00.ru/lechenie-alkogolizma-na-domu/
В клинике применяются инновационные методы диагностики, включая лабораторные анализы и аппаратные исследования, которые позволяют выявить степень зависимости и сопутствующие патологии. Важным этапом является комплексный подход к лечению, включающий детоксикацию организма, психотерапию и медикаментозную поддержку.
Получить дополнительную информацию – http://narkologicheskaya-klinika-krasnodar00.ru/platnaya-narkologicheskaya-klinika-krasnodar/https://narkologicheskaya-klinika-krasnodar00.ru
Этап лечения
Подробнее можно узнать тут – https://lechenie-alkogolizma-krasnodar00.ru/klinika-lecheniya-alkogolizma-krasnodar
После вашего звонка нарколог выезжает на дом в течение 30–60 минут. Прибыв на место, специалист проводит всесторонний медицинский осмотр, включая измерение артериального давления, пульса и уровня кислорода в крови, а также собирает анамнез для определения степени интоксикации.
Выяснить больше – вызвать нарколога на дом воронеж
Незамедлительно после вызова нарколог прибывает на дом для проведения тщательного осмотра. На данном этапе специалист собирает анамнез, измеряет жизненно важные показатели — пульс, артериальное давление, температуру — и оценивает степень интоксикации. Эти данные являются основой для составления индивидуального плана лечения.
Разобраться лучше – вывод из запоя в владимире
В-третьих, поддержка является критически важным компонентом на пути к выздоровлению. Мы предлагаем программы, которые продолжаются даже после завершения основного курса лечения. Пациенты имеют возможность участвовать в регулярных встречах, где они могут делиться своими успехами и получать помощь от специалистов.
Подробнее тут – http://kapelnica-ot-zapoya-irkutsk.ru/
Лечение в наркологической клинике в Краснодаре строится на комплексном подходе, включающем медикаментозную терапию, психотерапевтическую помощь и социальную реабилитацию. Медикаментозное лечение направлено на детоксикацию организма и снижение симптомов абстиненции, что позволяет значительно улучшить состояние пациента в первые дни терапии. Современные препараты, применяемые в лечении зависимости, сертифицированы и соответствуют международным стандартам, что подтверждается на сайте Всемирной организации здравоохранения.
Детальнее – http://narkologicheskaya-klinika-krasnodar0.ru
Запой характеризуется накоплением токсинов и ухудшением работы внутренних органов. Чем дольше продолжается состояние интоксикации, тем выше риск серьезных осложнений. Помощь нарколога на дому позволяет начать детоксикацию в первые часы кризиса, что существенно повышает шансы на успешное восстановление и предотвращает развитие хронических заболеваний.
Узнать больше – владимир вывод из запоя
«ВоронежДоктор» сочетает в себе профессионализм, современное оборудование и заботу о приватности пациента. Ключевые преимущества:
Детальнее – капельница от запоя анонимно
Каждый пациент уникален — именно поэтому мы не применяем «типовых» решений. После первичной консультации и диагностики специалисты «КубаньМед» разрабатывают персональную программу, учитывающую состояние здоровья, психологические особенности и социальные обстоятельства пациента.
Ознакомиться с деталями – принудительное лечение от алкоголизма
В нашей клинике используются только эффективные и безопасные препараты, что гарантирует вам быстрое восстановление и минимальные риски.
Углубиться в тему – vyzvat-kapelniczu-ot-zapoya irkutsk
Перед оформлением вызова проводится предварительная телефонная консультация, позволяющая оценить тяжесть состояния и заранее подготовить необходимые препараты.
Углубиться в тему – капельница от запоя выезд воронеж
Выездной формат позволяет избежать контактов с другими пациентами в клинике и очистить организм в привычной обстановке. Специалисты самостоятельно привозят весь необходимый набор медикаментов и расходных материалов.
Получить дополнительные сведения – https://narkologicheskaya-klinika-ekaterinburg0.ru/chastnaya-narkologicheskaya-klinika-v-ekb
Наши врачи уделяют внимание не только медицинским аспектам, но также социальным и психологическим факторам. Мы помогаем пациентам находить новый смысл в жизни, формировать новые увлечения и восстанавливать старые связи с близкими.
Изучить вопрос глубже – капельница от запоя анонимно
Наркологическая клиника «СочиМед» предлагает полный спектр услуг по лечению алкогольной и наркотической зависимости, сочетая современные медицинские технологии с уютной атмосферой. Размещение в стационаре организовано по принципу гостиничного сервиса: отдельные палаты с кондиционером, круглосуточное питание по диетам, а внимательный персонал поддерживает пациентов на каждом этапе восстановления.
Изучить вопрос глубже – chastnaya narkologicheskaya klinika sochi
Незамедлительно после вызова нарколог прибывает на дом для проведения тщательного осмотра. На данном этапе специалист собирает анамнез, измеряет жизненно важные показатели — пульс, артериальное давление, температуру — и оценивает степень интоксикации. Эти данные являются основой для составления индивидуального плана лечения.
Подробнее – вывод из запоя
Совместные занятия с другими пациентами создают атмосферу поддержки и понимания. Под руководством психотерапевта участники группы делятся опытом, обсуждают сложные ситуации и находят оптимальные способы удержаться от срыва.
Получить больше информации – https://lechenie-alkogolizma-sochi0.ru/czentr-lecheniya-alkogolizma-v-sochi
Применение современных средств медикаментозного лечения обеспечивает безопасность процедуры и минимизирует риски осложнений.
Получить дополнительные сведения – http://lechenie-alkogolizma-sochi00.ru
Наркологическая клиника гарантирует конфиденциальность и анонимность всех процедур. Пациенты могут обратиться за помощью без страха за сохранность личных данных. Важной составляющей является круглосуточная поддержка и возможность вызова нарколога на дом, что особенно актуально при острых состояниях. Дополнительные сведения по вопросам анонимности лечения доступны на официальных ресурсах Федеральной службы по надзору в сфере здравоохранения.
Выяснить больше – https://narkologicheskaya-klinika-krasnodar00.ru/narkologicheskaya-klinika-anonimno-krasnodar/
Подбор учреждения для прохождения реабилитации — это ответственное решение, влияющее на весь процесс восстановления. Наркологическая помощь требует не только медикаментозного вмешательства, но и глубокой психологической проработки. Согласно информации, опубликованной на портале Минздрава РФ, эффективность терапии во многом зависит от персонализированного подхода и соблюдения стандартов оказания психиатрической помощи.
Подробнее – наркологические клиники алкоголизм свердловская область
Первым этапом лечения является медицинская детоксикация, которая направлена на удаление токсинов из организма и стабилизацию физического состояния пациента. Мы используем современные методики, которые помогают минимизировать симптомы абстиненции, такие как головная боль, тошнота и слабость, обеспечивая комфортное пребывание в клинике.
Получить дополнительную информацию – капельница от запоя иркутская область
Этап лечения
Получить больше информации – лечение алкоголизма краснодар.
В таких случаях своевременное обращение за помощью позволяет быстро стабилизировать состояние и предотвратить развитие серьезных осложнений.
Получить дополнительные сведения – narkolog-na-dom-kruglosutochno voronezh
Выезд нарколога на дом включает несколько ключевых этапов: первичный дистанционный сбор анамнеза, оперативный приезд специалиста, проведение обследования — измерение пульса, давления, сатурации, уровня глюкозы и электролитов крови — и последующее назначение инфузионной терапии. В зависимости от состояния пациента подбирается индивидуальный состав растворов, направленных на восстановление водно-электролитного баланса, поддержку функций печени и нормализацию работы центральной нервной системы. Все процедуры выполняются с учётом противопоказаний и сопутствующих заболеваний.
Изучить вопрос глубже – http://kapelnica-ot-zapoya-voronezh3.ru/kapelnicza-ot-zapoya-czena-v-voronezhe/
Сразу после вызова нарколог приезжает для проведения детального осмотра. На этом этапе производится сбор анамнеза, измеряются жизненно важные показатели – пульс, артериальное давление, температура – и оценивается степень интоксикации.
Получить дополнительную информацию – https://vyvod-iz-zapoya-vladimir0.ru/vyvod-iz-zapoya-na-domu-vladimir
Клиника “Обновление” также активно занимается просветительской деятельностью. Мы организуем семинары и лекции, которые помогают обществу лучше понять проблемы зависимостей, их последствия и пути решения. Повышение осведомленности является важным шагом на пути к улучшению ситуации в этой области.
Детальнее – http://kapelnica-ot-zapoya-irkutsk.ru/kapelnica-ot-zapoya-na-domu-v-irkutske/
Незамедлительно после вызова нарколог прибывает на дом для проведения тщательного осмотра. На данном этапе специалист собирает анамнез, измеряет жизненно важные показатели — пульс, артериальное давление, температуру — и оценивает степень интоксикации. Эти данные являются основой для составления индивидуального плана лечения.
Подробнее можно узнать тут – вывод из запоя на дому в владимире
После вызова врач клиники «ЗдравЦентр» прибывает к пациенту в течение 30–60 минут. Он проводит первичный осмотр, оценивает степень тяжести алкогольной интоксикации, измеряет пульс, давление, уровень кислорода и другие показатели здоровья. На основании этих данных составляется индивидуальный план лечения.
Разобраться лучше – https://kapelnica-ot-zapoya-moskva00.ru/kapelnicza-ot-zapoya-na-domu-msk/
После поступления вызова врач наркологической клиники «МедАльянс» прибывает на дом в течение 30–60 минут. Сначала специалист оценивает общее состояние пациента, измеряет давление, уровень кислорода в крови и уточняет детали анамнеза.
Ознакомиться с деталями – https://kapelnica-ot-zapoya-moskva000.ru/kapelnicza-ot-zapoya-na-domu-msk
Достаточно связаться по телефону или через мессенджер и сообщить минимальный набор данных — имя и адрес. Все остальные детали обсуждаются устно, без фиксации на бумаге.
Получить дополнительную информацию – chastnaya narkologicheskaya klinika ekaterinburg
Когда организм на пределе, важна срочная помощь в Люберцах — это команда опытных наркологов, которые помогут быстро и мягко выйти из запоя без вреда для здоровья.
Подробнее можно узнать тут – вызвать нарколога на дом
Наркологическая клиника «СочиМед» предлагает полный спектр услуг по лечению алкогольной и наркотической зависимости, сочетая современные медицинские технологии с уютной атмосферой. Размещение в стационаре организовано по принципу гостиничного сервиса: отдельные палаты с кондиционером, круглосуточное питание по диетам, а внимательный персонал поддерживает пациентов на каждом этапе восстановления.
Подробнее тут – http://narkologicheskaya-klinika-sochi00.ru/narkologicheskaya-klinika-vyvod-iz-zapoya-sochi/https://narkologicheskaya-klinika-sochi00.ru
Затяжной запой опасен для жизни. Врачи наркологической клиники в Люберцах проводят срочный вывод из запоя — на дому или в стационаре. Анонимно, безопасно, круглосуточно.
Изучить вопрос глубже – капельница от запоя на дому город. московская область
Каждый пациент уникален — именно поэтому мы не применяем «типовых» решений. После первичной консультации и диагностики специалисты «КубаньМед» разрабатывают персональную программу, учитывающую состояние здоровья, психологические особенности и социальные обстоятельства пациента.
Изучить вопрос глубже – лечение алкоголизма в краснодаре
Наркологическая клиника «АнтиДот» предлагает срочный вызов нарколога на дом в Воронеже и Воронежской области. Наша служба экстренной наркологической помощи доступна круглосуточно и позволяет быстро справиться с тяжелыми состояниями, вызванными алкогольной и наркотической зависимостью. Опытные врачи проведут детоксикацию организма, помогут снять абстинентный синдром и стабилизировать общее состояние пациента в комфортных домашних условиях.
Ознакомиться с деталями – нарколог на дом цена в воронеже
Мы понимаем, что лечение от алкогольной зависимости — это только первый шаг на пути к восстановлению. Профилактика рецидивов — важная часть нашего подхода. Мы проводим тренинги и курсы, направленные на развитие навыков борьбы с соблазнами и стрессом. Психотерапевтическая поддержка помогает пациентам справиться с эмоциональными трудностями, а также укрепляет мотивацию для сохранения трезвости.
Подробнее тут – https://kapelnica-ot-zapoya-irkutsk3.ru
Психоэмоциональное состояние играет ключевую роль в лечении зависимости. В «ЮгМед» психологи и психотерапевты обеспечивают сопровождение на всех этапах реабилитации, помогая пациенту справиться с тревогой, сниженной самооценкой и стрессом. Одна только медикаментозная детоксикация не гарантирует успеха — важно разобраться в причинах зависимости и выработать навыки противодействия соблазнам.
Узнать больше – центр лечения алкоголизма краснодарский край
Важным этапом лечения является детоксикация организма, которая направлена на выведение токсинов и нормализацию работы внутренних органов. Применение препаратов, таких как антабус и налтрексон, доказало свою эффективность в профилактике срывов, что подтверждают клинические исследования на Клиническом портале.
Ознакомиться с деталями – клиника лечения алкоголизма краснодарский край
Во-первых, мы фокусируемся на медицинской детоксикации, которая является первоочередной задачей при лечении зависимостей. Этот процесс позволяет удалить токсические вещества из организма и улучшить общее состояние пациента. Мы применяем современные методики, которые помогают минимизировать симптомы абстиненции и обеспечить комфортное пребывание в клинике.
Исследовать вопрос подробнее – http://kapelnica-ot-zapoya-irkutsk.ru/
Наркологическая клиника в Краснодаре представляет собой специализированное медицинское учреждение, где оказывается профессиональная помощь пациентам с различными формами зависимости. Современные подходы к лечению позволяют обеспечить эффективную и безопасную терапию, направленную на восстановление физического и психического здоровья.
Узнать больше – наркологическая клиника
Продолжительный запой приводит к накоплению токсинов в организме, нарушению работы внутренних органов и развитию серьезных осложнений. Чем дольше человек находится в состоянии алкогольной интоксикации, тем выше риск повреждения сердца, печени и почек. Экстренное вмешательство позволяет оперативно вывести токсины, восстановить нормальные обменные процессы и предотвратить развитие хронических заболеваний.
Подробнее – вывод из запоя в владимире
Запой характеризуется накоплением токсинов и ухудшением работы внутренних органов. Чем дольше продолжается состояние интоксикации, тем выше риск серьезных осложнений. Помощь нарколога на дому позволяет начать детоксикацию в первые часы кризиса, что существенно повышает шансы на успешное восстановление и предотвращает развитие хронических заболеваний.
Ознакомиться с деталями – https://vyvod-iz-zapoya-vladimir0.ru/vyvod-iz-zapoya-na-domu-vladimir/
Основные задачи
Подробнее можно узнать тут – лечение алкоголизма на дому
Психотерапия является неотъемлемой частью лечения, позволяя работать с психологическими причинами зависимости. В клинике применяются различные методы, включая когнитивно-поведенческую терапию, мотивационное интервью и групповую терапию. Это позволяет повысить мотивацию к выздоровлению и сформировать навыки, необходимые для жизни без наркотиков и алкоголя.
Разобраться лучше – наркологические клиники алкоголизм краснодар
Затяжной запой опасен для жизни. Врачи наркологической клиники в Люберцах проводят срочный вывод из запоя — на дому или в стационаре. Анонимно, безопасно, круглосуточно.
Подробнее тут – врача капельницу от запоя люберцы
Для обеспечения оперативности «НаркоМед» сформировала несколько мобильных бригад, размещённых по разным районам города. Каждая бригада оснащена портативными инфузионными насосами, современными измерительными приборами и запасом медикаментов.
Получить дополнительную информацию – наркологическая клиника нарколог екатеринбург
Лечение выводом из запоя на дому в «ВоронежМед» организовано по отработанному протоколу, включающему несколько ключевых этапов.
Выяснить больше – поставить капельницу от запоя в воронеже
После вашего звонка нарколог выезжает на дом в течение 30–60 минут. Прибыв на место, специалист проводит всесторонний медицинский осмотр, включая измерение артериального давления, пульса и уровня кислорода в крови, а также собирает анамнез для определения степени интоксикации.
Подробнее тут – https://narcolog-na-dom-voronezh0.ru/narkolog-na-dom-anonimno-voronezh
Первое, на что стоит обратить внимание — это профессиональный уровень сотрудников. Без квалифицированных наркологов, клинических психологов и психиатров реабилитационный процесс становится формальным и неэффективным.
Подробнее тут – наркологическая клиника цены в нижнем тагиле
Кроме стационара, клиника обеспечивает выезд нарколога на дом в любое время суток. Это позволяет оперативно начать детоксикацию и стабилизацию состояния, не дожидаясь свободного места в клинике или оформления госпитализации. Высокая мобильность специалистов и оснащённость автомобиля всем необходимым оборудованием гарантируют качественную помощь прямо на дому.
Подробнее можно узнать тут – http://narkologicheskaya-klinika-sochi00.ru/chastnaya-narkologicheskaya-klinika-sochi/
Клиника “Обновление” также активно занимается просветительской деятельностью. Мы организуем семинары и лекции, которые помогают обществу лучше понять проблемы зависимостей, их последствия и пути решения. Повышение осведомленности является важным шагом на пути к улучшению ситуации в этой области.
Получить больше информации – http://kapelnica-ot-zapoya-irkutsk.ru/kapelnica-ot-zapoya-v-kruglosutochno-v-irkutske/
Инфузионная терапия при запое основывается на принципе постепенной и контролируемой доставки лекарственных препаратов и питательных смесей непосредственно в кровеносное русло. Это позволяет:
Узнать больше – http://
Наркологическая клиника «ЗдравЦентр» оказывает круглосуточную помощь пациентам, страдающим от алкогольной интоксикации. Наши специалисты выезжают в любой район Москвы и Московской области, чтобы оперативно поставить капельницу, снять симптомы абстиненции и восстановить здоровье пациента в комфортных домашних условиях.
Подробнее можно узнать тут – http://www.domen.ru
Использование автоматизированных систем дозирования обеспечивает точное введение лекарственных средств, что минимизирует риск передозировки и побочных эффектов. Постоянный мониторинг жизненно важных показателей позволяет врачу оперативно корректировать дозировки и адаптировать терапию под динамику состояния пациента.
Получить дополнительные сведения – вывод из запоя стационар владимир
Этот метод направлен на выявление и замену негативных мыслей и стереотипов поведения, связанных с потреблением алкоголя. Пациент учится отслеживать свои эмоциональные реакции и заменять деструктивные установки конструктивными стратегиями противостояния стрессу.
Получить дополнительные сведения – клиника лечения алкоголизма сочи
Затем врач составляет индивидуальную схему детоксикации и вводит пациенту капельницу с препаратами, которые помогают эффективно очистить организм, восстановить функции сердца, печени и нервной системы. Процедура занимает от 40 минут до 2 часов в зависимости от состояния пациента.
Углубиться в тему – капельница от запоя в москве
Системы автоматизированного дозирования обеспечивают точное введение медикаментов, что минимизирует риск побочных эффектов. Постоянный мониторинг жизненно важных показателей позволяет врачу корректировать терапию в режиме реального времени, гарантируя безопасность процедуры.
Получить дополнительные сведения – вывод из запоя дешево владимир
Согласно статье, опубликованной в Журнале клинической медицины, комплексный подход снижает вероятность рецидива и способствует длительной ремиссии.
Подробнее тут – лечение алкоголизма сочи
Мы стремимся обеспечить пациентам максимальный уровень доверия и результативности лечения, сочетая передовые технологии и многолетний опыт специалистов:
Подробнее тут – https://lechenie-alkogolizma-krasnodar0.ru/
Психотерапия занимает ключевое место в комплексном лечении зависимостей. В клинике применяются методы когнитивно-поведенческой терапии, мотивационного интервью и групповой психотерапии. Эти методы способствуют формированию устойчивой мотивации к трезвому образу жизни и профилактике рецидивов. Рекомендации по психотерапии при зависимости подробно представлены на портале Психологической Ассоциации России.
Получить больше информации – https://narkologicheskaya-klinika-krasnodar00.ru/chastnaya-narkologicheskaya-klinika-v-krasnodare/
Миссия нашей клиники заключается в оказании высококачественной помощи людям, страдающим от зависимостей. Мы стремимся создать безопасное и поддерживающее пространство для лечения, где каждый пациент получает необходимую поддержку и понимание. Наша задача — не только помочь избавиться от зависимости, но и вернуть полноценную жизнедеятельность человека, восстановив его социальные связи и жизненные ориентиры.
Узнать больше – капельница от запоя на дому иркутск.
После завершения основного курса лечения в наркологической клинике в Краснодаре пациентам предлагаются программы социальной реабилитации. Они направлены на восстановление социальных навыков, адаптацию в обществе и предотвращение рецидивов. Ключевым элементом здесь является поддержка со стороны профессиональных социальных работников и участие в группах взаимопомощи.
Выяснить больше – http://narkologicheskaya-klinika-krasnodar0.ru/chastnaya-narkologicheskaya-klinika-v-krasnodare/
Мы понимаем, что лечение от алкогольной зависимости — это только первый шаг на пути к восстановлению. Профилактика рецидивов — важная часть нашего подхода. Мы проводим тренинги и курсы, направленные на развитие навыков борьбы с соблазнами и стрессом. Психотерапевтическая поддержка помогает пациентам справиться с эмоциональными трудностями, а также укрепляет мотивацию для сохранения трезвости.
Подробнее можно узнать тут – капельница от запоя цена в иркутске
Основные задачи
Получить дополнительные сведения – лечение наркомании и алкоголизма в краснодаре
Дополнительно выясняются аллергические реакции, приём других препаратов и предпочтения пациента по времени визита врача.
Изучить вопрос глубже – капельница от запоя на дому воронеж
В Люберцах решение есть — наркологическая клиника. Здесь помогают людям выйти из запоя без страха и осуждения. Всё анонимно, грамотно и с заботой о каждом пациенте.
Ознакомиться с деталями – нарколог на дом срочно город люберцы
В Люберцах решение есть — наркологическая клиника. Здесь помогают людям выйти из запоя без страха и осуждения. Всё анонимно, грамотно и с заботой о каждом пациенте.
Исследовать вопрос подробнее – posle-kapelniczy-ot-zapoya lyubercy
Выездной формат позволяет избежать контактов с другими пациентами в клинике и очистить организм в привычной обстановке. Специалисты самостоятельно привозят весь необходимый набор медикаментов и расходных материалов.
Исследовать вопрос подробнее – наркологические клиники алкоголизм
Клиника “Обновление” также активно занимается просветительской деятельностью. Мы организуем семинары и лекции, которые помогают обществу лучше понять проблемы зависимостей, их последствия и пути решения. Повышение осведомленности является важным шагом на пути к улучшению ситуации в этой области.
Изучить вопрос глубже – https://kapelnica-ot-zapoya-irkutsk.ru/kapelnica-ot-zapoya-na-domu-v-irkutske/
Питание организовано по системе «шведский стол» с блюдами, соответствующими медицинским диетам: щадящие супы, нежирное мясо, свежие овощи и кисломолочные продукты. Рацион составляют диетолог и врач-нарколог с учётом индивидуальных потребностей.
Исследовать вопрос подробнее – наркологические клиники алкоголизм сочи
Продолжительный запой приводит к накоплению токсинов в организме, нарушению работы внутренних органов и развитию серьезных осложнений. Чем дольше человек находится в состоянии алкогольной интоксикации, тем выше риск повреждения сердца, печени и почек. Экстренное вмешательство позволяет оперативно вывести токсины, восстановить нормальные обменные процессы и предотвратить развитие хронических заболеваний.
Получить дополнительные сведения – вывод из запоя цены владимир
Запой характеризуется накоплением токсинов и ухудшением работы внутренних органов. Чем дольше продолжается состояние интоксикации, тем выше риск серьезных осложнений. Помощь нарколога на дому позволяет начать детоксикацию в первые часы кризиса, что существенно повышает шансы на успешное восстановление и предотвращает развитие хронических заболеваний.
Подробнее тут – https://vyvod-iz-zapoya-vladimir0.ru/srochnyj-vyvod-iz-zapoya-vladimir/
Этот метод направлен на выявление и замену негативных мыслей и стереотипов поведения, связанных с потреблением алкоголя. Пациент учится отслеживать свои эмоциональные реакции и заменять деструктивные установки конструктивными стратегиями противостояния стрессу.
Исследовать вопрос подробнее – http://lechenie-alkogolizma-sochi0.ru
После вашего звонка нарколог выезжает на дом в течение 30–60 минут. Прибыв на место, специалист проводит всесторонний медицинский осмотр, включая измерение артериального давления, пульса и уровня кислорода в крови, а также собирает анамнез для определения степени интоксикации.
Выяснить больше – нарколог на дом круглосуточно воронеж
Врачи клиники «ЗдравЦентр» рекомендуют не откладывать вызов нарколога, чтобы избежать серьезных последствий, таких как судорожные припадки, инсульт или алкогольный психоз.
Подробнее тут – капельница от запоя клиника в москве
Клиника «МедАльянс» оказывает профессиональную медицинскую помощь на дому в Москве и Московской области круглосуточно. Опытные врачи-наркологи приедут в течение часа после вызова, проведут полную диагностику, поставят капельницу и быстро вернут пациента в стабильное состояние.
Подробнее тут – http://kapelnica-ot-zapoya-moskva000.ru
Клиника “Обновление” также активно занимается просветительской деятельностью. Мы организуем семинары и лекции, которые помогают обществу лучше понять проблемы зависимостей, их последствия и пути решения. Повышение осведомленности является важным шагом на пути к улучшению ситуации в этой области.
Получить дополнительные сведения – https://kapelnica-ot-zapoya-irkutsk.ru/kapelnica-ot-zapoya-v-kruglosutochno-v-irkutske
В клинике применяются инновационные методы диагностики, включая лабораторные анализы и аппаратные исследования, которые позволяют выявить степень зависимости и сопутствующие патологии. Важным этапом является комплексный подход к лечению, включающий детоксикацию организма, психотерапию и медикаментозную поддержку.
Подробнее можно узнать тут – наркологическая клиника нарколог краснодар
Первое, на что стоит обратить внимание — это профессиональный уровень сотрудников. Без квалифицированных наркологов, клинических психологов и психиатров реабилитационный процесс становится формальным и неэффективным.
Разобраться лучше – http://narkologicheskaya-klinika-nizhnij-tagil11.ru/platnaya-narkologicheskaya-klinika-v-nizhnem-tagile/
Мы стремимся обеспечить пациентам максимальный уровень доверия и результативности лечения, сочетая передовые технологии и многолетний опыт специалистов:
Подробнее можно узнать тут – http://www.domen.ru
После завершения основного курса лечения в наркологической клинике в Краснодаре пациентам предлагаются программы социальной реабилитации. Они направлены на восстановление социальных навыков, адаптацию в обществе и предотвращение рецидивов. Ключевым элементом здесь является поддержка со стороны профессиональных социальных работников и участие в группах взаимопомощи.
Подробнее можно узнать тут – наркологическая клиника цены краснодар
Согласно статье, опубликованной в Журнале клинической медицины, комплексный подход снижает вероятность рецидива и способствует длительной ремиссии.
Выяснить больше – клиника лечения алкоголизма сочи.
После первичного осмотра начинается активная фаза детоксикации. Современные препараты вводятся капельничным методом для быстрого снижения уровня токсинов в крови и восстановления обменных процессов. Этот этап критически важен для нормализации работы печени, почек и сердечно-сосудистой системы.
Подробнее – http://vyvod-iz-zapoya-vladimir000.ru
Лечение алкоголизма в Краснодаре представляет собой комплекс мероприятий, направленных на полное восстановление физического и психологического состояния пациента. Этот процесс требует профессионального подхода, включающего диагностику, детоксикацию, терапию зависимости и реабилитацию. Информация о современных методах терапии доступна на официальном портале Минздрава РФ.
Детальнее – http://lechenie-alkogolizma-krasnodar00.ru
Пациенты клиники «НаркоМед» полностью застрахованы от утечки личной информации. Приём и лечение оформляются по псевдониму, документы не передаются в другие организации.
Ознакомиться с деталями – наркологическая клиника нарколог в екатеринбурге
Наркологическая клиника «СочиМед» предлагает полный спектр услуг по лечению алкогольной и наркотической зависимости, сочетая современные медицинские технологии с уютной атмосферой. Размещение в стационаре организовано по принципу гостиничного сервиса: отдельные палаты с кондиционером, круглосуточное питание по диетам, а внимательный персонал поддерживает пациентов на каждом этапе восстановления.
Получить больше информации – наркологическая клиника цены в сочи
Перед оформлением вызова проводится предварительная телефонная консультация, позволяющая оценить тяжесть состояния и заранее подготовить необходимые препараты.
Узнать больше – капельница от запоя на дому воронеж.
Миссия клиники “Обновление” заключается в предоставлении качественной и всесторонней помощи людям, страдающим от различных форм зависимости. Мы понимаем, что успешное лечение невозможно без индивидуального подхода, поэтому каждый пациент проходит детальную диагностику, после которой разрабатывается персонализированный план терапии. В процессе работы мы акцентируем внимание на следующих аспектах:
Детальнее – https://kapelnica-ot-zapoya-irkutsk.ru/kapelnica-ot-zapoya-v-kruglosutochno-v-irkutske
Сразу после вызова нарколог приезжает для проведения детального осмотра. На этом этапе производится сбор анамнеза, измеряются жизненно важные показатели – пульс, артериальное давление, температура – и оценивается степень интоксикации.
Ознакомиться с деталями – http://vyvod-iz-zapoya-vladimir0.ru
Цена капельницы от запоя в Иркутске зависит от ряда факторов, таких как выбор метода лечения (на дому или в стационаре), продолжительность лечения и степень тяжести состояния пациента. Для уточнения стоимости и записи на консультацию вы можете обратиться к нашим менеджерам, которые подробно расскажут о стоимости услуг и ответят на все ваши вопросы.
Подробнее тут – https://kapelnica-ot-zapoya-irkutsk3.ru/kapelnica-ot-zapoya-v-kruglosutochno-v-irkutske/
Алкогольная зависимость — это комплексное заболевание, требующее не только медикаментозного воздействия, но и серьёзной психологической поддержки. В Сочи клиника «ЮгМед» предлагает выезд нарколога на дом, что позволяет начать лечение без стресса, связанного с госпитализацией. Такой подход особенно важен для тех, кто ценит конфиденциальность и предпочитает комфорт привычной обстановки. Мы обеспечиваем полную анонимность, а опытные специалисты разрабатывают индивидуальную программу, учитывающую длительность запоя, сопутствующие заболевания и психологические факторы зависимости.
Получить больше информации – лечение алкоголизма краснодарский край
В этих случаях вызов нарколога на дом не только оправдан, но и жизненно необходим для предотвращения опасных осложнений и стабилизации здоровья пациента.
Узнать больше – запой нарколог на дом воронеж
В Люберцах решение есть — наркологическая клиника. Здесь помогают людям выйти из запоя без страха и осуждения. Всё анонимно, грамотно и с заботой о каждом пациенте.
Исследовать вопрос подробнее – капельница от запоя вызов
Когда запой становится критическим, оперативное вмешательство имеет решающее значение для спасения здоровья и предотвращения необратимых последствий. Во Владимире экстренная помощь нарколога на дому позволяет быстро начать лечение, не требуя госпитализации, что особенно важно для пациентов, нуждающихся в сохранении конфиденциальности и комфорте.
Получить больше информации – вывод из запоя цена владимир
Самостоятельно выйти из запоя — почти невозможно. В Люберцах врачи клиники проводят медикаментозный вывод из запоя с круглосуточным выездом. Доверяйте профессионалам.
Углубиться в тему – нарколог на дом клиника
Клиника «МедАльянс» оказывает профессиональную медицинскую помощь на дому в Москве и Московской области круглосуточно. Опытные врачи-наркологи приедут в течение часа после вызова, проведут полную диагностику, поставят капельницу и быстро вернут пациента в стабильное состояние.
Получить дополнительную информацию – капельница от запоя вызов
Дополнительную информацию о методах социальной реабилитации можно найти в публикациях Фонда борьбы с наркоманией и алкоголизмом.
Подробнее – бесплатная наркологическая клиника в краснодаре
После вызова врач клиники «ЗдравЦентр» прибывает к пациенту в течение 30–60 минут. Он проводит первичный осмотр, оценивает степень тяжести алкогольной интоксикации, измеряет пульс, давление, уровень кислорода и другие показатели здоровья. На основании этих данных составляется индивидуальный план лечения.
Исследовать вопрос подробнее – postavit-kapelniczu-ot-zapoya moskva
В клинике применяются инновационные методы диагностики, включая лабораторные анализы и аппаратные исследования, которые позволяют выявить степень зависимости и сопутствующие патологии. Важным этапом является комплексный подход к лечению, включающий детоксикацию организма, психотерапию и медикаментозную поддержку.
Получить дополнительные сведения – частная наркологическая клиника в краснодаре
«СочиМед» предлагает комплексный подход: диагностика, детоксикация, терапия сопутствующих состояний, психологическая и социальная поддержка. В стационаре доступны:
Подробнее можно узнать тут – наркологическая клиника
Каждый пациент получает персонализированную программу, учитывающую стадию заболевания, сопутствующие патологии и социальный статус. На основании анализа состояния назначается оптимальная терапия, что значительно повышает эффективность лечения. Врач-нарколог подбирает препараты с учетом индивидуальной переносимости, а психотерапевт разрабатывает план психологической поддержки.
Получить дополнительные сведения – http://lechenie-alkogolizma-sochi00.ru
Первым этапом лечения является медицинская детоксикация, которая направлена на удаление токсинов из организма и стабилизацию физического состояния пациента. Мы используем современные методики, которые помогают минимизировать симптомы абстиненции, такие как головная боль, тошнота и слабость, обеспечивая комфортное пребывание в клинике.
Получить дополнительные сведения – https://kapelnica-ot-zapoya-irkutsk2.ru/
Пациенты клиники «НаркоМед» полностью застрахованы от утечки личной информации. Приём и лечение оформляются по псевдониму, документы не передаются в другие организации.
Ознакомиться с деталями – https://narkologicheskaya-klinika-ekaterinburg0.ru/narkologicheskaya-klinika-otzyvy-v-ekb/
После основной терапии важно обеспечить поддержку пациента в период реабилитации. Реабилитационные программы в Краснодаре включают социальную адаптацию, восстановление навыков общения и трудоустройства. Это позволяет минимизировать риск рецидива и возвращения к употреблению алкоголя. Поддержка со стороны специалистов и близких — обязательное условие успешного результата. Более подробно о социальной реабилитации можно ознакомиться на сайте Федерального реабилитационного центра.
Получить больше информации – http://lechenie-alkogolizma-krasnodar00.ru
Основной этап, направленный на очищение организма от продуктов распада алкоголя и нормализацию функций внутренних органов. Применяются современные препараты с антиоксидантным и гепатопротекторным эффектом.
Получить больше информации – центр лечения алкоголизма в краснодаре
Во-вторых, реабилитация является неотъемлемой частью нашего подхода. Мы понимаем, что избавление от физической зависимости — это только первый шаг. Важной задачей является восстановление социального статуса, создание новых привычек и умение управлять своей жизнью без наркотиков или алкоголя. Наша клиника предлагает групповые и индивидуальные занятия, направленные на изменение поведения и мышления.
Получить дополнительные сведения – https://kapelnica-ot-zapoya-irkutsk.ru/kapelnica-ot-zapoya-anonimno-v-irkutske/
Пациенту устанавливают катетер в вену на руке или предплечье, используя лёгкий местный анестетик для минимизации дискомфорта. Затем подключают автоматизированную помпу, обеспечивающую равномерную подачу раствора в течение 3–6 часов.
Разобраться лучше – капельница от запоя на дому цена в воронеже
После вашего звонка нарколог выезжает на дом в течение 30–60 минут. Прибыв на место, специалист проводит всесторонний медицинский осмотр, включая измерение артериального давления, пульса и уровня кислорода в крови, а также собирает анамнез для определения степени интоксикации.
Получить дополнительные сведения – http://narcolog-na-dom-voronezh0.ru/
Наша клиника сочетает в себе оперативность, комфорт и высокие стандарты безопасности. Вот основные преимущества сотрудничества:
Получить дополнительную информацию – капельница от запоя в воронеже
Запой характеризуется накоплением токсинов и ухудшением работы внутренних органов. Чем дольше продолжается состояние интоксикации, тем выше риск серьезных осложнений. Помощь нарколога на дому позволяет начать детоксикацию в первые часы кризиса, что существенно повышает шансы на успешное восстановление и предотвращает развитие хронических заболеваний.
Разобраться лучше – https://vyvod-iz-zapoya-vladimir0.ru/vyvod-iz-zapoya-anonimno-vladimir/
Незамедлительно после вызова нарколог прибывает на дом для проведения тщательного осмотра. На данном этапе специалист собирает анамнез, измеряет жизненно важные показатели — пульс, артериальное давление, температуру — и оценивает степень интоксикации. Эти данные являются основой для составления индивидуального плана лечения.
Исследовать вопрос подробнее – вывод из запоя владимирская область
Особенно важно на этапе поступления пройти полную психодиагностику и получить адаптированную под конкретного пациента программу. Это позволит учитывать возможные сопутствующие расстройства, включая тревожные, аффективные и когнитивные нарушения.
Ознакомиться с деталями – наркологическая клиника
Психоэмоциональное состояние играет ключевую роль в лечении зависимости. В «ЮгМед» психологи и психотерапевты обеспечивают сопровождение на всех этапах реабилитации, помогая пациенту справиться с тревогой, сниженной самооценкой и стрессом. Одна только медикаментозная детоксикация не гарантирует успеха — важно разобраться в причинах зависимости и выработать навыки противодействия соблазнам.
Подробнее тут – https://lechenie-alkogolizma-sochi0.ru/lechenie-alkogolizma-na-domu
Наши врачи уделяют внимание не только медицинским аспектам, но также социальным и психологическим факторам. Мы помогаем пациентам находить новый смысл в жизни, формировать новые увлечения и восстанавливать старые связи с близкими.
Подробнее тут – kapelnicza-ot-zapoya-czena irkutsk
Лечение в наркологической клинике в Краснодаре строится на комплексном подходе, включающем медикаментозную терапию, психотерапевтическую помощь и социальную реабилитацию. Медикаментозное лечение направлено на детоксикацию организма и снижение симптомов абстиненции, что позволяет значительно улучшить состояние пациента в первые дни терапии. Современные препараты, применяемые в лечении зависимости, сертифицированы и соответствуют международным стандартам, что подтверждается на сайте Всемирной организации здравоохранения.
Выяснить больше – http://narkologicheskaya-klinika-krasnodar0.ru/anonimnaya-narkologicheskaya-klinika-v-krasnodare/
Затяжной запой опасен для жизни. Врачи наркологической клиники в Люберцах проводят срочный вывод из запоя — на дому или в стационаре. Анонимно, безопасно, круглосуточно.
Подробнее – kapelnicza-ot-zapoya lyubercy
«НаркоМед» основана группой узкопрофильных специалистов, чей опыт насчитывает более 15 лет в лечении зависимости. Клиника работает круглосуточно — вы можете рассчитывать на оперативное реагирование в любой час дня и ночи. Анонимность пациентов сохраняется на уровне медицинской тайны: персональные данные и диагноз не разглашаются.
Получить дополнительные сведения – наркологические клиники алкоголизм свердловская область
Выезд на дом включает: первичный осмотр, необходимые анализы на месте, подготовку и введение инфузионных смесей, мониторинг динамики, а также рекомендации по дальнейшему лечению.
Получить больше информации – narkologicheskaya-klinika-sochi00.ru/
Клиника «МедАльянс» оказывает профессиональную медицинскую помощь на дому в Москве и Московской области круглосуточно. Опытные врачи-наркологи приедут в течение часа после вызова, проведут полную диагностику, поставят капельницу и быстро вернут пациента в стабильное состояние.
Подробнее можно узнать тут – http://kapelnica-ot-zapoya-moskva000.ru
В нашей клинике “Сила воли” в Иркутске вы можете получить помощь как в стационаре, так и на дому. Мы предлагаем два вида услуг:
Разобраться лучше – http://kapelnica-ot-zapoya-irkutsk3.ru/kapelnica-ot-zapoya-v-kruglosutochno-v-irkutske/
Наркологическая клиника в Краснодаре представляет собой специализированное медицинское учреждение, где оказывается профессиональная помощь пациентам с различными формами зависимости. Современные подходы к лечению позволяют обеспечить эффективную и безопасную терапию, направленную на восстановление физического и психического здоровья.
Выяснить больше – https://narkologicheskaya-klinika-krasnodar00.ru/platnaya-narkologicheskaya-klinika-krasnodar/
Психотерапия в лечении алкоголизма играет важнейшую роль. Используются когнитивно-поведенческие техники, групповые занятия, а также индивидуальные консультации с психологами и психотерапевтами. Применение методов мотивационного интервьюирования способствует формированию устойчивой мотивации на трезвость, что подробно описано в исследованиях Американской психиатрической ассоциации. Также актуальную информацию можно найти на портале Психологической ассоциации России.
Углубиться в тему – http://lechenie-alkogolizma-krasnodar00.ru/lechenie-khronicheskogo-alkogolizma-krasnodar/
Согласно статье, опубликованной в Журнале клинической медицины, комплексный подход снижает вероятность рецидива и способствует длительной ремиссии.
Детальнее – лечение алкоголизма цена
Каждый пациент уникален — именно поэтому мы не применяем «типовых» решений. После первичной консультации и диагностики специалисты «КубаньМед» разрабатывают персональную программу, учитывающую состояние здоровья, психологические особенности и социальные обстоятельства пациента.
Получить дополнительную информацию – lechenie alkogolizma krasnodar
Незамедлительно после вызова нарколог прибывает на дом для проведения тщательного осмотра. На данном этапе специалист собирает анамнез, измеряет жизненно важные показатели — пульс, артериальное давление, температуру — и оценивает степень интоксикации. Эти данные являются основой для составления индивидуального плана лечения.
Ознакомиться с деталями – https://vyvod-iz-zapoya-vladimir000.ru/vyvod-iz-zapoya-anonimno-vladimir
Алкогольная интоксикация может быстро привести к тяжелым осложнениям, если не принять своевременных мер. Экстренная помощь нарколога необходима при следующих признаках:
Детальнее – http://kapelnica-ot-zapoya-moskva00.ru
Сразу после вызова нарколог приезжает для проведения детального осмотра. На этом этапе производится сбор анамнеза, измеряются жизненно важные показатели – пульс, артериальное давление, температура – и оценивается степень интоксикации.
Узнать больше – https://vyvod-iz-zapoya-vladimir0.ru/vyvod-iz-zapoya-na-domu-vladimir
При длительном запое в крови накапливаются ацетальдегид и другие токсичные метаболиты этанола, которые повреждают клетки печени, нарушают функцию почек и приводят к дисбалансу электролитов. Без своевременной детоксикации повышается риск острых состояний — судорог, инсультов, инфаркта, панкреатита и психоза. Чем раньше начато лечение, тем быстрее нормализуются показатели обмена веществ, возвращается водно-электролитный баланс и восстанавливается работа жизненно важных органов. Анонимный выезд нарколога помогает снять психологический барьер перед обращением за помощью.
Ознакомиться с деталями – kapelnica-ot-zapoya-voronezh.ru/
Когда организм на пределе, важна срочная помощь в Люберцах — это команда опытных наркологов, которые помогут быстро и мягко выйти из запоя без вреда для здоровья.
Углубиться в тему – поставить капельницу от запоя в люберцах
Во-первых, мы фокусируемся на медицинской детоксикации, которая является первоочередной задачей при лечении зависимостей. Этот процесс позволяет удалить токсические вещества из организма и улучшить общее состояние пациента. Мы применяем современные методики, которые помогают минимизировать симптомы абстиненции и обеспечить комфортное пребывание в клинике.
Разобраться лучше – https://kapelnica-ot-zapoya-irkutsk.ru/
Каждый день запоя увеличивает риск для жизни. Не рискуйте — специалисты в Люберцах приедут на дом и окажут экстренную помощь. Без боли, стресса и ожидания.
Исследовать вопрос подробнее – vyzvat-narkologa-na-dom lyubercy
Алкогольная зависимость — это комплексное заболевание, требующее не только медикаментозного воздействия, но и серьёзной психологической поддержки. В Сочи клиника «ЮгМед» предлагает выезд нарколога на дом, что позволяет начать лечение без стресса, связанного с госпитализацией. Такой подход особенно важен для тех, кто ценит конфиденциальность и предпочитает комфорт привычной обстановки. Мы обеспечиваем полную анонимность, а опытные специалисты разрабатывают индивидуальную программу, учитывающую длительность запоя, сопутствующие заболевания и психологические факторы зависимости.
Выяснить больше – https://lechenie-alkogolizma-sochi0.ru/lechenie-alkogolizma-gipnozom-v-sochi/
Клиника «НаркологикПлюс» предоставляет квалифицированную помощь нарколога на дому в Воронеже. Если вы или ваши близкие столкнулись с последствиями длительного употребления алкоголя или наркотиков, наши специалисты готовы оперативно выехать и оказать экстренную помощь. Мы проводим детоксикацию организма, снимаем симптомы абстинентного синдрома и стабилизируем состояние пациента, обеспечивая высокий уровень безопасности, строгую анонимность и индивидуальный подход.
Узнать больше – врач нарколог на дом
Наркологическая клиника в Краснодаре играет важную роль в оказании медицинской помощи людям с различными формами зависимости. Современные методы диагностики и лечения позволяют эффективно справляться с проблемами, связанными с алкоголизмом, наркотической зависимостью и другими психоактивными веществами. Клиническая помощь организована с учетом индивидуальных особенностей пациентов и направлена на достижение стойкой ремиссии.
Исследовать вопрос подробнее – http://narkologicheskaya-klinika-krasnodar0.ru
Когда запой становится критическим, оперативное вмешательство имеет решающее значение для спасения здоровья и предотвращения необратимых последствий. Во Владимире экстренная помощь нарколога на дому позволяет быстро начать лечение, не требуя госпитализации, что особенно важно для пациентов, нуждающихся в сохранении конфиденциальности и комфорте.
Получить дополнительные сведения – вывод из запоя на дому в владимире
Пациенты клиники «НаркоМед» полностью застрахованы от утечки личной информации. Приём и лечение оформляются по псевдониму, документы не передаются в другие организации.
Узнать больше – https://narkologicheskaya-klinika-ekaterinburg0.ru/chastnaya-narkologicheskaya-klinika-v-ekb/
«СочиМед» предлагает комплексный подход: диагностика, детоксикация, терапия сопутствующих состояний, психологическая и социальная поддержка. В стационаре доступны:
Выяснить больше – https://narkologicheskaya-klinika-sochi00.ru/narkologicheskaya-klinika-vyvod-iz-zapoya-sochi
Метод лечения
Углубиться в тему – http://narkologicheskaya-klinika-krasnodar00.ru
Этап лечения
Разобраться лучше – lechenie-alkogolizma-krasnodar00.ru/
Как подчёркивает заведующая отделением клинической психологии ФГБУН «НМИЦ психиатрии и наркологии» Минздрава России, наличие в команде специалистов с опытом работы в области зависимости — это основа качественной помощи.
Подробнее – наркологическая клиника нарколог нижний тагил
В клинике “Восстановление души” работает команда высококвалифицированных специалистов, готовых предложить современное и эффективное лечение зависимостей. Наши врачи-наркологи обладают обширным опытом работы и постоянно совершенствуют свои навыки, чтобы использовать самые передовые методы терапии.
Изучить вопрос глубже – капельница от запоя клиника в иркутске
Согласно статье, опубликованной в Журнале клинической медицины, комплексный подход снижает вероятность рецидива и способствует длительной ремиссии.
Исследовать вопрос подробнее – http://lechenie-alkogolizma-sochi00.ru
Во-вторых, реабилитация является неотъемлемой частью нашего подхода. Мы понимаем, что избавление от физической зависимости — это только первый шаг. Важной задачей является восстановление социального статуса, создание новых привычек и умение управлять своей жизнью без наркотиков или алкоголя. Наша клиника предлагает групповые и индивидуальные занятия, направленные на изменение поведения и мышления.
Изучить вопрос глубже – капельница от запоя цена иркутск
Комплексное лечение на дому организовано по четкой схеме, состоящей из последовательных этапов. Каждый из них направлен на быстрое восстановление нормального функционирования организма.
Углубиться в тему – вывод из запоя владимир
По завершении лечения врач дает подробные рекомендации о дальнейших действиях и, если необходимо, предлагает варианты кодирования или дополнительного лечения зависимости.
Детальнее – kapelnica-ot-zapoya-moskva000.ru/
Мы стремимся обеспечить пациентам максимальный уровень доверия и результативности лечения, сочетая передовые технологии и многолетний опыт специалистов:
Выяснить больше – наркологическое лечение алкоголизма
Дополнительно выясняются аллергические реакции, приём других препаратов и предпочтения пациента по времени визита врача.
Подробнее тут – вызвать капельницу от запоя на дому
Врачи клиники «ЗдравЦентр» рекомендуют не откладывать вызов нарколога, чтобы избежать серьезных последствий, таких как судорожные припадки, инсульт или алкогольный психоз.
Получить дополнительные сведения – капельница от запоя цена москва.
В нашей клинике “Сила воли” в Иркутске вы можете получить помощь как в стационаре, так и на дому. Мы предлагаем два вида услуг:
Изучить вопрос глубже – капельница от запоя иркутск.
Незамедлительно после вызова нарколог прибывает на дом для проведения тщательного осмотра. На данном этапе специалист собирает анамнез, измеряет жизненно важные показатели — пульс, артериальное давление, температуру — и оценивает степень интоксикации. Эти данные являются основой для составления индивидуального плана лечения.
Получить больше информации – нарколог на дом вывод из запоя владимир
Нарколог устанавливает внутривенную капельницу, через которую вводятся растворы, обеспечивающие быстрое выведение токсинов, восстановление водно-электролитного баланса и стабилизацию состояния.
Углубиться в тему – http://narcolog-na-dom-voronezh00.ru
Инфузионная терапия при запое основывается на принципе постепенной и контролируемой доставки лекарственных препаратов и питательных смесей непосредственно в кровеносное русло. Это позволяет:
Подробнее – http://kapelnica-ot-zapoya-voronezh2.ru/kapelnicza-ot-zapoya-czena-v-voronezhe/
В клинике применяются разнообразные психотерапевтические техники, позволяющие адаптировать лечение под индивидуальные особенности пациента.
Подробнее – лечение наркомании и алкоголизма сочи
Наркологическая клиника в Краснодаре играет важную роль в оказании медицинской помощи людям с различными формами зависимости. Современные методы диагностики и лечения позволяют эффективно справляться с проблемами, связанными с алкоголизмом, наркотической зависимостью и другими психоактивными веществами. Клиническая помощь организована с учетом индивидуальных особенностей пациентов и направлена на достижение стойкой ремиссии.
Подробнее тут – http://narkologicheskaya-klinika-krasnodar0.ru
Пациенты клиники «НаркоМед» полностью застрахованы от утечки личной информации. Приём и лечение оформляются по псевдониму, документы не передаются в другие организации.
Детальнее – наркологическая клиника нарколог в екатеринбурге
Во-первых, мы фокусируемся на медицинской детоксикации, которая является первоочередной задачей при лечении зависимостей. Этот процесс позволяет удалить токсические вещества из организма и улучшить общее состояние пациента. Мы применяем современные методики, которые помогают минимизировать симптомы абстиненции и обеспечить комфортное пребывание в клинике.
Изучить вопрос глубже – вызвать капельницу от запоя на дому
Каждый день запоя увеличивает риск для жизни. Не рискуйте — специалисты в Люберцах приедут на дом и окажут экстренную помощь. Без боли, стресса и ожидания.
Изучить вопрос глубже – капельница от запоя наркология люберцы
«СочиМед» предлагает комплексный подход: диагностика, детоксикация, терапия сопутствующих состояний, психологическая и социальная поддержка. В стационаре доступны:
Исследовать вопрос подробнее – бесплатная наркологическая клиника сочи
Затяжной запой опасен для жизни. Врачи наркологической клиники в Люберцах проводят срочный вывод из запоя — на дому или в стационаре. Анонимно, безопасно, круглосуточно.
Детальнее – нарколог на дом срочно город люберцы
Клиника «НаркологикПлюс» предоставляет квалифицированную помощь нарколога на дому в Воронеже. Если вы или ваши близкие столкнулись с последствиями длительного употребления алкоголя или наркотиков, наши специалисты готовы оперативно выехать и оказать экстренную помощь. Мы проводим детоксикацию организма, снимаем симптомы абстинентного синдрома и стабилизируем состояние пациента, обеспечивая высокий уровень безопасности, строгую анонимность и индивидуальный подход.
Подробнее тут – https://narcolog-na-dom-voronezh0.ru
Этап лечения
Детальнее – центр лечения алкоголизма краснодар.
Метод лечения
Изучить вопрос глубже – http://narkologicheskaya-klinika-krasnodar00.ru/
Важным этапом лечения является детоксикация организма, которая направлена на выведение токсинов и нормализацию работы внутренних органов. Применение препаратов, таких как антабус и налтрексон, доказало свою эффективность в профилактике срывов, что подтверждают клинические исследования на Клиническом портале.
Узнать больше – лечение алкоголизма цена
Сразу после вызова нарколог приезжает для проведения детального осмотра. На этом этапе производится сбор анамнеза, измеряются жизненно важные показатели – пульс, артериальное давление, температура – и оценивается степень интоксикации.
Подробнее – срочный вывод из запоя владимир
Когда запой становится критическим, оперативное вмешательство имеет решающее значение для спасения здоровья и предотвращения необратимых последствий. Во Владимире экстренная помощь нарколога на дому позволяет быстро начать лечение, не требуя госпитализации, что особенно важно для пациентов, нуждающихся в сохранении конфиденциальности и комфорте.
Ознакомиться с деталями – https://vyvod-iz-zapoya-vladimir000.ru/vyvod-iz-zapoya-na-domu-vladimir/
Перед оформлением вызова проводится предварительная телефонная консультация, позволяющая оценить тяжесть состояния и заранее подготовить необходимые препараты.
Изучить вопрос глубже – капельница от запоя анонимно воронеж
Затем врач составляет индивидуальную схему детоксикации и вводит пациенту капельницу с препаратами, которые помогают эффективно очистить организм, восстановить функции сердца, печени и нервной системы. Процедура занимает от 40 минут до 2 часов в зависимости от состояния пациента.
Детальнее – вызвать капельницу от запоя на дому в москве
Алкогольная зависимость — хроническое заболевание, требующее комплексного подхода. В клинике «КубаньМед» в Краснодаре разработаны авторские методики, направленные на полное преодоление зависимости и возвращение пациента к полноценной жизни. Мы предлагаем индивидуальные программы лечения, сочетающие медикаментозную детоксикацию, специализированные реабилитационные процедуры и профессиональные психологические консультации. Всё это в условиях полного комфорта и абсолютной конфиденциальности.
Исследовать вопрос подробнее – http://lechenie-alkogolizma-krasnodar0.ru
Клиника “Обновление” также активно занимается просветительской деятельностью. Мы организуем семинары и лекции, которые помогают обществу лучше понять проблемы зависимостей, их последствия и пути решения. Повышение осведомленности является важным шагом на пути к улучшению ситуации в этой области.
Ознакомиться с деталями – капельница от запоя вызов
Как подчёркивает заведующая отделением клинической психологии ФГБУН «НМИЦ психиатрии и наркологии» Минздрава России, наличие в команде специалистов с опытом работы в области зависимости — это основа качественной помощи.
Выяснить больше – наркологические клиники алкоголизм
В клинике применяются разнообразные психотерапевтические техники, позволяющие адаптировать лечение под индивидуальные особенности пациента.
Выяснить больше – http://lechenie-alkogolizma-sochi0.ru/czentr-lecheniya-alkogolizma-v-sochi/
Выездной формат позволяет избежать контактов с другими пациентами в клинике и очистить организм в привычной обстановке. Специалисты самостоятельно привозят весь необходимый набор медикаментов и расходных материалов.
Выяснить больше – наркологическая клиника нарколог екатеринбург
После вызова врач клиники «ЗдравЦентр» прибывает к пациенту в течение 30–60 минут. Он проводит первичный осмотр, оценивает степень тяжести алкогольной интоксикации, измеряет пульс, давление, уровень кислорода и другие показатели здоровья. На основании этих данных составляется индивидуальный план лечения.
Получить больше информации – капельница от запоя клиника
Дополнительную информацию о методах социальной реабилитации можно найти в публикациях Фонда борьбы с наркоманией и алкоголизмом.
Подробнее тут – наркологическая клиника краснодар
Продолжительный запой приводит к накоплению токсинов в организме, нарушению работы внутренних органов и развитию серьезных осложнений. Чем дольше человек находится в состоянии алкогольной интоксикации, тем выше риск повреждения сердца, печени и почек. Экстренное вмешательство позволяет оперативно вывести токсины, восстановить нормальные обменные процессы и предотвратить развитие хронических заболеваний.
Подробнее можно узнать тут – срочный вывод из запоя владимир
Цена капельницы от запоя в Иркутске зависит от ряда факторов, таких как выбор метода лечения (на дому или в стационаре), продолжительность лечения и степень тяжести состояния пациента. Для уточнения стоимости и записи на консультацию вы можете обратиться к нашим менеджерам, которые подробно расскажут о стоимости услуг и ответят на все ваши вопросы.
Подробнее тут – https://kapelnica-ot-zapoya-irkutsk3.ru/kapelnica-ot-zapoya-cena-v-irkutske
Комплексное лечение на дому организовано по четкой схеме, состоящей из последовательных этапов. Каждый из них направлен на быстрое восстановление нормального функционирования организма.
Подробнее – https://vyvod-iz-zapoya-vladimir0.ru/vyvod-iz-zapoya-anonimno-vladimir
Кроме стационара, клиника обеспечивает выезд нарколога на дом в любое время суток. Это позволяет оперативно начать детоксикацию и стабилизацию состояния, не дожидаясь свободного места в клинике или оформления госпитализации. Высокая мобильность специалистов и оснащённость автомобиля всем необходимым оборудованием гарантируют качественную помощь прямо на дому.
Детальнее – наркологическая клиника краснодарский край
Миссия клиники “Обновление” заключается в предоставлении качественной и всесторонней помощи людям, страдающим от различных форм зависимости. Мы понимаем, что успешное лечение невозможно без индивидуального подхода, поэтому каждый пациент проходит детальную диагностику, после которой разрабатывается персонализированный план терапии. В процессе работы мы акцентируем внимание на следующих аспектах:
Разобраться лучше – капельница от запоя иркутская область
Этап лечения
Узнать больше – наркология лечение алкоголизма
В клинике применяются инновационные методы диагностики, включая лабораторные анализы и аппаратные исследования, которые позволяют выявить степень зависимости и сопутствующие патологии. Важным этапом является комплексный подход к лечению, включающий детоксикацию организма, психотерапию и медикаментозную поддержку.
Разобраться лучше – https://narkologicheskaya-klinika-krasnodar00.ru/anonimnaya-narkologicheskaya-klinika-v-krasnodare/
Алкоголизм является хроническим заболеванием, требующим комплексного и профессионального подхода к лечению. Лечение алкоголизма в Сочи направлено на полное восстановление физического и психоэмоционального состояния пациента с помощью современных медицинских технологий и индивидуально подобранных программ терапии.
Разобраться лучше – https://lechenie-alkogolizma-sochi00.ru/czentr-lecheniya-alkogolizma-v-sochi
Проблема зависимости от алкоголя, наркотиков и азартных игр остается одной из наиболее острых в современном обществе. Эти состояния оказывают значительное воздействие не только на здоровье самого человека, но и на его семью, друзей и общественные связи. Наркологическая клиника “Восстановление души” предлагает широкий спектр услуг для тех, кто борется с различными формами зависимости, такими как алкоголизм, наркомания и игромания. Наша цель — предоставить комплексный подход к лечению, что обеспечивает высокие показатели успешности среди наших пациентов.
Подробнее – http://kapelnica-ot-zapoya-irkutsk2.ru
Самостоятельно выйти из запоя — почти невозможно. В Люберцах врачи клиники проводят медикаментозный вывод из запоя с круглосуточным выездом. Доверяйте профессионалам.
Выяснить больше – капельница от запоя анонимно люберцы
В Люберцах решение есть — наркологическая клиника. Здесь помогают людям выйти из запоя без страха и осуждения. Всё анонимно, грамотно и с заботой о каждом пациенте.
Выяснить больше – врач на дом капельница от запоя
Затем врач составляет индивидуальную схему детоксикации и вводит пациенту капельницу с препаратами, которые помогают эффективно очистить организм, восстановить функции сердца, печени и нервной системы. Процедура занимает от 40 минут до 2 часов в зависимости от состояния пациента.
Детальнее – http://kapelnica-ot-zapoya-moskva000.ru
Алкогольная зависимость — хроническое заболевание, требующее комплексного подхода. В клинике «КубаньМед» в Краснодаре разработаны авторские методики, направленные на полное преодоление зависимости и возвращение пациента к полноценной жизни. Мы предлагаем индивидуальные программы лечения, сочетающие медикаментозную детоксикацию, специализированные реабилитационные процедуры и профессиональные психологические консультации. Всё это в условиях полного комфорта и абсолютной конфиденциальности.
Подробнее – http://lechenie-alkogolizma-krasnodar0.ru/lechenie-khronicheskogo-alkogolizma-krasnodar/
Процесс лечения выездом на дом в «ВоронежЛайф» структурирован и прозрачен. Каждый этап гарантирует максимальную безопасность и эффективность.
Углубиться в тему – http://kapelnica-ot-zapoya-voronezh3.ru/kapelnicza-ot-zapoya-na-domu-v-voronezhe/
Клиника «НаркологикПлюс» предоставляет квалифицированную помощь нарколога на дому в Воронеже. Если вы или ваши близкие столкнулись с последствиями длительного употребления алкоголя или наркотиков, наши специалисты готовы оперативно выехать и оказать экстренную помощь. Мы проводим детоксикацию организма, снимаем симптомы абстинентного синдрома и стабилизируем состояние пациента, обеспечивая высокий уровень безопасности, строгую анонимность и индивидуальный подход.
Выяснить больше – вызов врача нарколога на дом в воронеже
Использование автоматизированных систем дозирования обеспечивает точное введение лекарственных средств, что минимизирует риск передозировки и побочных эффектов. Постоянный мониторинг жизненно важных показателей позволяет врачу оперативно корректировать дозировки и адаптировать терапию под динамику состояния пациента.
Подробнее можно узнать тут – вывод из запоя дешево владимир
В клинике применяются разнообразные психотерапевтические техники, позволяющие адаптировать лечение под индивидуальные особенности пациента.
Получить дополнительную информацию – http://lechenie-alkogolizma-sochi0.ru/lechenie-alkogolizma-anonimno-v-sochi/
Достаточно связаться по телефону или через мессенджер и сообщить минимальный набор данных — имя и адрес. Все остальные детали обсуждаются устно, без фиксации на бумаге.
Изучить вопрос глубже – частная наркологическая клиника екатеринбург
Самостоятельно выйти из запоя — почти невозможно. В Люберцах врачи клиники проводят медикаментозный вывод из запоя с круглосуточным выездом. Доверяйте профессионалам.
Выяснить больше – нарколог на дом в городе люберцах
После завершения основного курса лечения в наркологической клинике в Краснодаре пациентам предлагаются программы социальной реабилитации. Они направлены на восстановление социальных навыков, адаптацию в обществе и предотвращение рецидивов. Ключевым элементом здесь является поддержка со стороны профессиональных социальных работников и участие в группах взаимопомощи.
Подробнее можно узнать тут – наркологические клиники алкоголизм в краснодаре
Во-первых, мы фокусируемся на медицинской детоксикации, которая является первоочередной задачей при лечении зависимостей. Этот процесс позволяет удалить токсические вещества из организма и улучшить общее состояние пациента. Мы применяем современные методики, которые помогают минимизировать симптомы абстиненции и обеспечить комфортное пребывание в клинике.
Узнать больше – http://kapelnica-ot-zapoya-irkutsk.ru/kapelnica-ot-zapoya-anonimno-v-irkutske/
После вызова врач клиники «ЗдравЦентр» прибывает к пациенту в течение 30–60 минут. Он проводит первичный осмотр, оценивает степень тяжести алкогольной интоксикации, измеряет пульс, давление, уровень кислорода и другие показатели здоровья. На основании этих данных составляется индивидуальный план лечения.
Исследовать вопрос подробнее – http://
Системы автоматизированного дозирования обеспечивают точное введение медикаментов, что минимизирует риск побочных эффектов. Постоянный мониторинг жизненно важных показателей позволяет врачу корректировать терапию в режиме реального времени, гарантируя безопасность процедуры.
Разобраться лучше – https://vyvod-iz-zapoya-vladimir0.ru/vyvod-iz-zapoya-na-domu-vladimir/
«СочиМед» предлагает комплексный подход: диагностика, детоксикация, терапия сопутствующих состояний, психологическая и социальная поддержка. В стационаре доступны:
Разобраться лучше – https://narkologicheskaya-klinika-sochi00.ru
Пациенту устанавливают катетер в вену на руке или предплечье, используя лёгкий местный анестетик для минимизации дискомфорта. Затем подключают автоматизированную помпу, обеспечивающую равномерную подачу раствора в течение 3–6 часов.
Исследовать вопрос подробнее – врач на дом капельница от запоя воронеж
В клинике применяются инновационные методы диагностики, включая лабораторные анализы и аппаратные исследования, которые позволяют выявить степень зависимости и сопутствующие патологии. Важным этапом является комплексный подход к лечению, включающий детоксикацию организма, психотерапию и медикаментозную поддержку.
Узнать больше – https://narkologicheskaya-klinika-krasnodar00.ru/anonimnaya-narkologicheskaya-klinika-v-krasnodare
Каждый пациент получает персонализированную программу, учитывающую стадию заболевания, сопутствующие патологии и социальный статус. На основании анализа состояния назначается оптимальная терапия, что значительно повышает эффективность лечения. Врач-нарколог подбирает препараты с учетом индивидуальной переносимости, а психотерапевт разрабатывает план психологической поддержки.
Выяснить больше – лечение алкоголизма
Перед заключением договора стоит поинтересоваться:
Детальнее – http://narkologicheskaya-klinika-nizhnij-tagil11.ru
Алкогольный запой представляет собой длительное непрерывное употребление спиртного, приводящее к накоплению токсинов в организме и серьёзным нарушениям работы внутренних систем. В такие моменты помощь профессионального нарколога необходима как можно скорее — ведь от скорости детоксикации зависит минимизация рисков осложнений и сохранение здоровья пациента. Клиника «ВоронежМед» предлагает анонимный круглосуточный выезд специалиста на дом в пределах города за 60 минут, обеспечивая качественную инфузионную терапию в привычной обстановке.
Получить дополнительные сведения – http://kapelnica-ot-zapoya-voronezh.ru
После основной терапии важно обеспечить поддержку пациента в период реабилитации. Реабилитационные программы в Краснодаре включают социальную адаптацию, восстановление навыков общения и трудоустройства. Это позволяет минимизировать риск рецидива и возвращения к употреблению алкоголя. Поддержка со стороны специалистов и близких — обязательное условие успешного результата. Более подробно о социальной реабилитации можно ознакомиться на сайте Федерального реабилитационного центра.
Исследовать вопрос подробнее – лечение наркомании и алкоголизма краснодар
Незамедлительно после вызова нарколог прибывает на дом для проведения тщательного осмотра. На данном этапе специалист собирает анамнез, измеряет жизненно важные показатели — пульс, артериальное давление, температуру — и оценивает степень интоксикации. Эти данные являются основой для составления индивидуального плана лечения.
Исследовать вопрос подробнее – вывод из запоя дешево владимир
Современное общество сталкивается с множеством вызовов, связанных с различными зависимостями, которые наносят серьезный урон как физическому, так и психоэмоциональному состоянию человека. Алкоголизм, наркомания и другие виды зависимости не только нарушают здоровье, но и разрушают личные отношения, затрудняют трудовую деятельность и социальную адаптацию. В наркологической клинике “Сила воли” в Иркутске мы предлагаем профессиональную помощь в лечении зависимости и проведении реабилитационных мероприятий, направленных на восстановление здоровья и социальной интеграции пациентов.
Получить дополнительные сведения – капельница от запоя на дому иркутск.
В-третьих, поддержка является критически важным компонентом на пути к выздоровлению. Мы предлагаем программы, которые продолжаются даже после завершения основного курса лечения. Пациенты имеют возможность участвовать в регулярных встречах, где они могут делиться своими успехами и получать помощь от специалистов.
Подробнее тут – vyzvat-kapelniczu-ot-zapoya irkutsk
Достаточно связаться по телефону или через мессенджер и сообщить минимальный набор данных — имя и адрес. Все остальные детали обсуждаются устно, без фиксации на бумаге.
Подробнее можно узнать тут – chastnaya narkologicheskaya klinika ekaterinburg
После поступления звонка нарколог оперативно выезжает по указанному адресу и прибывает в течение 30–60 минут. Врач незамедлительно приступает к оказанию помощи по четко отработанному алгоритму, состоящему из следующих этапов:
Подробнее можно узнать тут – вызов врача нарколога на дом воронеж
Затем врач составляет индивидуальную схему детоксикации и вводит пациенту капельницу с препаратами, которые помогают эффективно очистить организм, восстановить функции сердца, печени и нервной системы. Процедура занимает от 40 минут до 2 часов в зависимости от состояния пациента.
Детальнее – https://kapelnica-ot-zapoya-moskva000.ru/kapelnicza-ot-zapoya-na-domu-msk/
В малых группах пациенты учатся взаимодействию и поддержке друг друга, что укрепляет мотивацию. Арт-терапевтические занятия помогают выразить эмоции через творчество и снизить уровень внутреннего напряжения.
Подробнее – клиника лечения алкоголизма краснодар
Этот метод направлен на выявление и замену негативных мыслей и стереотипов поведения, связанных с потреблением алкоголя. Пациент учится отслеживать свои эмоциональные реакции и заменять деструктивные установки конструктивными стратегиями противостояния стрессу.
Подробнее – https://lechenie-alkogolizma-sochi0.ru/klinika-lecheniya-alkogolizma-v-sochi/
Для начала комплексного лечения в наркологической клинике в Краснодаре проводится тщательная диагностика состояния пациента. Врач-нарколог назначает необходимые лабораторные и инструментальные исследования, среди которых общий анализ крови, биохимический анализ, ЭКГ, УЗИ внутренних органов, а также психодиагностические тесты. Такой комплексный подход позволяет выявить сопутствующие заболевания и оценить степень зависимости, что важно для выбора оптимальной терапии.
Исследовать вопрос подробнее – наркологическая клиника нарколог в краснодаре
Системы автоматизированного дозирования обеспечивают точное введение медикаментов, что минимизирует риск побочных эффектов. Постоянный мониторинг жизненно важных показателей позволяет врачу корректировать терапию в режиме реального времени, гарантируя безопасность процедуры.
Ознакомиться с деталями – http://vyvod-iz-zapoya-vladimir0.ru/vyvod-iz-zapoya-na-domu-vladimir/https://vyvod-iz-zapoya-vladimir0.ru
Услуга выезда направлена на первичное стабилизирующее лечение при запое или наркотической интоксикации без необходимости госпитализации. Вызов выполняется в пределах города и пригорода максимум за 60 минут.
Получить дополнительную информацию – частная наркологическая клиника краснодарский край
Когда запой становится критическим, оперативное вмешательство имеет решающее значение для спасения здоровья и предотвращения необратимых последствий. Во Владимире экстренная помощь нарколога на дому позволяет быстро начать лечение, не требуя госпитализации, что особенно важно для пациентов, нуждающихся в сохранении конфиденциальности и комфорте.
Получить дополнительную информацию – http://vyvod-iz-zapoya-vladimir000.ru/
Запой — опасное состояние, связанное с длительным и бесконтрольным употреблением алкоголя, которое требует срочного медицинского вмешательства. Обычные методы самолечения не способны обеспечить полноценную очистку организма от токсинов и стабилизацию состояния пациента. Наиболее эффективным и безопасным способом является постановка капельницы от запоя на дому под контролем профессионального врача.
Выяснить больше – после капельницы от запоя москва
Наши специалисты используют проверенные медикаменты, которые подбираются индивидуально для каждого пациента:
Получить дополнительную информацию – нарколог на дом недорого воронеж
Во-вторых, реабилитация является неотъемлемой частью нашего подхода. Мы понимаем, что избавление от физической зависимости — это только первый шаг. Важной задачей является восстановление социального статуса, создание новых привычек и умение управлять своей жизнью без наркотиков или алкоголя. Наша клиника предлагает групповые и индивидуальные занятия, направленные на изменение поведения и мышления.
Выяснить больше – капельница от запоя на дому цена иркутск
Каждый день запоя увеличивает риск для жизни. Не рискуйте — специалисты в Люберцах приедут на дом и окажут экстренную помощь. Без боли, стресса и ожидания.
Подробнее можно узнать тут – врач на дом капельница от запоя в люберцах
Каждый пациент получает персонализированную программу, учитывающую стадию заболевания, сопутствующие патологии и социальный статус. На основании анализа состояния назначается оптимальная терапия, что значительно повышает эффективность лечения. Врач-нарколог подбирает препараты с учетом индивидуальной переносимости, а психотерапевт разрабатывает план психологической поддержки.
Получить больше информации – наркология лечение алкоголизма
В клинике применяются инновационные методы диагностики, включая лабораторные анализы и аппаратные исследования, которые позволяют выявить степень зависимости и сопутствующие патологии. Важным этапом является комплексный подход к лечению, включающий детоксикацию организма, психотерапию и медикаментозную поддержку.
Выяснить больше – http://narkologicheskaya-klinika-krasnodar00.ru/chastnaya-narkologicheskaya-klinika-v-krasnodare/
После основной терапии важно обеспечить поддержку пациента в период реабилитации. Реабилитационные программы в Краснодаре включают социальную адаптацию, восстановление навыков общения и трудоустройства. Это позволяет минимизировать риск рецидива и возвращения к употреблению алкоголя. Поддержка со стороны специалистов и близких — обязательное условие успешного результата. Более подробно о социальной реабилитации можно ознакомиться на сайте Федерального реабилитационного центра.
Углубиться в тему – центр лечения алкоголизма в краснодаре
Пациенты клиники «НаркоМед» полностью застрахованы от утечки личной информации. Приём и лечение оформляются по псевдониму, документы не передаются в другие организации.
Подробнее тут – наркологическая клиника цены
Когда организм на пределе, важна срочная помощь в Люберцах — это команда опытных наркологов, которые помогут быстро и мягко выйти из запоя без вреда для здоровья.
Выяснить больше – вызов нарколога на дом в люберцах
Этот метод направлен на выявление и замену негативных мыслей и стереотипов поведения, связанных с потреблением алкоголя. Пациент учится отслеживать свои эмоциональные реакции и заменять деструктивные установки конструктивными стратегиями противостояния стрессу.
Получить дополнительные сведения – анонимное лечение алкоголизма сочи
Алкогольная зависимость — хроническое заболевание, требующее комплексного подхода. В клинике «КубаньМед» в Краснодаре разработаны авторские методики, направленные на полное преодоление зависимости и возвращение пациента к полноценной жизни. Мы предлагаем индивидуальные программы лечения, сочетающие медикаментозную детоксикацию, специализированные реабилитационные процедуры и профессиональные психологические консультации. Всё это в условиях полного комфорта и абсолютной конфиденциальности.
Детальнее – лечение наркомании и алкоголизма в краснодаре
Лечение в наркологической клинике в Краснодаре строится на комплексном подходе, включающем медикаментозную терапию, психотерапевтическую помощь и социальную реабилитацию. Медикаментозное лечение направлено на детоксикацию организма и снижение симптомов абстиненции, что позволяет значительно улучшить состояние пациента в первые дни терапии. Современные препараты, применяемые в лечении зависимости, сертифицированы и соответствуют международным стандартам, что подтверждается на сайте Всемирной организации здравоохранения.
Получить дополнительные сведения – https://narkologicheskaya-klinika-krasnodar0.ru/narkologicheskaya-klinika-anonimno-krasnodar/
В нашей клинике “Сила воли” в Иркутске вы можете получить помощь как в стационаре, так и на дому. Мы предлагаем два вида услуг:
Подробнее можно узнать тут – https://kapelnica-ot-zapoya-irkutsk3.ru/kapelnica-ot-zapoya-na-domu-v-irkutske/
Первое, на что стоит обратить внимание — это профессиональный уровень сотрудников. Без квалифицированных наркологов, клинических психологов и психиатров реабилитационный процесс становится формальным и неэффективным.
Ознакомиться с деталями – наркологическая клиника нарколог
Когда запой становится критическим, оперативное вмешательство имеет решающее значение для спасения здоровья и предотвращения необратимых последствий. Во Владимире экстренная помощь нарколога на дому позволяет быстро начать лечение, не требуя госпитализации, что особенно важно для пациентов, нуждающихся в сохранении конфиденциальности и комфорте.
Подробнее тут – вывод из запоя стационар владимир
Системы автоматизированного дозирования обеспечивают точное введение медикаментов, что минимизирует риск побочных эффектов. Постоянный мониторинг жизненно важных показателей позволяет врачу корректировать терапию в режиме реального времени, гарантируя безопасность процедуры.
Получить дополнительную информацию – vyvod-iz-zapoya-vladimir0.ru/
Услуга выезда направлена на первичное стабилизирующее лечение при запое или наркотической интоксикации без необходимости госпитализации. Вызов выполняется в пределах города и пригорода максимум за 60 минут.
Подробнее – частная наркологическая клиника сочи.
Эта публикация дает возможность задействовать различные источники информации и представить их в удобной форме. Читатели смогут быстро найти нужные данные и получить ответы на интересующие их вопросы. Мы стремимся к четкости и доступности материала для всех!
Узнать напрямую – https://vistoweekly.com/what-is-the-concept-of-wave-of-happy
Предлагаем вашему вниманию интересную справочную статью, в которой собраны ключевые моменты и нюансы по актуальным вопросам. Эта информация будет полезна как для профессионалов, так и для тех, кто только начинает изучать тему. Узнайте ответы на важные вопросы и расширьте свои знания!
Ознакомьтесь с аналитикой – https://mealpe.app/the-rise-of-food-courts-in-india
Публикация предлагает уникальную подборку информации, которая будет интересна как специалистам, так и широкому кругу читателей. Здесь вы найдете ответы на часто задаваемые вопросы и полезные инсайты для дальнейшего применения.
Обратиться к источнику – https://www.lean-tech.co.jp/2024/07/31/hello-world
Этот информативный текст выделяется своими захватывающими аспектами, которые делают сложные темы доступными и понятными. Мы стремимся предложить читателям глубину знаний вместе с разнообразием интересных фактов. Откройте новые горизонты и развивайте свои способности познавать мир!
Ознакомиться с полной информацией – https://www.zakcpa.com/building-2
Этот увлекательный информационный материал подарит вам массу новых знаний и ярких эмоций. Мы собрали для вас интересные факты и сведения, которые обогатят ваш опыт. Откройте для себя увлекательный мир информации и насладитесь процессом изучения!
Лучшее решение — прямо здесь – https://topic.lk/14310
Публикация приглашает вас исследовать неизведанное — от древних тайн до современных достижений науки. Вы узнаете, как случайные находки превращались в революции, а смелые мысли — в новые эры человеческого прогресса.
Продолжить изучение – https://ibmnews.com/gubernur-usulkan-1-503-formasi-casn-2024-ke-bkn
Эта статья для ознакомления предлагает читателям общее представление об актуальной теме. Мы стремимся представить ключевые факты и идеи, которые помогут читателям получить представление о предмете и решить, стоит ли углубляться в изучение.
Выяснить больше – https://manufacturingtradingbv.com/the-significance-of-the-sound-of-shofar
Эта обзорная заметка содержит ключевые моменты и факты по актуальным вопросам. Она поможет читателям быстро ориентироваться в теме и узнать о самых важных аспектах сегодня. Получите краткий курс по современной информации и оставайтесь в курсе событий!
Более того — здесь – http://komsmama.ru
Эта статья для ознакомления предлагает читателям общее представление об актуальной теме. Мы стремимся представить ключевые факты и идеи, которые помогут читателям получить представление о предмете и решить, стоит ли углубляться в изучение.
Изучить вопрос глубже – https://hussamsultanco.com/packmn
Независимо от формы зависимости — алкогольной, опиатной, синтетической или медикаментозной — специалисты подбирают индивидуальный курс терапии. Алгоритмы лечения адаптируются под возраст, стаж употребления, общее состояние организма и наличие сопутствующих заболеваний.
Исследовать вопрос подробнее – наркологические клиники алкоголизм в ярославле
В этой публикации мы предлагаем подробные объяснения по актуальным вопросам, чтобы помочь читателям глубже понять их. Четкость и структурированность материала сделают его удобным для усвоения и применения в повседневной жизни.
Секреты успеха внутри – https://connectpoint.tv/your-worship-says-a-lot-pastor-glover
Эта публикация дает возможность задействовать различные источники информации и представить их в удобной форме. Читатели смогут быстро найти нужные данные и получить ответы на интересующие их вопросы. Мы стремимся к четкости и доступности материала для всех!
Обратиться к источнику – https://pipoca.org/journey-to-the-amazon-the-orphanage/olympus-digital-camera-6
Этот информативный текст выделяется своими захватывающими аспектами, которые делают сложные темы доступными и понятными. Мы стремимся предложить читателям глубину знаний вместе с разнообразием интересных фактов. Откройте новые горизонты и развивайте свои способности познавать мир!
Все материалы собраны здесь – https://www.dantesfoto.it/the-road-less-travelled
Этот текст сочетает в себе элементы познавательного рассказа и аналитической подачи информации. Читатель получает доступ к уникальным данным, которые соединяют прошлое с настоящим и открывают двери в будущее.
Подробная информация доступна по запросу – https://praytravel.com/hac-ve-umre-nedir
Публикация приглашает вас исследовать неизведанное — от древних тайн до современных достижений науки. Вы узнаете, как случайные находки превращались в революции, а смелые мысли — в новые эры человеческого прогресса.
Узнай первым! – https://movieseffect.net/movie/beast-2022-2
В этой информационной статье вы найдете интересное содержание, которое поможет вам расширить свои знания. Мы предлагаем увлекательный подход и уникальные взгляды на обсуждаемые темы, побуждая пользователей к активному мышлению и критическому анализу.
Осуществить глубокий анализ – https://bunaro.ru
В этой статье вы найдете познавательную и занимательную информацию, которая поможет вам лучше понять мир вокруг. Мы собрали интересные данные, которые вдохновляют на размышления и побуждают к действиям. Открывайте новую информацию и получайте удовольствие от чтения!
Смотрите также… – https://eastleighdivingclub.co.uk/introducing-new-styles-of-football-soccer
Эта информационная заметка содержит увлекательные сведения, которые могут вас удивить! Мы собрали интересные факты, которые сделают вашу жизнь ярче и полнее. Узнайте нечто новое о привычных аспектах повседневности и откройте для себя удивительный мир информации.
Только для своих – https://boshcornerstone.org/emergency-electrical-repairs-what-to-do-before-the-pros-arrive
Мы предлагаем полный цикл наркологической помощи — от экстренного вывода из запоя до длительной реабилитации. Ниже перечислены основные направления работы клиники.
Детальнее – частная наркологическая клиника волгоград
В этом обзорном материале представлены увлекательные детали, которые находят отражение в различных аспектах жизни. Мы исследуем непонятные и интересные моменты, позволяя читателю увидеть картину целиком. Погрузитесь в мир знаний и удивительных открытий!
Получить исчерпывающие сведения – https://masterhub.de/product/saepe-consequat-placeat
Эта статья для ознакомления предлагает читателям общее представление об актуальной теме. Мы стремимся представить ключевые факты и идеи, которые помогут читателям получить представление о предмете и решить, стоит ли углубляться в изучение.
Обратитесь за информацией – http://imacin.ru
Наркологическая клиника «ЧелябДоктор» специализируется на экстренной и плановой детоксикации пациентов с алкогольной зависимостью. Наши главные преимущества:
Подробнее можно узнать тут – http://kapelnica-ot-zapoya-chelyabinsk13.ru
В клинике применяются комплексные программы, включающие медицинскую детоксикацию, психотерапевтическую поддержку и социальную реабилитацию. Медицинская детоксикация проводится с использованием современных препаратов и методик, что позволяет снизить тяжесть абстинентного синдрома и минимизировать риски для здоровья пациента. Подробнее о методах детоксикации можно узнать на официальном портале Министерства здравоохранения России.
Углубиться в тему – https://narkologicheskaya-klinika-chelyabinsk13.ru
Алкогольная зависимость — одна из самых распространенных проблем нашего времени, требующая немедленного и грамотного вмешательства. В Екатеринбурге капельница от запоя является одним из самых популярных и действенных методов восстановления после длительного употребления алкоголя. Она помогает организму справиться с интоксикацией, восстанавливает физическое и эмоциональное состояние пациента, улучшает самочувствие в короткие сроки. При этом лечение может быть организовано как в стационаре, так и на дому, в зависимости от удобства пациента.
Изучить вопрос глубже – капельница от запоя клиника в екатеринбурге
Запой – это серьезная угроза для здоровья. Немедленно вызывайте нарколога на дом в Волгограде! Нарколог приедет к вам быстро, сохранит анонимность и подберет индивидуальное лечение. Мы быстро выведем токсины и вернем вам хорошее самочувствие. В любое время дня и ночи мы готовы приехать и начать лечение. Мы сочетаем медикаменты и психологическую поддержку для успешного лечения. Первый этап лечения – избавление от токсинов с помощью лекарств.
Подробнее – https://vyvod-iz-zapoya-volgograd00.ru/vyvod-iz-zapoya-na-domu-volgograd
Сильная тошнота, рвота, дезориентация и судорожные сокращения мышц свидетельствуют о критическом уровне алкоголя в крови. В этих ситуациях промедление повышает риск острого панкреатита, комы и сердечных аритмий.
Ознакомиться с деталями – вывод из запоя челябинская область
Для оценки и дальнейшего ведения пациентов важна тесная связь с профильными реабилитационными центрами. В Челябинске широко представлены специализированные учреждения, такие как Реабилитационный центр «Новая Жизнь», где проводится комплексное восстановление пациентов после вывода из запоя и снятия острой интоксикации.
Изучить вопрос глубже – вызвать нарколога на дом челябинск
Зависимость от алкоголя или наркотиков — серьёзная проблема, требующая немедленного вмешательства квалифицированных специалистов. Если у вас или вашего близкого возникли признаки тяжелого похмелья, запоя или интоксикации, клиника «НаркологПлюс» предлагает услугу вызова нарколога на дом в Санкт-Петербурге. Наши врачи оперативно прибывают по указанному адресу, оказывают всю необходимую медицинскую помощь и помогают пациенту быстро вернуться к нормальной жизни.
Ознакомиться с деталями – https://narcolog-na-dom-sankt-peterburg00.ru/narkolog-na-dom-czena-spb
Применяются растворы на основе физраствора, глюкозы, витаминов группы B, противорвотных, седативных и гепатопротекторов. Используемые препараты входят в реестр разрешённых лекарств.
Подробнее тут – https://narcolog-na-dom-ekaterinburg55.ru/narkolog-na-dom-kruglosutochno-v-ekaterinburge
Проблемы с алкоголем или наркотиками могут застать врасплох и привести к серьезным последствиям для организма, психического состояния и жизни пациента. Самостоятельные попытки выйти из запоя или преодолеть абстинентный синдром без медицинской поддержки редко оказываются эффективными и могут представлять реальную опасность для здоровья. Именно в таких ситуациях клиника «АльфаНаркология» предлагает услугу вызова нарколога на дом в Санкт-Петербурге и Ленинградской области. Наши специалисты оперативно реагируют на обращение, оказывают квалифицированную помощь и обеспечивают полную конфиденциальность лечения.
Ознакомиться с деталями – врач нарколог на дом ленинградская область
Врач-нарколог проводит комплексное обследование пациента, оценивая степень зависимости и общее состояние организма. В ходе первичного осмотра специалист не только определяет тяжесть алкогольной зависимости, но и выявляет сопутствующие патологии, которые могут повлиять на процесс лечения. Обследование включает лабораторные анализы, электрокардиограмму и другие необходимые диагностические процедуры. Врач тщательно изучает анамнез для выявления возможных противопоказаний к определенным методам терапии. Особое внимание уделяется психологическим аспектам, которые могли способствовать формированию зависимости, что помогает разработать эффективную программу лечения.
Изучить вопрос глубже – https://vyvod-iz-zapoya-krasnoyarsk55.ru/vyvod-iz-zapoya-krasnoyarsk-kruglosutochno
В «ВолгаМед» работают врачи-наркологи, психотерапевты и реабилитологи с опытом от 5 до 20 лет. Каждый специалист регулярно проходит повышение квалификации, участвует в научных конференциях и владеет современными методами диагностики и лечения зависимостей.
Изучить вопрос глубже – наркологическая клиника в волгограде
Индивидуализация лечения: Каждый случай рассматривается отдельно, учитывая уникальные особенности пациента, его физическое состояние, предшествующий опыт лечения и социальные факторы. Такой подход позволяет создать максимально эффективный план терапии.
Получить дополнительные сведения – вывод из запоя на дому цена
Основными направлениями работы нашей клиники являются.
Углубиться в тему – http://нарко-специалист.рф/
Запой – это очень опасно! Круглосуточная помощь нарколога в Волгоградской области – ваш шанс выжить. Мы оказываем помощь круглосуточно, чтобы вы могли начать лечение в любой момент. Мы обеспечиваем оперативное вмешательство, индивидуальный подход и высокий уровень безопасности. Служба круглосуточного вывода из запоя работает оперативно и надежно. При ухудшении состояния, мы готовы выехать на дом или принять вас в клинике для детоксикации. Начинаем с диагностики: сбор анамнеза, измерение показателей и оценка степени интоксикации.
Детальнее – вывод из запоя в волгограде
На этом этапе врач детально выясняет, как долго продолжается запой, какие симптомы наблюдаются, и имеются ли сопутствующие заболевания. Точный анализ информации помогает оперативно определить степень интоксикации и подобрать оптимальные методы детоксикации, что является ключом к предотвращению дальнейших осложнений.
Получить дополнительную информацию – врач нарколог на дом рязань
Наркологическая помощь на дому становится всё более востребованной благодаря своей доступности, конфиденциальности и эффективности. Клиника «МедТрезвость» предлагает пациентам целый ряд важных преимуществ:
Разобраться лучше – нарколог на дом недорого
Заключительная фаза реабилитации фокусируется на обучении пациента жизни без алкоголизма и развитии навыков преодоления жизненных трудностей естественным путем. В рамках этого этапа пациенты активно участвуют в специализированных программах, нацеленных на восстановление утраченных социальных связей и профессиональных компетенций. Программа включает трудотерапию, образовательные курсы и тематические семинары. Особое внимание уделяется работе с семьей: родственники проходят специальное обучение, помогающее им лучше понимать особенности зависимости быстро и эффективно оказывать поддержку близкому человеку.
Получить больше информации – https://vyvod-iz-zapoya-krasnoyarsk55.ru/vyvod-iz-zapoya-na-domu-krasnoyarsk/
Мы работаем по следующим основным направлениям.
Получить дополнительные сведения – http://narko-zakodirovat.ru/vivod-iz-zapoya-na-domu-v-tveri/
Алкогольная зависимость требует быстрого и квалифицированного вмешательства, поскольку она может привести к тяжелым последствиям для здоровья. Капельница от запоя — один из наиболее эффективных методов, помогающих вывести организм из состояния алкогольной интоксикации и восстановить нормальное самочувствие. В Екатеринбурге эта процедура доступна как в медицинских учреждениях, так и на дому, что позволяет пациентам выбрать наиболее удобный и комфортный способ лечения.
Углубиться в тему – https://kapelnica-ot-zapoya-ektb55.ru/
Когда состояние пациента критическое и невозможно транспортировать его в стационар, мы оказываем помощь на дому:
Подробнее – наркологическая клиника волгоград
Врач-нарколог проводит комплексное обследование пациента, оценивая степень зависимости и общее состояние организма. В ходе первичного осмотра специалист не только определяет тяжесть алкогольной зависимости, но и выявляет сопутствующие патологии, которые могут повлиять на процесс лечения. Обследование включает лабораторные анализы, электрокардиограмму и другие необходимые диагностические процедуры. Врач тщательно изучает анамнез для выявления возможных противопоказаний к определенным методам терапии. Особое внимание уделяется психологическим аспектам, которые могли способствовать формированию зависимости, что помогает разработать эффективную программу лечения.
Подробнее тут – http://vyvod-iz-zapoya-krasnoyarsk55.ru/
Запой – это серьезная угроза для здоровья. Немедленно вызывайте нарколога на дом в Волгограде! Нарколог приедет к вам быстро, сохранит анонимность и подберет индивидуальное лечение. Мы быстро выведем токсины и вернем вам хорошее самочувствие. В любое время дня и ночи мы готовы приехать и начать лечение. Мы сочетаем медикаменты и психологическую поддержку для успешного лечения. Первый этап лечения – избавление от токсинов с помощью лекарств.
Получить дополнительные сведения – http://vyvod-iz-zapoya-volgograd00.ru
Вызов врача-нарколога на дом актуален в ситуациях, когда пациенту требуется срочная медицинская помощь, но его состояние не позволяет самостоятельно обратиться в клинику. Основными причинами вызова нарколога на дом являются:
Узнать больше – https://narcolog-na-dom-sankt-peterburg00.ru/
Вызывать нарколога на дом рекомендуется при следующих состояниях:
Подробнее – нарколог на дом цена
В условиях современного общества наркомания и алкоголизм стали актуальными и серьезными проблемами, затрагивающими не только индивидуумов, но и их семьи, сообщества. Эти заболевания не просто влияют на физическое здоровье, они наносят урон психоэмоциональному состоянию, нарушают социальные связи и ухудшают качество жизни. Наркологический центр “Новый горизонт” предлагает целостный и научно обоснованный подход к лечению зависимостей от психоактивных веществ. Мы применяем современные методы диагностики и терапии, чтобы помочь каждому пациенту обрести здоровье и вернуть себе полноценную жизнь.
Получить дополнительные сведения – вывод из запоя цена
В состав капельницы обычно входят растворы для гидратации, витаминно-минеральные комплексы, гепатопротекторы для защиты печени, а также седативные препараты для стабилизации нервной системы. Такой подход позволяет быстро справиться с признаками похмелья и предотвратить развитие более серьезных осложнений.
Подробнее – https://kapelnica-ot-zapoya-ekb55.ru/kapelnicza-ot-zapoya-v-stacionare-ekaterinburg
Запой – это опасная стадия! В Волгоградской области нарколог поможет круглосуточно! Мы всегда на связи, чтобы помочь вам справиться с запоем. Мы предлагаем быстрое, безопасное и индивидуальное лечение. Наша служба вывода из запоя работает четко и без сбоев. Мы предлагаем детоксикацию и стабилизацию состояния в любом месте. Мы начинаем с диагностики, чтобы понять, как лучше вам помочь.
Получить больше информации – вывод из запоя волгоград
Таким образом, наша миссия направлена на создание устойчивых изменений в жизни каждого пациента, поддерживая его на всех этапах пути к выздоровлению.
Получить больше информации – http://нарко-специалист.рф
Своевременное вмешательство позволяет снизить концентрацию токсинов, нормализовать обмен веществ и предотвратить необратимые повреждения, что делает срочный вызов нарколога на дому жизненно необходимым.
Изучить вопрос глубже – вызов врача нарколога на дом
Современный ритм жизни, стрессы, давление окружающей среды, наследственные и социальные факторы — всё это может стать причиной возникновения химической зависимости. Алкоголизм и наркомания — заболевания, с которыми сталкиваются люди любых возрастов и социальных статусов. Важно понимать: зависимость — это не признак слабости, а хроническое заболевание, которое требует профессионального медицинского вмешательства. В наркологической клинике «Наркология 24/7» в Люберцах организована комплексная наркологическая помощь с выездом врача на дом, анонимностью, круглосуточной поддержкой и индивидуальным подходом к каждому пациенту.
Получить дополнительные сведения – narkologicheskaya-pomoshch-na-domu-lyubercy
В «ЧелябДокторе» применяются комбинированные схемы, основанные на доказательной медицине и новейших разработках:
Подробнее тут – http://kapelnica-ot-zapoya-chelyabinsk13.ru
Лечение начинается с обязательной консультации врача-нарколога. На этом этапе специалист подробно выясняет особенности употребления, продолжительность зависимости, наличие хронических и сопутствующих заболеваний, а также психоэмоциональное состояние пациента. Диагностика позволяет выбрать максимально эффективную и безопасную методику кодирования.
Исследовать вопрос подробнее – клиника кодирования от алкоголизма
Наши специалисты применяют только сертифицированные и проверенные препараты. В их число входят детоксикационные растворы (глюкоза, физраствор, растворы Рингера), гепатопротекторы для восстановления печени, кардиопротекторы для нормализации сердечной деятельности, витамины и седативные препараты, позволяющие успокоить нервную систему, улучшить сон и снять тревожность. Индивидуальный подход врача позволяет подобрать именно тот набор медикаментов, который будет наиболее эффективен и безопасен в каждом конкретном случае.
Исследовать вопрос подробнее – нарколог на дом вывод в санкт-петербурге
Каждый пациент получает внимание, соответствующее его уникальным потребностям, что способствует максимальной эффективности в лечении.
Исследовать вопрос подробнее – вывод из запоя тверь.
Применяются растворы на основе физраствора, глюкозы, витаминов группы B, противорвотных, седативных и гепатопротекторов. Используемые препараты входят в реестр разрешённых лекарств.
Выяснить больше – нарколог на дом срочно в екатеринбурге
После процедуры даются рекомендации по восстановлению, при необходимости оформляется поддержка по реабилитации, выдается памятка для пациента и родственников. При сложных состояниях может быть рекомендована госпитализация в стационар.
Узнать больше – https://vyvod-iz-zapoya-himki5.ru/anonimnyj-vyvod-iz-zapoya-v-himkah
В клинике «Решение+» предусмотрены оба основных формата: выезд на дом и лечение в стационаре. Домашний вариант подойдёт тем, чьё состояние относительно стабильно, нет риска тяжёлых осложнений. Врач приезжает с полным комплектом оборудования и медикаментов, проводит капельницу на дому и даёт инструкции по дальнейшему уходу.
Подробнее можно узнать тут – http://vyvod-iz-zapoya-noginsk5.ru/
Мы предлагаем полный цикл наркологической помощи — от экстренного вывода из запоя до длительной реабилитации. Ниже перечислены основные направления работы клиники.
Получить дополнительные сведения – http://narkologicheskaya-klinika-volgograd13.ru
Зависимость от алкоголя или наркотиков — серьёзная проблема, которая постепенно разрушает жизнь, подрывает здоровье, нарушает семейные отношения и ведёт к социальной изоляции. Попытки самостоятельно справиться с заболеванием редко приводят к успеху и зачастую только усугубляют ситуацию. Важно не терять время и обращаться за профессиональной помощью. В наркологической клинике «Наркосфера» в Балашихе пациентов ждёт современное оборудование, команда опытных специалистов, индивидуальный подход и абсолютная анонимность.
Исследовать вопрос подробнее – http://www.domen.ru
Врач-нарколог проводит комплексное обследование пациента, оценивая степень зависимости и общее состояние организма. В ходе первичного осмотра специалист не только определяет тяжесть алкогольной зависимости, но и выявляет сопутствующие патологии, которые могут повлиять на процесс лечения. Обследование включает лабораторные анализы, электрокардиограмму и другие необходимые диагностические процедуры. Врач тщательно изучает анамнез для выявления возможных противопоказаний к определенным методам терапии. Особое внимание уделяется психологическим аспектам, которые могли способствовать формированию зависимости, что помогает разработать эффективную программу лечения.
Изучить вопрос глубже – вывод из запоя на дому красноярск.
Наркологическая клиника в Челябинске предоставляет полный спектр медицинских услуг по диагностике, лечению и реабилитации пациентов с зависимостями различной этиологии. Современные методы терапии, применяемые в клинике, направлены на безопасное и эффективное избавление от наркотической и алкогольной зависимости, а также сопутствующих психических и соматических осложнений.
Подробнее – http://narkologicheskaya-klinika-chelyabinsk13.ru/chastnaya-narkologicheskaya-klinika-chelyabinsk/
Врач назначает комплекс препаратов для нормализации состояния и устранения интоксикации. Применяются детоксикационные средства для очищения организма и облегчения абстинентного синдрома. Важным компонентом терапии являются витаминные комплексы и минералы, восстанавливающие метаболический баланс. При необходимости назначаются седативные препараты для снижения тревожности и нормализации сна. Также используются гепатопротекторы и другие средства для поддержки органов, пострадавших от алкогольной интоксикации.
Узнать больше – вывод из запоя на дому
Теряете контроль над алкоголем? Экстренная помощь нарколога на дому в Волгограде – это выход! Лечитесь дома! Это быстро, удобно, анонимно и эффективно. Быстрая детоксикация – первый шаг к выздоровлению! Мы работаем 24/7, чтобы вы могли получить помощь в любой ситуации. Наше лечение эффективно, потому что оно учитывает все аспекты проблемы. Сначала нужно очистить организм от алкоголя, и мы вам в этом поможем.
Разобраться лучше – наркология вывод из запоя волгоград
Вызов врача-нарколога на дом в Санкт-Петербурге начинается с детального осмотра и оценки состояния пациента. Врач измеряет давление, пульс, уровень кислорода в крови и определяет степень интоксикации.
Выяснить больше – нарколог на дом анонимно в санкт-петербурге
Проблемы с алкоголем или наркотиками могут застать врасплох и привести к серьезным последствиям для организма, психического состояния и жизни пациента. Самостоятельные попытки выйти из запоя или преодолеть абстинентный синдром без медицинской поддержки редко оказываются эффективными и могут представлять реальную опасность для здоровья. Именно в таких ситуациях клиника «АльфаНаркология» предлагает услугу вызова нарколога на дом в Санкт-Петербурге и Ленинградской области. Наши специалисты оперативно реагируют на обращение, оказывают квалифицированную помощь и обеспечивают полную конфиденциальность лечения.
Разобраться лучше – нарколог на дом срочно
В условиях современного общества наркомания и алкоголизм стали актуальными и серьезными проблемами, затрагивающими не только индивидуумов, но и их семьи, сообщества. Эти заболевания не просто влияют на физическое здоровье, они наносят урон психоэмоциональному состоянию, нарушают социальные связи и ухудшают качество жизни. Наркологический центр “Новый горизонт” предлагает целостный и научно обоснованный подход к лечению зависимостей от психоактивных веществ. Мы применяем современные методы диагностики и терапии, чтобы помочь каждому пациенту обрести здоровье и вернуть себе полноценную жизнь.
Исследовать вопрос подробнее – вывод из запоя на дому круглосуточно симферополь
Своевременный вызов нарколога позволяет снизить риски осложнений, таких как судорожный синдром, панкреатит или сердечная недостаточность, часто сопровождающие тяжелое алкогольное или наркотическое отравление. По данным исследований, раннее вмешательство сокращает сроки госпитализации и улучшает прогнозы выздоровления.
Подробнее тут – нарколог на дом недорого в челябинске
Наша клиника работает по стандартам международного уровня, сочетая научно обоснованные методики с внимательным отношением к каждому пациенту. В «ВолгаМед» вы не столкнётесь с бюрократией или очередями — помощь оказывается сразу после обращения, а все процедуры проводятся в строгом соответствии с медицинскими протоколами и этическими нормами.
Углубиться в тему – https://narkologicheskaya-klinika-volgograd13.ru/chastnaya-narkologicheskaya-klinika-volgograd/
Запой — это длительный приступ непрерывного употребления алкоголя, когда человек теряет контроль над количеством выпиваемого, что приводит к серьёзному отравлению организма. Нарушение водно-солевого баланса, угнетение центральной нервной системы и риск сердечно-сосудистых осложнений требуют немедленного вмешательства. В Челябинске клиника «ЧелябМед» предлагает круглосуточную неотложную помощь на дому и в условиях стационара, гарантируя полную анонимность и комфорт пациенту.
Разобраться лучше – вывод из запоя клиника в челябинске
Запой – это очень опасно! Круглосуточная помощь нарколога в Волгоградской области – ваш шанс выжить. Мы оказываем помощь круглосуточно, чтобы вы могли начать лечение в любой момент. Мы обеспечиваем оперативное вмешательство, индивидуальный подход и высокий уровень безопасности. Служба круглосуточного вывода из запоя работает оперативно и надежно. При ухудшении состояния, мы готовы выехать на дом или принять вас в клинике для детоксикации. Начинаем с диагностики: сбор анамнеза, измерение показателей и оценка степени интоксикации.
Подробнее тут – вывод из запоя в волгограде
Врач назначает комплекс препаратов для нормализации состояния и устранения интоксикации. Применяются детоксикационные средства для очищения организма и облегчения абстинентного синдрома. Важным компонентом терапии являются витаминные комплексы и минералы, восстанавливающие метаболический баланс. При необходимости назначаются седативные препараты для снижения тревожности и нормализации сна. Также используются гепатопротекторы и другие средства для поддержки органов, пострадавших от алкогольной интоксикации.
Детальнее – вывод из запоя в красноярске
Современное общество сталкивается с серьёзными вызовами, связанными с зависимостями. Проблемы, возникающие в результате злоупотребления психоактивными веществами, охватывают не только здоровье, но также влияют на социальные отношения и качество жизни. Наркологическая клиника “Точка опоры” предлагает широкий спектр услуг, направленных на восстановление и реабилитацию людей, столкнувшихся с этими трудностями.
Детальнее – вывод из запоя анонимно тверь
Своевременное вмешательство позволяет снизить концентрацию токсинов, нормализовать обмен веществ и предотвратить необратимые повреждения, что делает срочный вызов нарколога на дому жизненно необходимым.
Изучить вопрос глубже – narkolog-na-dom rjazan’
Основными направлениями работы нашей клиники являются.
Подробнее – https://нарко-специалист.рф/vivod-iz-zapoya-cena-v-Ekaterinburge/
Наркологическая помощь на дому становится всё более востребованной благодаря своей доступности, конфиденциальности и эффективности. Клиника «МедТрезвость» предлагает пациентам целый ряд важных преимуществ:
Углубиться в тему – выезд нарколога на дом
В подобных случаях самостоятельное лечение может привести к тяжёлым осложнениям, а промедление — стоить здоровья или даже жизни. Срочная наркологическая помощь — это шаг к безопасности и началу выздоровления.
Подробнее тут – http://narkologicheskaya-pomoshch-lyubercy5.ru
Алкогольная зависимость остаётся одной из самых серьёзных проблем современного общества. Злоупотребление алкоголем разрушает здоровье, негативно влияет на психику, приводит к разрыву семей, потере работы и социального статуса. Когда самостоятельные попытки побороть тягу к спиртному не приносят результата, эффективным выходом становится кодирование от алкоголизма — медицинская процедура, позволяющая на длительный срок блокировать желание употреблять спиртное и начать путь к полноценной жизни. В наркологической клинике «АлкоСвобода» в Мытищах для кодирования применяются только современные, безопасные и признанные методики, которые подбираются индивидуально для каждого пациента с учётом всех особенностей организма.
Исследовать вопрос подробнее – https://kodirovanie-ot-alkogolizma-mytishchi5.ru/kodirovanie-ot-alkogolizma-na-domu-v-mytishchah/
Стоимость капельницы от запоя в Екатеринбурге зависит от нескольких факторов, таких как состав раствора, срочность вызова и место проведения процедуры. Базовый состав включает физраствор, витамины, антиоксиданты и средства для защиты печени, но в случае необходимости могут быть добавлены дополнительные препараты, что увеличивает цену.
Выяснить больше – врача капельницу от запоя в екатеринбурге
После обращения по телефону или через сайт оператор уточняет адрес, состояние пациента и срочность выезда. Врач прибывает в течение 1–2 часов, а в экстренных случаях — в течение часа. На месте специалист проводит первичный осмотр: измеряет давление, пульс, сатурацию, температуру, уточняет длительность запоя, сопутствующие заболевания, особенности реакции на лекарства.
Детальнее – вывод из запоя на дому цена
Запой – это серьезная угроза для здоровья. Немедленно вызывайте нарколога на дом в Волгограде! Нарколог приедет к вам быстро, сохранит анонимность и подберет индивидуальное лечение. Мы быстро выведем токсины и вернем вам хорошее самочувствие. В любое время дня и ночи мы готовы приехать и начать лечение. Мы сочетаем медикаменты и психологическую поддержку для успешного лечения. Первый этап лечения – избавление от токсинов с помощью лекарств.
Подробнее – http://vyvod-iz-zapoya-volgograd00.ru/vyvod-iz-zapoya-kruglosutochno-volgograd/
Обращаясь в «ВолгаМед», вы получаете:
Подробнее – http://narkologicheskaya-klinika-volgograd13.ru
Как подчёркивает главный врач клиники Кондратьев И.Л., «своевременный выезд нарколога на дом снижает риски осложнений и повышает шансы на полное восстановление пациента».
Получить больше информации – нарколог на дом анонимно
Процедура детоксикации занимает от 40 минут до 2 часов. После её завершения врач консультирует пациента и родственников, даёт рекомендации по дальнейшему лечению и профилактике повторных запоев.
Изучить вопрос глубже – narkolog-na-dom sankt-peterburg
Проблемы с алкоголем или наркотиками могут застать врасплох и привести к серьезным последствиям для организма, психического состояния и жизни пациента. Самостоятельные попытки выйти из запоя или преодолеть абстинентный синдром без медицинской поддержки редко оказываются эффективными и могут представлять реальную опасность для здоровья. Именно в таких ситуациях клиника «АльфаНаркология» предлагает услугу вызова нарколога на дом в Санкт-Петербурге и Ленинградской области. Наши специалисты оперативно реагируют на обращение, оказывают квалифицированную помощь и обеспечивают полную конфиденциальность лечения.
Углубиться в тему – нарколог на дом санкт-петербург
Детоксикация проводится в комфортных условиях, под постоянным наблюдением медперсонала. Пациенту назначают инфузионную терапию, препараты для поддержки печени, сердца, нервной системы. При выраженных абстинентных симптомах используются современные методы купирования синдрома — всё под контролем опытных врачей. Важно, что лечение в стационаре позволяет не только быстро купировать симптомы, но и вовремя скорректировать терапию при появлении осложнений.
Подробнее – http://narkologicheskaya-klinika-balashiha5.ru/platnaya-narkologicheskaya-klinika-v-balashihe/https://narkologicheskaya-klinika-balashiha5.ru
Заключительная фаза реабилитации фокусируется на обучении пациента жизни без алкоголизма и развитии навыков преодоления жизненных трудностей естественным путем. В рамках этого этапа пациенты активно участвуют в специализированных программах, нацеленных на восстановление утраченных социальных связей и профессиональных компетенций. Программа включает трудотерапию, образовательные курсы и тематические семинары. Особое внимание уделяется работе с семьей: родственники проходят специальное обучение, помогающее им лучше понимать особенности зависимости быстро и эффективно оказывать поддержку близкому человеку.
Подробнее тут – vyvod-iz-zapoya krasnojarsk
В нашем медицинском центре работают высококвалифицированные специалисты в области наркологии и психиатрии. Все врачи имеют профильное образование, а также опыт работы в клиниках и реабилитационных центрах. Основные преимущества нашей команды:
Исследовать вопрос подробнее – вывод из запоя капельница
Каждый пациент проходит предварительное обследование: экспресс-анализ крови на электролиты, биохимия печени и почек, ЭКГ. На основании результатов врач формирует персональную программу инфузионной терапии.
Исследовать вопрос подробнее – капельница от запоя выезд в челябинске
В некоторых случаях медлить нельзя ни минуты. Запойное состояние чревато обезвоживанием, судорогами, инфарктом, психозом. Если у пациента наблюдаются выраженные физические и психические нарушения, самостоятельное «пережидание» может закончиться тяжёлыми осложнениями.Поводом немедленно обратиться к специалистам становится:
Узнать больше – http://vyvod-iz-zapoya-noginsk5.ru/vyvod-iz-zapoya-stacionar-v-noginske/
Сразу после поступления вызова специалист прибывает на дом для проведения первичного осмотра. На данном этапе нарколог:
Узнать больше – вызвать нарколога на дом в рязани
Современное общество сталкивается с серьёзными вызовами, связанными с зависимостями. Проблемы, возникающие в результате злоупотребления психоактивными веществами, охватывают не только здоровье, но также влияют на социальные отношения и качество жизни. Наркологическая клиника “Точка опоры” предлагает широкий спектр услуг, направленных на восстановление и реабилитацию людей, столкнувшихся с этими трудностями.
Ознакомиться с деталями – http://narko-zakodirovat.ru/vivod-iz-zapoya-v-kruglosutochno-v-tveri/
Игнорирование состояния пациента или попытки самостоятельно справиться с запоем могут привести к опасным последствиям для жизни и здоровья. Поэтому важно своевременно обращаться за профессиональной медицинской помощью.
Получить дополнительную информацию – нарколог на дом вывод из запоя санкт-петербург
Запой – это очень опасно! Круглосуточная помощь нарколога в Волгоградской области – ваш шанс выжить. Мы оказываем помощь круглосуточно, чтобы вы могли начать лечение в любой момент. Мы обеспечиваем оперативное вмешательство, индивидуальный подход и высокий уровень безопасности. Служба круглосуточного вывода из запоя работает оперативно и надежно. При ухудшении состояния, мы готовы выехать на дом или принять вас в клинике для детоксикации. Начинаем с диагностики: сбор анамнеза, измерение показателей и оценка степени интоксикации.
Углубиться в тему – вывод из запоя на дому волгоград недорого
Профессиональная психологическая помощь является фундаментальным элементом в понимании пациентом корней зависимости и инициации процесса восстановления. Квалифицированные психологи проводят персональные и групповые занятия, обучая пациентов эффективному управлению эмоциями и преодолению стрессовых ситуаций без алкоголя. В процессе терапии используются методики когнитивно-поведенческой терапии для изменения деструктивных паттернов мышления. Развитие навыков самоконтроля и укрепление самооценки становятся ключевыми факторами в формировании стойкой мотивации к трезвому образу жизни.
Получить больше информации – вывод из запоя цена
В Наркологической клинике “Новая жизнь” работает команда высококвалифицированных врачей, обладающих значительным опытом в области наркологии и психиатрии. Все специалисты имеют профильное образование и постоянно повышают свою квалификацию, что позволяет им быть в курсе последних достижений в лечении зависимостей.
Подробнее – https://нарко-специалист.рф/vivod-iz-zapoya-cena-v-Ekaterinburge
Когда организм насыщен токсинами, нормальное функционирование органов нарушается. Капельница помогает быстро очистить кровь, восстановить клетки печени и улучшить общее состояние пациента, чтобы как можно быстрее вернуться к привычному уровню жизни.
Получить дополнительные сведения – капельница от запоя вызов в екатеринбурге
В подобных случаях самостоятельное лечение может привести к тяжёлым осложнениям, а промедление — стоить здоровья или даже жизни. Срочная наркологическая помощь — это шаг к безопасности и началу выздоровления.
Ознакомиться с деталями – http://narkologicheskaya-pomoshch-lyubercy5.ru
В клинике «АлкоСвобода» используются только проверенные и признанные медицинским сообществом методы:
Подробнее – https://kodirovanie-ot-alkogolizma-mytishchi5.ru/narkolog-kodirovanie-ot-alkogolizma-v-mytishchah/
Врач назначает комплекс препаратов для нормализации состояния и устранения интоксикации. Применяются детоксикационные средства для очищения организма и облегчения абстинентного синдрома. Важным компонентом терапии являются витаминные комплексы и минералы, восстанавливающие метаболический баланс. При необходимости назначаются седативные препараты для снижения тревожности и нормализации сна. Также используются гепатопротекторы и другие средства для поддержки органов, пострадавших от алкогольной интоксикации.
Исследовать вопрос подробнее – вывод из запоя на дому в красноярске
В этой информационной статье вы найдете интересное содержание, которое поможет вам расширить свои знания. Мы предлагаем увлекательный подход и уникальные взгляды на обсуждаемые темы, побуждая пользователей к активному мышлению и критическому анализу.
Следуйте по ссылке – https://www.puriasia.com/property/villa-naty/villa-naty-gym-2
После процедуры даются рекомендации по восстановлению, при необходимости оформляется поддержка по реабилитации, выдается памятка для пациента и родственников. При сложных состояниях может быть рекомендована госпитализация в стационар.
Исследовать вопрос подробнее – вывод из запоя с выездом
При запое организм отравляется, и нужна экстренная помощь нарколога в Волгограде. Получите квалифицированную помощь на дому, сохраняя конфиденциальность и удобство. Быстрая детоксикация и восстановление здоровья – наша задача. Мы приедем к вам как можно скорее и окажем всю необходимую помощь. Мы подберем лекарства и поможем вам справиться с психологическими проблемами. Начинаем с детоксикации, чтобы очистить организм от вредных веществ.
Углубиться в тему – наркология вывод из запоя волгоград
После поступления вызова нарколог клиники «АльфаНаркология» оперативно выезжает по указанному адресу. На месте врач проводит первичную диагностику, оценивая степень интоксикации, физическое и психологическое состояние пациента. По результатам осмотра врач подбирает индивидуальный комплекс лечебных процедур, в который входит постановка капельницы с растворами для детоксикации, препараты для стабилизации работы органов и нормализации психического состояния.
Узнать больше – http://narcolog-na-dom-sankt-peterburg000.ru
Вызов врача-нарколога на дом актуален в ситуациях, когда пациенту требуется срочная медицинская помощь, но его состояние не позволяет самостоятельно обратиться в клинику. Основными причинами вызова нарколога на дом являются:
Получить дополнительные сведения – вызов врача нарколога на дом
Эта статья предлагает живое освещение актуальной темы с множеством интересных фактов. Мы рассмотрим ключевые моменты, которые делают данную тему важной и актуальной. Подготовьтесь к насыщенному путешествию по неизвестным аспектам и узнайте больше о значимых событиях.
Ознакомиться с деталями – https://a-choicesmagazine.com/?p=2252
Этот интересный отчет представляет собой сборник полезных фактов, касающихся актуальных тем. Мы проанализируем данные, чтобы вы могли сделать обоснованные выводы. Читайте, чтобы узнать больше о последних трендах и значимых событиях!
Погрузиться в детали – https://certifiedmobilenotaryservice.com/certified-mobile-notary-service-5-star-customer-reviews
После обращения оператор клиники уточняет все детали — состояние пациента, стаж запоев, наличие хронических болезней, принимаемые лекарства, аллергии. Далее в течение 30–60 минут на дом выезжает мобильная бригада: врач-нарколог и медсестра со всем необходимым оборудованием и медикаментами.
Подробнее – https://vyvod-iz-zapoya-orekhovo-zuevo4.ru/vyvod-iz-zapoya-stacionar-v-orekhovo-zuevo
В этой публикации мы предлагаем подробные объяснения по актуальным вопросам, чтобы помочь читателям глубже понять их. Четкость и структурированность материала сделают его удобным для усвоения и применения в повседневной жизни.
Переходите по ссылке ниже – https://lislah.net/archives/3615
Эта публикация завернет вас в вихрь увлекательного контента, сбрасывая стереотипы и открывая двери к новым идеям. Каждый абзац станет для вас открытием, полным ярких примеров и впечатляющих достижений. Подготовьтесь быть вовлеченными и удивленными каждый раз, когда продолжите читать.
Более того — здесь – https://newssamiksha.com/index.php/tag/french-president
Публикация приглашает вас исследовать неизведанное — от древних тайн до современных достижений науки. Вы узнаете, как случайные находки превращались в революции, а смелые мысли — в новые эры человеческого прогресса.
Что ещё нужно знать? – https://www.knruhs.telangana.gov.in/faq-items/vivamus-id-ante-vel-purus-commodo-cursus-nunc-sit-amet-cursus-massa
В этой публикации мы предлагаем подробные объяснения по актуальным вопросам, чтобы помочь читателям глубже понять их. Четкость и структурированность материала сделают его удобным для усвоения и применения в повседневной жизни.
Это стоит прочитать полностью – http://energohead.ru
Публикация приглашает вас исследовать неизведанное — от древних тайн до современных достижений науки. Вы узнаете, как случайные находки превращались в революции, а смелые мысли — в новые эры человеческого прогресса.
Следуйте по ссылке – https://namesarecheap.com/wordpress/therapy
В этой статье вы найдете познавательную и занимательную информацию, которая поможет вам лучше понять мир вокруг. Мы собрали интересные данные, которые вдохновляют на размышления и побуждают к действиям. Открывайте новую информацию и получайте удовольствие от чтения!
Читать дальше – https://youaremylabel.com/video_contest/were-still-here
Этот увлекательный информационный материал подарит вам массу новых знаний и ярких эмоций. Мы собрали для вас интересные факты и сведения, которые обогатят ваш опыт. Откройте для себя увлекательный мир информации и насладитесь процессом изучения!
Подробнее – https://okuniewska.net/2019/02/28/day-care-responsibility-to-protect-children
Публикация приглашает вас исследовать неизведанное — от древних тайн до современных достижений науки. Вы узнаете, как случайные находки превращались в революции, а смелые мысли — в новые эры человеческого прогресса.
Что ещё? Расскажи всё! – https://www.aprotime.sk/clanok/zostavme-si-pocitac-maticna-doska
Этот текст сочетает в себе элементы познавательного рассказа и аналитической подачи информации. Читатель получает доступ к уникальным данным, которые соединяют прошлое с настоящим и открывают двери в будущее.
Информация доступна здесь – https://topic.lk/7086
Алкогольная зависимость остается одной из самых серьезных проблем современного общества. Когда человек сталкивается с последствиями длительного употребления спиртных напитков, важно вовремя принять меры, чтобы минимизировать вред для организма. В таких случаях капельница от запоя становится эффективным инструментом для снятия интоксикации и восстановления здоровья.
Изучить вопрос глубже – капельница от запоя красноярск.
Мы собрали для вас самые захватывающие факты из мира науки и истории. От малознакомых деталей до грандиозных событий — эта статья расширит ваш кругозор и подарит новое понимание того, как устроен наш мир.
Углубить понимание вопроса – https://parquedasfloreslins.com.br/2020/05/22/prefeitura-de-lins-disponibiliza-plataforma-gratuita-para-divulgacao-de-empresas-durante-a-quarentena
В этой публикации мы предлагаем подробные объяснения по актуальным вопросам, чтобы помочь читателям глубже понять их. Четкость и структурированность материала сделают его удобным для усвоения и применения в повседневной жизни.
Ознакомьтесь с аналитикой – https://www.statewideinspection.com/hardwood-floors-cupping-and-buckling-due-to-crawl-space-moisture
Запой — это не просто временная слабость, а критическое состояние, требующее экстренного медицинского вмешательства. Особенно опасно откладывать обращение за помощью, если у человека наблюдаются такие симптомы:
Подробнее тут – вывод из запоя на дому круглосуточно
Этот информационный материал собраны данные, которые помогут лучше понять текущие тенденции и процессы в различных сферах жизни. Мы предоставляем четкий анализ, графики и примеры, чтобы информация была не только понятной, но и практичной для принятия решений.
Погрузиться в детали – https://sweetmacshop.com/2021/07/06/perfectly-colored-macarons-for-any-wedding
Этот информационный обзор станет отличным путеводителем по актуальным темам, объединяющим важные факты и мнения экспертов. Мы исследуем ключевые идеи и представляем их в доступной форме для более глубокого понимания. Читайте, чтобы оставаться в курсе событий!
Погрузиться в научную дискуссию – http://www.kotkishevo.ru
Этот информативный текст отличается привлекательным содержанием и актуальными данными. Мы предлагаем читателям взглянуть на привычные вещи под новым углом, предоставляя интересный и доступный материал. Получите удовольствие от чтения и расширьте кругозор!
Это стоит прочитать полностью – https://greume.com/who-is-summit1g-girlfriend-settings-net-worth-setup-and-more
В этом информативном тексте представлены захватывающие события и факты, которые заставят вас задуматься. Мы обращаем внимание на важные моменты, которые часто остаются незамеченными, и предлагаем новые перспективы на привычные вещи. Подготовьтесь к тому, чтобы быть поглощенным увлекательными рассказами!
Что ещё нужно знать? – https://awakenregen.com/2023/10/25/psicologia-social-comunitaria-en-el-turismo-regenerativo-potenciando-el-empoderamiento-local-y-la-salud-mental
Публикация приглашает вас исследовать неизведанное — от древних тайн до современных достижений науки. Вы узнаете, как случайные находки превращались в революции, а смелые мысли — в новые эры человеческого прогресса.
Осуществить глубокий анализ – http://www.kodicms.ru
Эта публикация дает возможность задействовать различные источники информации и представить их в удобной форме. Читатели смогут быстро найти нужные данные и получить ответы на интересующие их вопросы. Мы стремимся к четкости и доступности материала для всех!
Ознакомиться с полной информацией – https://cryptoworldblog.com/%F0%9F%9A%A8collapse-of-bitcoin-and-markets-live-analysis
Мы собрали для вас самые захватывающие факты из мира науки и истории. От малознакомых деталей до грандиозных событий — эта статья расширит ваш кругозор и подарит новое понимание того, как устроен наш мир.
Выяснить больше – https://transformationtherapy.net/event/lorem-ipsum-common-examples
Этот увлекательный информационный материал подарит вам массу новых знаний и ярких эмоций. Мы собрали для вас интересные факты и сведения, которые обогатят ваш опыт. Откройте для себя увлекательный мир информации и насладитесь процессом изучения!
Почему это важно? – https://www.nadnet.ma/new-post-2
В этой публикации мы предлагаем подробные объяснения по актуальным вопросам, чтобы помочь читателям глубже понять их. Четкость и структурированность материала сделают его удобным для усвоения и применения в повседневной жизни.
Доступ к полной версии – https://tlcooljc.org/home_02
Этот информационный материал собраны данные, которые помогут лучше понять текущие тенденции и процессы в различных сферах жизни. Мы предоставляем четкий анализ, графики и примеры, чтобы информация была не только понятной, но и практичной для принятия решений.
Более того — здесь – https://abbet88.com/clickbet168
Мы предлагаем вам подробное руководство, основанное на проверенных источниках и реальных примерах. Каждая часть публикации направлена на то, чтобы помочь вам разобраться в сложных вопросах и применить знания на практике.
Смотрите также… – https://airconditioningrepairdallastx.com/hello-world
Предлагаем вашему вниманию интересную справочную статью, в которой собраны ключевые моменты и нюансы по актуальным вопросам. Эта информация будет полезна как для профессионалов, так и для тех, кто только начинает изучать тему. Узнайте ответы на важные вопросы и расширьте свои знания!
Нажмите, чтобы узнать больше – https://topic.lk/6557
Основу капельницы составляют инфузионные растворы, которые помогают устранить обезвоживание. Дополнительно вводятся витамины для улучшения обменных процессов, препараты для защиты печени, а также успокоительные средства для стабилизации нервной системы. Компоненты подбираются индивидуально с учетом состояния пациента, чтобы обеспечить максимальную эффективность и безопасность.
Детальнее – капельница от запоя анонимно в красноярске
Эта процедура доступна как в условиях клиники, так и на дому, что делает ее универсальным решением для различных жизненных ситуаций. При этом важно доверять свое здоровье только профессиональным врачам, которые могут обеспечить безопасное и качественное лечение.
Выяснить больше – поставить капельницу от запоя
Кроме того, врач оказывает психологическую поддержку, которая помогает пациенту справиться с чувством тревоги, депрессией и страхом, возникающими на фоне зависимости.
Изучить вопрос глубже – нарколог на дом клиника в красноярске
Когда организм насыщен токсинами, нормальное функционирование органов нарушается. Капельница помогает быстро очистить кровь, восстановить клетки печени и улучшить общее состояние пациента, чтобы как можно быстрее вернуться к привычному уровню жизни.
Подробнее можно узнать тут – kapelnica-ot-zapoya-ektb55.ru/
На этом этапе врач детально выясняет, как долго продолжается запой, какие симптомы наблюдаются, и имеются ли сопутствующие заболевания. Точный анализ информации помогает оперативно определить степень интоксикации и подобрать оптимальные методы детоксикации, что является ключом к предотвращению дальнейших осложнений.
Подробнее – http://narcolog-na-dom-ryazan00.ru/narkolog-na-dom-kruglosutochno-ryazan/
Проблемы с алкоголем или наркотиками могут застать врасплох и привести к серьезным последствиям для организма, психического состояния и жизни пациента. Самостоятельные попытки выйти из запоя или преодолеть абстинентный синдром без медицинской поддержки редко оказываются эффективными и могут представлять реальную опасность для здоровья. Именно в таких ситуациях клиника «АльфаНаркология» предлагает услугу вызова нарколога на дом в Санкт-Петербурге и Ленинградской области. Наши специалисты оперативно реагируют на обращение, оказывают квалифицированную помощь и обеспечивают полную конфиденциальность лечения.
Получить дополнительную информацию – нарколог на дом недорого
В клинике применяются инновационные методы диагностики, включая лабораторные анализы и аппаратные исследования, которые позволяют выявить степень зависимости и сопутствующие патологии. Важным этапом является комплексный подход к лечению, включающий детоксикацию организма, психотерапию и медикаментозную поддержку.
Узнать больше – http://narkologicheskaya-klinika-krasnodar00.ru
Наркологическая клиника «СочиМед» предлагает полный спектр услуг по лечению алкогольной и наркотической зависимости, сочетая современные медицинские технологии с уютной атмосферой. Размещение в стационаре организовано по принципу гостиничного сервиса: отдельные палаты с кондиционером, круглосуточное питание по диетам, а внимательный персонал поддерживает пациентов на каждом этапе восстановления.
Получить больше информации – наркологическая клиника на дом
Алкоголизм является хроническим заболеванием, требующим комплексного и профессионального подхода к лечению. Лечение алкоголизма в Сочи направлено на полное восстановление физического и психоэмоционального состояния пациента с помощью современных медицинских технологий и индивидуально подобранных программ терапии.
Исследовать вопрос подробнее – клиника лечения алкоголизма сочи
Мы работаем круглосуточно и гарантируем строгое соблюдение конфиденциальности, используя только сертифицированные препараты и проверенные методики лечения.
Углубиться в тему – выезд нарколога на дом санкт-петербург
Эта процедура доступна как в условиях клиники, так и на дому, что делает ее универсальным решением для различных жизненных ситуаций. При этом важно доверять свое здоровье только профессиональным врачам, которые могут обеспечить безопасное и качественное лечение.
Ознакомиться с деталями – капельница от запоя анонимно
Доказательную базу терапии подтверждают данные с Национального института наркологии.
Разобраться лучше – наркологическая клиника сочи.
Этот метод направлен на выявление и замену негативных мыслей и стереотипов поведения, связанных с потреблением алкоголя. Пациент учится отслеживать свои эмоциональные реакции и заменять деструктивные установки конструктивными стратегиями противостояния стрессу.
Детальнее – наркология лечение алкоголизма
На первом этапе проводится осмотр: врач измеряет давление, пульс, уровень кислорода, температуру тела, оценивает общее состояние, собирает анамнез и анализирует возможные сопутствующие заболевания. При необходимости пациент проходит экспресс-диагностику, включая лабораторные анализы, ЭКГ и консультации других специалистов (кардиолога, невролога).
Подробнее можно узнать тут – vyvod-iz-zapoya-na-domu-balashiha-ceny
В состав капельницы обычно входят растворы для гидратации, витаминно-минеральные комплексы, гепатопротекторы для защиты печени, а также седативные препараты для стабилизации нервной системы. Такой подход позволяет быстро справиться с признаками похмелья и предотвратить развитие более серьезных осложнений.
Разобраться лучше – https://kapelnica-ot-zapoya-ekb55.ru/kapelnicza-ot-zapoya-v-stacionare-ekaterinburg
Индивидуальный подход к каждому пациенту: Учитываются уникальные характеристики, включая медицинскую историю, психологическое состояние и социальные факторы. Это позволяет разработать максимально эффективный план терапии.
Узнать больше – вывод из запоя цена санкт-петербург.
Национальный стандарт оказания наркологической помощи регламентирует состав препаратов, используемых при терапии, а также протоколы безопасности, которым следует выездной персонал.
Разобраться лучше – https://narcolog-na-dom-ekaterinburg55.ru/narkolog-na-dom-kruglosutochno-v-ekaterinburge/
Капельница от запоя представляет собой инъекционную терапию, которая помогает очистить организм от токсинов, вызванных чрезмерным употреблением алкоголя. Состав капельницы включает специальные растворы, которые способствуют восстановлению водно-солевого баланса, а также витамины и препараты для нормализации функций печени и нервной системы. Это помогает пациенту избавиться от головной боли, слабости, тошноты и других симптомов похмелья, ускоряя процесс восстановления.
Получить больше информации – kapelnicza-ot-zapoya ekaterinburg
Наши ключевые принципы.
Получить дополнительную информацию – вывод из запоя на дому цена в санкт-петербурге
Капельница также рекомендуется для тех, кто испытывает сильный похмельный синдром после длительных запоев. Она помогает не только облегчить состояние, но и предотвратить развитие серьезных осложнений, таких как поражение печени, сердечно-сосудистые нарушения или острые психические расстройства.
Разобраться лучше – http://kapelnica-ot-zapoya-krasnoyarsk55.ru
В момент вызова важно сообщить:
Подробнее тут – https://narkologicheskaya-klinika-rostov13.ru/narkologicheskaya-klinika-v-rostove
Почему пациенты выбирают именно нас:
Подробнее тут – kruglosutochnaya-narkologicheskaya-pomoshch
Кодирование — это не просто медицинская манипуляция, а серьёзный шаг к восстановлению контроля над собственной жизнью и формированию устойчивой ремиссии.
Получить дополнительные сведения – http://kodirovanie-ot-alkogolizma-mytishchi5.ru
На этом этапе врач детально выясняет, как долго продолжается запой, какие симптомы наблюдаются, и имеются ли сопутствующие заболевания. Точный анализ информации помогает оперативно определить степень интоксикации и подобрать оптимальные методы детоксикации, что является ключом к предотвращению дальнейших осложнений.
Подробнее можно узнать тут – нарколог на дом вывод рязань
Запой — состояние, при котором человек теряет контроль над количеством употребляемого алкоголя и уже не может самостоятельно прекратить пить. Подобные эпизоды представляют серьёзную угрозу для здоровья, а порой и для жизни. Особенно опасен резкий отказ от спиртного после длительных запоев — это может вызвать тяжёлые абстинентные расстройства, нарушение работы сердца, печени, нервной системы, галлюцинации и даже приступы судорог. В такой ситуации необходимо срочно обращаться к профессионалам. В наркологической клинике «Спасение Плюс» в Химках вывод из запоя осуществляется с выездом врача, гарантией безопасности и индивидуальным подходом.
Получить дополнительную информацию – вывод из запоя в стационаре
После процедуры пациент и его близкие получают развернутые рекомендации по дальнейшему восстановлению, советы по профилактике рецидивов и возможности прохождения кодирования при желании пациента.
Узнать больше – http://narcolog-na-dom-sankt-peterburg000.ru
Наркологическая клиника в Краснодаре представляет собой специализированное медицинское учреждение, где оказывается профессиональная помощь пациентам с различными формами зависимости. Современные подходы к лечению позволяют обеспечить эффективную и безопасную терапию, направленную на восстановление физического и психического здоровья.
Подробнее тут – https://narkologicheskaya-klinika-krasnodar00.ru/anonimnaya-narkologicheskaya-klinika-v-krasnodare/
Каждый пациент получает персонализированную программу, учитывающую стадию заболевания, сопутствующие патологии и социальный статус. На основании анализа состояния назначается оптимальная терапия, что значительно повышает эффективность лечения. Врач-нарколог подбирает препараты с учетом индивидуальной переносимости, а психотерапевт разрабатывает план психологической поддержки.
Ознакомиться с деталями – http://lechenie-alkogolizma-sochi00.ru
Питание организовано по системе «шведский стол» с блюдами, соответствующими медицинским диетам: щадящие супы, нежирное мясо, свежие овощи и кисломолочные продукты. Рацион составляют диетолог и врач-нарколог с учётом индивидуальных потребностей.
Углубиться в тему – narkologicheskie kliniki alkogolizm sochi
Есть ситуации, когда дальнейшее промедление может привести к необратимым последствиям:
Получить дополнительные сведения – narkologiya-lechenie-alkogolizma
Капельница – это метод внутривенной инфузии, который позволяет доставить в организм пациента растворы для детоксикации и восстановления. Основные задачи процедуры включают очищение крови от токсичных веществ, нормализацию водно-солевого баланса и улучшение общего самочувствия.
Разобраться лучше – врача капельницу от запоя в красноярске
Алкогольная зависимость – заболевание, при котором страдает не только тело, но и психика человека. При длительных запоях нарушается работа сердца, печени, почек, появляются острые психоэмоциональные расстройства: тревожность, страхи, агрессия, проблемы со сном. В стадии абстиненции часто отмечается учащённый пульс, скачки давления, дрожь в руках, галлюцинации. Это крайне опасное состояние, требующее профессионального вмешательства нарколога. Клиника «Решение+» в Ногинске предлагает квалифицированный вывод из запоя на дому и в стационаре — с индивидуальным подходом, круглосуточной поддержкой и полным соблюдением анонимности.
Выяснить больше – https://vyvod-iz-zapoya-noginsk5.ru/vyvod-iz-zapoya-stacionar-v-noginske
Вызов врача-нарколога на дом в Санкт-Петербурге начинается с детального осмотра и оценки состояния пациента. Врач измеряет давление, пульс, уровень кислорода в крови и определяет степень интоксикации.
Получить дополнительные сведения – http://narcolog-na-dom-sankt-peterburg00.ru
Стоимость капельницы от запоя в Екатеринбурге зависит от нескольких факторов, таких как состав раствора, срочность вызова и место проведения процедуры. Базовый состав включает физраствор, витамины, антиоксиданты и средства для защиты печени, но в случае необходимости могут быть добавлены дополнительные препараты, что увеличивает цену.
Узнать больше – капельница от запоя екатеринбург.
Основными направлениями работы являются:
Подробнее – наркологическая клиника краснодарский край
Зависимость от алкоголя или наркотиков — серьёзная проблема, которая постепенно разрушает жизнь, подрывает здоровье, нарушает семейные отношения и ведёт к социальной изоляции. Попытки самостоятельно справиться с заболеванием редко приводят к успеху и зачастую только усугубляют ситуацию. Важно не терять время и обращаться за профессиональной помощью. В наркологической клинике «Наркосфера» в Балашихе пациентов ждёт современное оборудование, команда опытных специалистов, индивидуальный подход и абсолютная анонимность.
Получить дополнительные сведения – https://narkologicheskaya-klinika-balashiha5.ru/chastnaya-narkologicheskaya-klinika-v-balashihe
Совместные занятия с другими пациентами создают атмосферу поддержки и понимания. Под руководством психотерапевта участники группы делятся опытом, обсуждают сложные ситуации и находят оптимальные способы удержаться от срыва.
Подробнее – http://
Процедура капельницы особенно показана в случаях, когда симптомы похмелья выражены настолько сильно, что пациент не в состоянии справиться с ними самостоятельно. Головная боль, тошнота, рвота, усталость и раздражительность — все это признаки того, что организму необходимо восстановление. Капельница помогает не только ускорить процесс очищения, но и минимизировать риск осложнений, таких как нарушение работы сердца и печени.
Подробнее – капельница от запоя анонимно в екатеринбурге
Есть ряд признаков и ситуаций, когда откладывать обращение к наркологу опасно:
Углубиться в тему – наркологическая помощь люберцы
Наркологическая клиника в Ростове-на-Дону предоставляет полный спектр услуг по диагностике, лечению и реабилитации пациентов с алкогольной и наркотической зависимостью. Применение современных медицинских протоколов и индивидуальный подход к каждому пациенту обеспечивают высокую эффективность терапии и снижение риска рецидивов.
Получить больше информации – наркологические клиники алкоголизм в ростове-на-дону
Клиническая помощь на дому охватывает не только острые состояния, но и плановые мероприятия по выводу из запоя, устранению абстиненции и восстановлению водно-электролитного баланса. Используются только сертифицированные препараты, рекомендованные Минздравом России.
Получить дополнительные сведения – вызов врача нарколога на дом в екатеринбурге
Алкогольная зависимость остаётся одной из самых серьёзных проблем современного общества. Злоупотребление алкоголем разрушает здоровье, негативно влияет на психику, приводит к разрыву семей, потере работы и социального статуса. Когда самостоятельные попытки побороть тягу к спиртному не приносят результата, эффективным выходом становится кодирование от алкоголизма — медицинская процедура, позволяющая на длительный срок блокировать желание употреблять спиртное и начать путь к полноценной жизни. В наркологической клинике «АлкоСвобода» в Мытищах для кодирования применяются только современные, безопасные и признанные методики, которые подбираются индивидуально для каждого пациента с учётом всех особенностей организма.
Получить дополнительные сведения – клиника кодирования от алкоголизма
Запой – это не просто временное ухудшение самочувствия, а состояние, при котором организм подвергается значительному токсическому воздействию алкоголя. Длительное злоупотребление приводит к накоплению вредных веществ, что может вызвать:
Узнать больше – вызов нарколога на дом
В Наркологическом центре “Вторая жизнь” работают высококвалифицированные специалисты с опытом в области наркологии и психиатрии. Все врачи имеют профильное образование и постоянно повышают свою квалификацию. Основные преимущества нашей команды:
Изучить вопрос глубже – нарколог вывод из запоя
Одним из наиболее удобных вариантов лечения является проведение процедуры в домашних условиях. Это особенно актуально для пациентов, которые чувствуют себя слишком плохо, чтобы отправиться в клинику, или желают сохранить анонимность.
Получить больше информации – врача капельницу от запоя в красноярске
Запой — состояние, при котором человек теряет контроль над количеством употребляемого алкоголя и уже не может самостоятельно прекратить пить. Подобные эпизоды представляют серьёзную угрозу для здоровья, а порой и для жизни. Особенно опасен резкий отказ от спиртного после длительных запоев — это может вызвать тяжёлые абстинентные расстройства, нарушение работы сердца, печени, нервной системы, галлюцинации и даже приступы судорог. В такой ситуации необходимо срочно обращаться к профессионалам. В наркологической клинике «Спасение Плюс» в Химках вывод из запоя осуществляется с выездом врача, гарантией безопасности и индивидуальным подходом.
Детальнее – http://vyvod-iz-zapoya-himki5.ru/vyvod-iz-zapoya-na-domu-v-himkah/https://vyvod-iz-zapoya-himki5.ru
Вызывать нарколога на дом рекомендуется при следующих состояниях:
Углубиться в тему – http://narcolog-na-dom-sankt-peterburg000.ru
Применение современных средств медикаментозного лечения обеспечивает безопасность процедуры и минимизирует риски осложнений.
Углубиться в тему – http://lechenie-alkogolizma-sochi00.ru/klinika-lecheniya-alkogolizma-v-sochi/
Психотерапия занимает ключевое место в комплексном лечении зависимостей. В клинике применяются методы когнитивно-поведенческой терапии, мотивационного интервью и групповой психотерапии. Эти методы способствуют формированию устойчивой мотивации к трезвому образу жизни и профилактике рецидивов. Рекомендации по психотерапии при зависимости подробно представлены на портале Психологической Ассоциации России.
Подробнее – http://narkologicheskaya-klinika-krasnodar00.ru/
Детоксикация организма, проводимая на дому, помогает очистить кровь от токсинов, накопившихся из-за длительного употребления алкоголя или наркотических веществ. Она проводится с использованием специально подобранных медикаментов, которые улучшают работу печени, почек и других органов.
Подробнее тут – нарколог на дом клиника в красноярске
Почему пациенты выбирают именно нас:
Детальнее – narkologicheskaya-pomoshch-lyubercy5.ru/
Наши ключевые принципы.
Получить дополнительные сведения – вывод из запоя цена санкт-петербург.
Питание организовано по системе «шведский стол» с блюдами, соответствующими медицинским диетам: щадящие супы, нежирное мясо, свежие овощи и кисломолочные продукты. Рацион составляют диетолог и врач-нарколог с учётом индивидуальных потребностей.
Узнать больше – http://narkologicheskaya-klinika-sochi00.ru
В состав капельницы обычно входят растворы для гидратации, витаминно-минеральные комплексы, гепатопротекторы для защиты печени, а также седативные препараты для стабилизации нервной системы. Такой подход позволяет быстро справиться с признаками похмелья и предотвратить развитие более серьезных осложнений.
Получить больше информации – капельница от запоя клиника
Вызов врача-нарколога на дом в Санкт-Петербурге начинается с детального осмотра и оценки состояния пациента. Врач измеряет давление, пульс, уровень кислорода в крови и определяет степень интоксикации.
Разобраться лучше – http://narcolog-na-dom-sankt-peterburg00.ru/
Кроме того, врач приедет в любое удобное для пациента время, даже ночью, обеспечив круглосуточный доступ к медицинской помощи. Специалист подбирает индивидуальный состав капельницы, что позволяет оптимально поддержать организм в зависимости от состояния пациента.
Изучить вопрос глубже – вызвать капельницу от запоя екатеринбург
Психоэмоциональное состояние играет ключевую роль в лечении зависимости. В «ЮгМед» психологи и психотерапевты обеспечивают сопровождение на всех этапах реабилитации, помогая пациенту справиться с тревогой, сниженной самооценкой и стрессом. Одна только медикаментозная детоксикация не гарантирует успеха — важно разобраться в причинах зависимости и выработать навыки противодействия соблазнам.
Углубиться в тему – https://lechenie-alkogolizma-sochi0.ru/
Стационарное лечение позволяет обеспечить круглосуточный контроль состояния, регулярное медицинское сопровождение и профессиональную поддержку психологов и наркологов. Такой подход существенно увеличивает шансы на успешное восстановление.
Подробнее можно узнать тут – наркологическая клиника сочи.
В автомобиле находятся:
Детальнее – наркологическая клиника цены
Лечение начинается с обязательной консультации врача-нарколога. На этом этапе специалист подробно выясняет особенности употребления, продолжительность зависимости, наличие хронических и сопутствующих заболеваний, а также психоэмоциональное состояние пациента. Диагностика позволяет выбрать максимально эффективную и безопасную методику кодирования.
Выяснить больше – https://kodirovanie-ot-alkogolizma-mytishchi5.ru/narkolog-kodirovanie-ot-alkogolizma-v-mytishchah
Эта процедура доступна как в условиях клиники, так и на дому, что делает ее универсальным решением для различных жизненных ситуаций. При этом важно доверять свое здоровье только профессиональным врачам, которые могут обеспечить безопасное и качественное лечение.
Получить дополнительную информацию – kapelnica-ot-zapoya-krasnoyarsk55.ru/
Алкогольная зависимость требует быстрого и квалифицированного вмешательства, поскольку она может привести к тяжелым последствиям для здоровья. Капельница от запоя — один из наиболее эффективных методов, помогающих вывести организм из состояния алкогольной интоксикации и восстановить нормальное самочувствие. В Екатеринбурге эта процедура доступна как в медицинских учреждениях, так и на дому, что позволяет пациентам выбрать наиболее удобный и комфортный способ лечения.
Исследовать вопрос подробнее – https://kapelnica-ot-zapoya-ektb55.ru/kapelnicza-na-domu-ekaterinburg-ot-zapoya/
Когда запой становится угрозой для жизни, оперативное вмешательство становится ключевым для спасения здоровья и предотвращения серьезных осложнений. В Рязани вызов нарколога на дом позволяет начать лечение в самые критические моменты, обеспечивая детоксикацию организма и восстановление его нормального функционирования в условиях, где пациент чувствует себя комфортно и сохраняет свою конфиденциальность. Этот формат оказания медицинской помощи особенно актуален для тех, кто хочет избежать длительного ожидания в стационаре и предпочитает лечение в привычной домашней обстановке.
Получить дополнительную информацию – http://narcolog-na-dom-ryazan00.ru
Почему пациенты выбирают именно нас:
Разобраться лучше – http://www.domen.ru
Капельница также рекомендуется для тех, кто испытывает сильный похмельный синдром после длительных запоев. Она помогает не только облегчить состояние, но и предотвратить развитие серьезных осложнений, таких как поражение печени, сердечно-сосудистые нарушения или острые психические расстройства.
Получить дополнительную информацию – капельница от запоя красноярск
После процедуры даются рекомендации по восстановлению, при необходимости оформляется поддержка по реабилитации, выдается памятка для пациента и родственников. При сложных состояниях может быть рекомендована госпитализация в стационар.
Подробнее – vyvod-iz-zapoya-na-domu-cena
Вызов нарколога на дом позволяет быстро получить квалифицированную помощь в условиях, где пациент чувствует себя максимально комфортно. Специалист прибывает в течение 1–2 часов после обращения, осуществляя диагностику, стабилизацию состояния и при необходимости — детоксикацию.
Разобраться лучше – вызов нарколога на дом
В клинике каждому пациенту уделяют особое внимание. Врачи знают: универсальных решений нет, за каждым случаем — своя история и свои причины. Первый контакт начинается с конфиденциальной консультации. Можно просто позвонить или написать онлайн — уже на этом этапе врач поможет оценить ситуацию, объяснит возможные этапы и даст рекомендации по подготовке к визиту.
Углубиться в тему – лечение алкоголизма на дому
Проблемы с алкоголем или наркотиками могут застать врасплох и привести к серьезным последствиям для организма, психического состояния и жизни пациента. Самостоятельные попытки выйти из запоя или преодолеть абстинентный синдром без медицинской поддержки редко оказываются эффективными и могут представлять реальную опасность для здоровья. Именно в таких ситуациях клиника «АльфаНаркология» предлагает услугу вызова нарколога на дом в Санкт-Петербурге и Ленинградской области. Наши специалисты оперативно реагируют на обращение, оказывают квалифицированную помощь и обеспечивают полную конфиденциальность лечения.
Подробнее тут – нарколог на дом срочно санкт-петербург
Согласно статье, опубликованной в Журнале клинической медицины, комплексный подход снижает вероятность рецидива и способствует длительной ремиссии.
Детальнее – http://lechenie-alkogolizma-sochi00.ru
В клинике применяются инновационные методы диагностики, включая лабораторные анализы и аппаратные исследования, которые позволяют выявить степень зависимости и сопутствующие патологии. Важным этапом является комплексный подход к лечению, включающий детоксикацию организма, психотерапию и медикаментозную поддержку.
Изучить вопрос глубже – https://narkologicheskaya-klinika-krasnodar00.ru/
Алкогольная зависимость – заболевание, при котором страдает не только тело, но и психика человека. При длительных запоях нарушается работа сердца, печени, почек, появляются острые психоэмоциональные расстройства: тревожность, страхи, агрессия, проблемы со сном. В стадии абстиненции часто отмечается учащённый пульс, скачки давления, дрожь в руках, галлюцинации. Это крайне опасное состояние, требующее профессионального вмешательства нарколога. Клиника «Решение+» в Ногинске предлагает квалифицированный вывод из запоя на дому и в стационаре — с индивидуальным подходом, круглосуточной поддержкой и полным соблюдением анонимности.
Подробнее тут – https://vyvod-iz-zapoya-noginsk5.ru/vyvod-iz-zapoya-kruglosutochno-v-noginske
После обращения в клинику пациент получает первую подробную консультацию — это может быть очный визит, звонок или заявка через сайт. При необходимости организуется экстренное поступление или выезд нарколога на дом: врач приезжает с полным набором оборудования и медикаментов для оказания неотложной помощи. На первом этапе проводится диагностика: анализы крови, ЭКГ, осмотр профильных специалистов, дополнительное обследование по показаниям. Это позволяет точно определить степень зависимости, выявить осложнения и подобрать эффективную тактику лечения.
Детальнее – http://narkologicheskaya-klinika-balashiha5.ru
Основу капельницы составляют инфузионные растворы, которые помогают устранить обезвоживание. Дополнительно вводятся витамины для улучшения обменных процессов, препараты для защиты печени, а также успокоительные средства для стабилизации нервной системы. Компоненты подбираются индивидуально с учетом состояния пациента, чтобы обеспечить максимальную эффективность и безопасность.
Получить дополнительную информацию – врача капельницу от запоя
Решение о необходимости кодирования может возникнуть как у самого человека, так и у его близких, если:
Получить дополнительные сведения – кодирование от алкоголизма на дому
Алкогольная зависимость — одна из самых распространенных проблем нашего времени, требующая немедленного и грамотного вмешательства. В Екатеринбурге капельница от запоя является одним из самых популярных и действенных методов восстановления после длительного употребления алкоголя. Она помогает организму справиться с интоксикацией, восстанавливает физическое и эмоциональное состояние пациента, улучшает самочувствие в короткие сроки. При этом лечение может быть организовано как в стационаре, так и на дому, в зависимости от удобства пациента.
Получить больше информации – капельница от запоя на дому цена в екатеринбурге
Наркологическая клиника «СочиМед» предлагает полный спектр услуг по лечению алкогольной и наркотической зависимости, сочетая современные медицинские технологии с уютной атмосферой. Размещение в стационаре организовано по принципу гостиничного сервиса: отдельные палаты с кондиционером, круглосуточное питание по диетам, а внимательный персонал поддерживает пациентов на каждом этапе восстановления.
Получить дополнительные сведения – наркологическая клиника краснодарский край
Кроме того, врач приедет в любое удобное для пациента время, даже ночью, обеспечив круглосуточный доступ к медицинской помощи. Специалист подбирает индивидуальный состав капельницы, что позволяет оптимально поддержать организм в зависимости от состояния пациента.
Изучить вопрос глубже – [url=https://kapelnica-ot-zapoya-ektb55.ru/]kapelnicza-ot-zapoya-czena ekaterinburg[/url]
Мы работаем круглосуточно и гарантируем строгое соблюдение конфиденциальности, используя только сертифицированные препараты и проверенные методики лечения.
Детальнее – нарколог на дом цена в санкт-петербурге
Почему пациенты выбирают именно нас:
Получить дополнительную информацию – http://narkologicheskaya-pomoshch-lyubercy5.ru/platnaya-narkologicheskaya-pomoshch-v-lyubercah/
Совместные занятия с другими пациентами создают атмосферу поддержки и понимания. Под руководством психотерапевта участники группы делятся опытом, обсуждают сложные ситуации и находят оптимальные способы удержаться от срыва.
Разобраться лучше – https://lechenie-alkogolizma-sochi0.ru/lechenie-alkogolizma-anonimno-v-sochi
Основными направлениями работы являются:
Получить дополнительную информацию – https://narkologicheskaya-klinika-sochi0.ru/
Индивидуальный подход к каждому пациенту: Учитываются уникальные характеристики, включая медицинскую историю, психологическое состояние и социальные факторы. Это позволяет разработать максимально эффективный план терапии.
Детальнее – вывод из запоя недорого
На этом этапе врач детально выясняет, как долго продолжается запой, какие симптомы наблюдаются, и имеются ли сопутствующие заболевания. Точный анализ информации помогает оперативно определить степень интоксикации и подобрать оптимальные методы детоксикации, что является ключом к предотвращению дальнейших осложнений.
Разобраться лучше – http://narcolog-na-dom-ryazan00.ru
В зависимости от тяжести состояния и наличия осложнений клиника «Спасение Плюс» предлагает:
Детальнее – http://vyvod-iz-zapoya-himki5.ru/vyvod-iz-zapoya-kruglosutochno-v-himkah/
В медицинской практике применяются разнообразные методы, позволяющие эффективно бороться с зависимостью. К ним относятся медикаментозная терапия, психотерапия, социальная реабилитация и физиотерапевтические процедуры. Медикаментозное лечение помогает снять острые симптомы интоксикации и предотвратить развитие осложнений, что подтверждают данные исследований на Национальном медицинском портале.
Получить дополнительные сведения – http://lechenie-alkogolizma-sochi00.ru/
Вызов врача-нарколога на дом позволяет избежать стресса госпитализации, обеспечивая комфорт и удобство как для пациента, так и для его близких.
Изучить вопрос глубже – врач нарколог на дом ленинградская область
Капельница также рекомендуется для тех, кто испытывает сильный похмельный синдром после длительных запоев. Она помогает не только облегчить состояние, но и предотвратить развитие серьезных осложнений, таких как поражение печени, сердечно-сосудистые нарушения или острые психические расстройства.
Детальнее – капельница от запоя наркология красноярск
Наркологическая клиника в Краснодаре представляет собой специализированное медицинское учреждение, где оказывается профессиональная помощь пациентам с различными формами зависимости. Современные подходы к лечению позволяют обеспечить эффективную и безопасную терапию, направленную на восстановление физического и психического здоровья.
Ознакомиться с деталями – частная наркологическая клиника в краснодаре
Почему пациенты выбирают именно нас:
Получить дополнительную информацию – https://narkologicheskaya-pomoshch-lyubercy5.ru/kruglosutochnaya-narkologicheskaya-pomoshch-v-lyubercah/
Зависимость — коварное хроническое заболевание, поражающее не только физическое, но и психическое здоровье человека. Она захватывает волю, разум, искажает восприятие реальности, разрушает семьи и судьбы. Алкоголизм, наркомания, игровая зависимость — всё это грани одной проблемы, требующей комплексного и профессионального подхода.
Подробнее – https://alko-reabcentr.ru/vivod-iz-zapoya-anonimno-v-Sankt-Peterburge
В клинике «АлкоСвобода» используются только проверенные и признанные медицинским сообществом методы:
Получить больше информации – https://kodirovanie-ot-alkogolizma-mytishchi5.ru/
Этапы оказания помощи выездной наркологической бригадой включают:
Подробнее тут – нарколог на дом круглосуточно екатеринбург
Процедура капельницы особенно показана в случаях, когда симптомы похмелья выражены настолько сильно, что пациент не в состоянии справиться с ними самостоятельно. Головная боль, тошнота, рвота, усталость и раздражительность — все это признаки того, что организму необходимо восстановление. Капельница помогает не только ускорить процесс очищения, но и минимизировать риск осложнений, таких как нарушение работы сердца и печени.
Углубиться в тему – вызвать капельницу от запоя на дому в екатеринбурге
В момент вызова важно сообщить:
Узнать больше – https://narkologicheskaya-klinika-rostov13.ru/psikhiatricheskaya-narkologicheskaya-klinika-v-rostove/
Алкогольная зависимость — одна из самых распространенных проблем нашего времени, требующая немедленного и грамотного вмешательства. В Екатеринбурге капельница от запоя является одним из самых популярных и действенных методов восстановления после длительного употребления алкоголя. Она помогает организму справиться с интоксикацией, восстанавливает физическое и эмоциональное состояние пациента, улучшает самочувствие в короткие сроки. При этом лечение может быть организовано как в стационаре, так и на дому, в зависимости от удобства пациента.
Подробнее – kapelnica-ot-zapoya-ekb55.ru/
Услуга выезда направлена на первичное стабилизирующее лечение при запое или наркотической интоксикации без необходимости госпитализации. Вызов выполняется в пределах города и пригорода максимум за 60 минут.
Выяснить больше – частная наркологическая клиника сочи
Вызов врача-нарколога на дом в Санкт-Петербурге начинается с детального осмотра и оценки состояния пациента. Врач измеряет давление, пульс, уровень кислорода в крови и определяет степень интоксикации.
Разобраться лучше – нарколог на дом срочно в санкт-петербурге
Решение вызвать нарколога для вывода из запоя должно приниматься незамедлительно, если наблюдаются тревожные признаки:
Изучить вопрос глубже – помощь вывод из запоя
Терапия начинается с подробного обследования: врачи выясняют не только текущее физическое состояние, но и личные мотивы пациента, его страхи и ожидания от лечения. Диагностика включает анализы, ЭКГ, ультразвуковое исследование, а также психодиагностику. Уже на этом этапе формируется контакт между специалистом и пациентом, выстраивается доверие, что крайне важно для успеха последующей терапии.
Узнать больше – лечение алкоголизма
Эта публикация завернет вас в вихрь увлекательного контента, сбрасывая стереотипы и открывая двери к новым идеям. Каждый абзац станет для вас открытием, полным ярких примеров и впечатляющих достижений. Подготовьтесь быть вовлеченными и удивленными каждый раз, когда продолжите читать.
Узнай первым! – https://creationabomination.com/product/dreadful-abomination-desolation
Предлагаем вашему вниманию интересную справочную статью, в которой собраны ключевые моменты и нюансы по актуальным вопросам. Эта информация будет полезна как для профессионалов, так и для тех, кто только начинает изучать тему. Узнайте ответы на важные вопросы и расширьте свои знания!
Подробная информация доступна по запросу – https://chatadoubravka.cz/component/k2/item/14-do-what-you-like?start=4170
Эта публикация завернет вас в вихрь увлекательного контента, сбрасывая стереотипы и открывая двери к новым идеям. Каждый абзац станет для вас открытием, полным ярких примеров и впечатляющих достижений. Подготовьтесь быть вовлеченными и удивленными каждый раз, когда продолжите читать.
Как достичь результата? – https://hongdaochulai.com.vn/?attachment_id=100
В этой статье вы найдете познавательную и занимательную информацию, которая поможет вам лучше понять мир вокруг. Мы собрали интересные данные, которые вдохновляют на размышления и побуждают к действиям. Открывайте новую информацию и получайте удовольствие от чтения!
Смотрите также… – https://f5fashion.vn/trac-nghiem-tam-ly-ban-muon-ghe-tham-khung-canh-nao-nhat-trong-4-canh-dep-nay-kiem-tra-xem-ban-co-phai-la-nguoi-doc-lap-khong
Эта публикация дает возможность задействовать различные источники информации и представить их в удобной форме. Читатели смогут быстро найти нужные данные и получить ответы на интересующие их вопросы. Мы стремимся к четкости и доступности материала для всех!
Смотрите также… – https://gane3.com/%E5%9C%A8%E5%AE%85%E5%89%AF%E6%A5%AD%E3%81%A7%E5%89%AF%E5%8F%8E%E5%85%A5%E3%82%92%E5%BE%97%E3%82%88%E3%81%86%EF%BC%81%E3%81%8A%E3%81%99%E3%81%99%E3%82%81%E3%81%AE%E4%BB%95%E4%BA%8B%E3%81%A8%E5%A7%8B
В этой публикации мы предлагаем подробные объяснения по актуальным вопросам, чтобы помочь читателям глубже понять их. Четкость и структурированность материала сделают его удобным для усвоения и применения в повседневной жизни.
Лучшее решение — прямо здесь – https://www.omarali.com.my/baju-melayu-online
В статье представлены ключевые моменты по актуальной теме, дополненные советами экспертов и ссылками на дополнительные ресурсы. Цель материала — дать читателю инструменты для самостоятельного развития и принятия осознанных решений.
Углубить понимание вопроса – http://uzhgorod-ioann.prihod.ru/gallery/view/id/2616/page/2
Используются препараты, нормализующие работу центральной нервной системы, корректирующие электролитный баланс и устраняющие симптомы алкогольной интоксикации. Применение седативных и противосудорожных средств снижает риск осложнений.
Изучить вопрос глубже – вывод из запоя на дому цена в ростове-на-дону
Этот информационный материал собраны данные, которые помогут лучше понять текущие тенденции и процессы в различных сферах жизни. Мы предоставляем четкий анализ, графики и примеры, чтобы информация была не только понятной, но и практичной для принятия решений.
Секреты успеха внутри – https://beatrizledezma.com/2024/09/29/pedro-paramo-nuevas-generaciones-se-adentren-en-el-universo-de-rulfo
Предлагаем вашему вниманию интересную справочную статью, в которой собраны ключевые моменты и нюансы по актуальным вопросам. Эта информация будет полезна как для профессионалов, так и для тех, кто только начинает изучать тему. Узнайте ответы на важные вопросы и расширьте свои знания!
Изучить вопрос глубже – https://sugarlace.com.au/swirl
Эта информационная заметка содержит увлекательные сведения, которые могут вас удивить! Мы собрали интересные факты, которые сделают вашу жизнь ярче и полнее. Узнайте нечто новое о привычных аспектах повседневности и откройте для себя удивительный мир информации.
Обратитесь за информацией – https://www.thermopack.in/industic-3
Эта обзорная заметка содержит ключевые моменты и факты по актуальным вопросам. Она поможет читателям быстро ориентироваться в теме и узнать о самых важных аспектах сегодня. Получите краткий курс по современной информации и оставайтесь в курсе событий!
Осуществить глубокий анализ – http://bergmannarchitekt.de/ru/mt-sample-background
Этот текст призван помочь читателю расширить кругозор и получить практические знания. Мы используем простой язык, наглядные примеры и структурированное изложение, чтобы сделать обучение максимально эффективным и увлекательным.
Ознакомьтесь с аналитикой – https://www.guisos.es/carne/conejo-en-salsa
Эта публикация завернет вас в вихрь увлекательного контента, сбрасывая стереотипы и открывая двери к новым идеям. Каждый абзац станет для вас открытием, полным ярких примеров и впечатляющих достижений. Подготовьтесь быть вовлеченными и удивленными каждый раз, когда продолжите читать.
Уточнить детали – https://nahal100.ir/%D9%86%D9%87%D8%A7%D9%84-%D8%B4%D9%84%DB%8C%D9%84-%D9%85%D8%BA%D8%A7%D9%86
Этот увлекательный информационный материал подарит вам массу новых знаний и ярких эмоций. Мы собрали для вас интересные факты и сведения, которые обогатят ваш опыт. Откройте для себя увлекательный мир информации и насладитесь процессом изучения!
Доступ к полной версии – https://myseoarticle.com/deep-links-directory-submission-sites-list
Этот увлекательный информационный материал подарит вам массу новых знаний и ярких эмоций. Мы собрали для вас интересные факты и сведения, которые обогатят ваш опыт. Откройте для себя увлекательный мир информации и насладитесь процессом изучения!
Обратитесь за информацией – https://f5fashion.vn/cach-lam-khoai-lang-ngao-duong-deo-bui-vang-uom-ngot-lim-an-la-me
Этот текст призван помочь читателю расширить кругозор и получить практические знания. Мы используем простой язык, наглядные примеры и структурированное изложение, чтобы сделать обучение максимально эффективным и увлекательным.
Подробная информация доступна по запросу – https://srntv.net/archives/7339.html
В этой публикации мы предлагаем подробные объяснения по актуальным вопросам, чтобы помочь читателям глубже понять их. Четкость и структурированность материала сделают его удобным для усвоения и применения в повседневной жизни.
Погрузиться в научную дискуссию – https://hostingwebid.com/jasa-pembuatan-website-makassar
Эта обзорная заметка содержит ключевые моменты и факты по актуальным вопросам. Она поможет читателям быстро ориентироваться в теме и узнать о самых важных аспектах сегодня. Получите краткий курс по современной информации и оставайтесь в курсе событий!
Нажми и узнай всё – https://phelionline.co.za/tag/accord
Этот увлекательный информационный материал подарит вам массу новых знаний и ярких эмоций. Мы собрали для вас интересные факты и сведения, которые обогатят ваш опыт. Откройте для себя увлекательный мир информации и насладитесь процессом изучения!
Почему это важно? – https://www.hotel-sugano.com/bbs/sugano.cgi/www.tovery.net/www.skitour.su/datasphere.ru/club/user/12/blog/2477/www.hip-hop.ru/forum/id298234-worksale/www.hip-hop.ru/forum/id298234-worksale/sinopipefittings.com/sugano.cgi?page30=val
Одним из наиболее удобных вариантов лечения является проведение процедуры в домашних условиях. Это особенно актуально для пациентов, которые чувствуют себя слишком плохо, чтобы отправиться в клинику, или желают сохранить анонимность.
Ознакомиться с деталями – https://kapelnica-ot-zapoya-krasnoyarsk55.ru/kapelnicza-ot-zapoya-na-domu-krasnoyarsk/
Используются препараты, нормализующие работу центральной нервной системы, корректирующие электролитный баланс и устраняющие симптомы алкогольной интоксикации. Применение седативных и противосудорожных средств снижает риск осложнений.
Подробнее тут – http://vyvod-iz-zapoya-rostov-na-donu13.ru
Эта публикация завернет вас в вихрь увлекательного контента, сбрасывая стереотипы и открывая двери к новым идеям. Каждый абзац станет для вас открытием, полным ярких примеров и впечатляющих достижений. Подготовьтесь быть вовлеченными и удивленными каждый раз, когда продолжите читать.
Более того — здесь – http://fashionableman.ru
Заключительная фаза реабилитации фокусируется на обучении пациента жизни без алкоголизма и развитии навыков преодоления жизненных трудностей естественным путем. В рамках этого этапа пациенты активно участвуют в специализированных программах, нацеленных на восстановление утраченных социальных связей и профессиональных компетенций. Программа включает трудотерапию, образовательные курсы и тематические семинары. Особое внимание уделяется работе с семьей: родственники проходят специальное обучение, помогающее им лучше понимать особенности зависимости быстро и эффективно оказывать поддержку близкому человеку.
Ознакомиться с деталями – вывод из запоя на дому круглосуточно красноярск
Зависимость — это не только физическая, но и психологическая проблема. Врач-нарколог предоставляет первичную психологическую помощь, помогает справиться с тревогой, страхами и чувством вины. Если необходимо, пациенту предлагаются дальнейшие консультации с психологами клиники «Новое Дыхание».
Выяснить больше – http://narcolog-na-dom-krasnoyarsk55.ru/narkolog-na-dom-krasnoyarsk-tseny/
Кроме того, врач приедет в любое удобное для пациента время, даже ночью, обеспечив круглосуточный доступ к медицинской помощи. Специалист подбирает индивидуальный состав капельницы, что позволяет оптимально поддержать организм в зависимости от состояния пациента.
Углубиться в тему – капельница от запоя на дому екатеринбург
Современная жизнь, особенно в крупном городе, как Красноярск, часто становится причиной различных зависимостей. Работа в условиях постоянного стресса, высокий ритм жизни и эмоциональные перегрузки могут привести к проблемам, которые требуют неотложной медицинской помощи. Одним из наиболее удобных решений в такой ситуации является вызов нарколога на дом.
Углубиться в тему – нарколог на дом круглосуточно красноярск
Капельница также рекомендуется для тех, кто испытывает сильный похмельный синдром после длительных запоев. Она помогает не только облегчить состояние, но и предотвратить развитие серьезных осложнений, таких как поражение печени, сердечно-сосудистые нарушения или острые психические расстройства.
Подробнее – http://kapelnica-ot-zapoya-krasnoyarsk55.ru
Эта медицинская заметка содержит сжатую информацию о новых находках и методах в области здравоохранения. Мы предлагаем читателям свежие данные о заболеваниях, профилактике и лечении. Наша цель — быстро и доступно донести важную информацию, которая поможет в повседневной жизни и понимании здоровья.
Подробнее можно узнать тут – вызвать нарколога на дом
На этом этапе врач детально выясняет, как долго продолжается запой, какие симптомы наблюдаются, и имеются ли сопутствующие заболевания. Точный анализ информации помогает оперативно определить степень интоксикации и подобрать оптимальные методы детоксикации, что является ключом к предотвращению дальнейших осложнений.
Выяснить больше – нарколог на дом в рязани
Процедура капельницы — это целый комплекс мероприятий, направленных на очистку организма и восстановление его нормальной работы. Для этого в капельницу добавляют раствор для регидратации, витамины, антиоксиданты, препараты для поддержания печени и успокоительные средства. Все компоненты способствуют быстрому очищению от токсинов, восстановлению психоэмоционального фона и нормализации обменных процессов.
Подробнее тут – https://kapelnica-ot-zapoya-ekb55.ru/kapelnicza-ot-zapoya-v-stacionare-ekaterinburg
После процедуры пациент и его близкие получают развернутые рекомендации по дальнейшему восстановлению, советы по профилактике рецидивов и возможности прохождения кодирования при желании пациента.
Изучить вопрос глубже – http://narcolog-na-dom-sankt-peterburg000.ru/psikhiatr-narkolog-na-dom-spb/
Основные задачи
Получить больше информации – центр лечения алкоголизма краснодарский край
Выездной формат позволяет избежать контактов с другими пациентами в клинике и очистить организм в привычной обстановке. Специалисты самостоятельно привозят весь необходимый набор медикаментов и расходных материалов.
Получить дополнительные сведения – наркологическая клиника екатеринбург.
Применяются растворы на основе физраствора, глюкозы, витаминов группы B, противорвотных, седативных и гепатопротекторов. Используемые препараты входят в реестр разрешённых лекарств.
Изучить вопрос глубже – vrach-narkolog-na-dom ekaterinburg
Вызов врача-нарколога на дом в Санкт-Петербурге начинается с детального осмотра и оценки состояния пациента. Врач измеряет давление, пульс, уровень кислорода в крови и определяет степень интоксикации.
Подробнее можно узнать тут – нарколог на дом санкт-петербург.
Основной этап, направленный на очищение организма от продуктов распада алкоголя и нормализацию функций внутренних органов. Применяются современные препараты с антиоксидантным и гепатопротекторным эффектом.
Подробнее – https://lechenie-alkogolizma-krasnodar0.ru/metody-lecheniya-alkogolizma-krasnodar
Кроме того, анонимность является важной составляющей этой услуги. Лечение дома исключает возможность столкновения с посторонними людьми и помогает пациентам сохранить свою репутацию. Клиника «Гармония и Свет» обеспечивает полную конфиденциальность, предоставляя пациентам возможность получать помощь без лишних вопросов и обсуждений.
Детальнее – нарколог на дом круглосуточно в екатеринбурге
Первичный этап заключается в оценке состояния пациента и быстром подборе схемы инфузионной терапии. Врач фиксирует показания ЭКГ, сатурацию кислорода и биохимический параметр глюкозы в крови. После этого подключается капельница с раствором для выведения продуктов распада алкоголя и одновременной коррекции показателей обмена веществ. Последующие визиты врача позволяют скорректировать терапию и предотвратить развитие побочных реакций.
Углубиться в тему – круглосуточная наркологическая помощь
Почему пациенты выбирают именно нас:
Получить дополнительную информацию – http://narkologicheskaya-pomoshch-lyubercy5.ru/
Алкогольная зависимость остаётся одной из самых серьёзных проблем современного общества. Злоупотребление алкоголем разрушает здоровье, негативно влияет на психику, приводит к разрыву семей, потере работы и социального статуса. Когда самостоятельные попытки побороть тягу к спиртному не приносят результата, эффективным выходом становится кодирование от алкоголизма — медицинская процедура, позволяющая на длительный срок блокировать желание употреблять спиртное и начать путь к полноценной жизни. В наркологической клинике «АлкоСвобода» в Мытищах для кодирования применяются только современные, безопасные и признанные методики, которые подбираются индивидуально для каждого пациента с учётом всех особенностей организма.
Изучить вопрос глубже – https://kodirovanie-ot-alkogolizma-mytishchi5.ru/kodirovanie-ot-alkogolizma-na-domu-v-mytishchah/
Эта доказательная статья представляет собой глубокое погружение в успехи и вызовы лечения зависимостей. Мы обращаемся к научным исследованиям и опыте специалистов, чтобы предоставить читателям надежные данные об эффективности различных методик. Изучите, что работает лучше всего, и получите информацию от экспертов.
Подробнее – нарколог на дом вывод из запоя
Если в состоянии пациента наблюдаются такие признаки, как судороги, панические атаки, или гипертонический криз, необходимо немедленно вызвать врачей. Задержка может привести к необратимым последствиям.
Подробнее тут – http://алко-ребцентр.рф
Запой — состояние, при котором человек теряет контроль над количеством употребляемого алкоголя и уже не может самостоятельно прекратить пить. Подобные эпизоды представляют серьёзную угрозу для здоровья, а порой и для жизни. Особенно опасен резкий отказ от спиртного после длительных запоев — это может вызвать тяжёлые абстинентные расстройства, нарушение работы сердца, печени, нервной системы, галлюцинации и даже приступы судорог. В такой ситуации необходимо срочно обращаться к профессионалам. В наркологической клинике «Спасение Плюс» в Химках вывод из запоя осуществляется с выездом врача, гарантией безопасности и индивидуальным подходом.
Подробнее можно узнать тут – vyvod-iz-zapoya-vyzov-na-dom
Капельница также рекомендуется для тех, кто испытывает сильный похмельный синдром после длительных запоев. Она помогает не только облегчить состояние, но и предотвратить развитие серьезных осложнений, таких как поражение печени, сердечно-сосудистые нарушения или острые психические расстройства.
Получить больше информации – http://kapelnica-ot-zapoya-krasnoyarsk55.ru/kapelnicza-ot-zapoya-v-stacionare-krasnoyarsk/https://kapelnica-ot-zapoya-krasnoyarsk55.ru
Вывод из запоя рекомендуется в следующих случаях:
Исследовать вопрос подробнее – вывод из запоя капельница москва
Этот информационный материал подробно освещает проблему наркозависимости, ее причины и последствия. Мы предлагаем информацию о методах лечения, профилактики и поддерживающих программах. Цель статьи — повысить осведомленность и продвигать идеи о необходимости борьбы с зависимостями.
Подробнее тут – нарколог на дом круглосуточно
Запой — это не просто временная слабость, а критическое состояние, требующее экстренного медицинского вмешательства. Особенно опасно откладывать обращение за помощью, если у человека наблюдаются такие симптомы:
Углубиться в тему – vyvod-iz-zapoya-cena-balashiha
Чем раньше начата профессиональная детоксикация, тем выше шанс восстановить здоровье и избежать критических осложнений. В клинике «Решение+» всегда готовы оперативно принять вызов и отправить бригаду наркологов на дом либо организовать транспортировку в стационар.
Изучить вопрос глубже – вывод из запоя анонимно ногинск
Процедура капельницы — это целый комплекс мероприятий, направленных на очистку организма и восстановление его нормальной работы. Для этого в капельницу добавляют раствор для регидратации, витамины, антиоксиданты, препараты для поддержания печени и успокоительные средства. Все компоненты способствуют быстрому очищению от токсинов, восстановлению психоэмоционального фона и нормализации обменных процессов.
Разобраться лучше – http://kapelnica-ot-zapoya-ekb55.ru
Почему пациенты выбирают именно нас:
Подробнее можно узнать тут – https://narkologicheskaya-pomoshch-lyubercy5.ru/
Детоксикация проводится в комфортных условиях, под постоянным наблюдением медперсонала. Пациенту назначают инфузионную терапию, препараты для поддержки печени, сердца, нервной системы. При выраженных абстинентных симптомах используются современные методы купирования синдрома — всё под контролем опытных врачей. Важно, что лечение в стационаре позволяет не только быстро купировать симптомы, но и вовремя скорректировать терапию при появлении осложнений.
Разобраться лучше – chastnaya-narkologicheskaya-klinika
Вызов врача-нарколога на дом позволяет избежать стресса госпитализации, обеспечивая комфорт и удобство как для пациента, так и для его близких.
Разобраться лучше – нарколог на дом вывод из запоя в санкт-петербурге
На этом этапе врач детально выясняет, как долго продолжается запой, какие симптомы наблюдаются, и имеются ли сопутствующие заболевания. Точный анализ информации помогает оперативно определить степень интоксикации и подобрать оптимальные методы детоксикации, что является ключом к предотвращению дальнейших осложнений.
Узнать больше – вызов нарколога на дом
Этот краткий обзор предлагает сжатую информацию из области медицины, включая ключевые факты и последние новости. Мы стремимся сделать информацию доступной и понятной для широкой аудитории, что позволит читателям оставаться в курсе актуальных событий в здравоохранении.
Выяснить больше – нарколог на дом
Лечение начинается с обязательной консультации врача-нарколога. На этом этапе специалист подробно выясняет особенности употребления, продолжительность зависимости, наличие хронических и сопутствующих заболеваний, а также психоэмоциональное состояние пациента. Диагностика позволяет выбрать максимально эффективную и безопасную методику кодирования.
Узнать больше – https://kodirovanie-ot-alkogolizma-mytishchi5.ru/centr-kodirovaniya-ot-alkogolizma-v-mytishchah
Ключевым этапом является снятие интоксикации и устранение абстинентного синдрома. Применяются препараты, направленные на нормализацию работы внутренних органов и поддержание общего состояния здоровья. Медикаментозная терапия включает назначение антидепрессантов, препаратов, блокирующих тягу к алкоголю, что подтверждается исследованиями, опубликованными на научном портале PubMed. Актуальные рекомендации по медикаментозному лечению алкоголизма доступны на Национальном центре здоровья.
Изучить вопрос глубже – лечение алкоголизма на дому
Выездной формат позволяет избежать контактов с другими пациентами в клинике и очистить организм в привычной обстановке. Специалисты самостоятельно привозят весь необходимый набор медикаментов и расходных материалов.
Разобраться лучше – наркологическая клиника екатеринбург.
Кроме того, анонимность является важной составляющей этой услуги. Лечение дома исключает возможность столкновения с посторонними людьми и помогает пациентам сохранить свою репутацию. Клиника «Гармония и Свет» обеспечивает полную конфиденциальность, предоставляя пациентам возможность получать помощь без лишних вопросов и обсуждений.
Подробнее можно узнать тут – https://narcolog-na-dom-ektb55.ru/narkolog-na-dom-ekaterinburg-tseny
Каждый пациент уникален — именно поэтому мы не применяем «типовых» решений. После первичной консультации и диагностики специалисты «КубаньМед» разрабатывают персональную программу, учитывающую состояние здоровья, психологические особенности и социальные обстоятельства пациента.
Исследовать вопрос подробнее – http://lechenie-alkogolizma-krasnodar0.ru/lechenie-alkogolizma-anonimno-krasnodar/
Вызов врача-нарколога на дом актуален в ситуациях, когда пациенту требуется срочная медицинская помощь, но его состояние не позволяет самостоятельно обратиться в клинику. Основными причинами вызова нарколога на дом являются:
Разобраться лучше – врач нарколог на дом ленинградская область
Первичный этап заключается в оценке состояния пациента и быстром подборе схемы инфузионной терапии. Врач фиксирует показания ЭКГ, сатурацию кислорода и биохимический параметр глюкозы в крови. После этого подключается капельница с раствором для выведения продуктов распада алкоголя и одновременной коррекции показателей обмена веществ. Последующие визиты врача позволяют скорректировать терапию и предотвратить развитие побочных реакций.
Получить дополнительные сведения – https://narkologicheskaya-pomoshh-ekaterinburg0.ru/neotlozhnaya-narkologicheskaya-pomoshh-v-ekb
Одним из наиболее удобных вариантов лечения является проведение процедуры в домашних условиях. Это особенно актуально для пациентов, которые чувствуют себя слишком плохо, чтобы отправиться в клинику, или желают сохранить анонимность.
Детальнее – https://kapelnica-ot-zapoya-krasnoyarsk55.ru/kapelnicza-ot-zapoya-v-stacionare-krasnoyarsk
Решение вызвать нарколога для вывода из запоя должно приниматься незамедлительно, если наблюдаются тревожные признаки:
Подробнее – вывод из запоя с выездом
Эта публикация обращает внимание на важность профилактики зависимостей. Мы обсудим, как осведомленность и образование могут помочь в предотвращении возникновения зависимости. Читатели смогут ознакомиться с полезными советами и ресурсами, которые способствуют здоровому образу жизни.
Разобраться лучше – запой нарколог на дом
Заключительная фаза реабилитации фокусируется на обучении пациента жизни без алкоголизма и развитии навыков преодоления жизненных трудностей естественным путем. В рамках этого этапа пациенты активно участвуют в специализированных программах, нацеленных на восстановление утраченных социальных связей и профессиональных компетенций. Программа включает трудотерапию, образовательные курсы и тематические семинары. Особое внимание уделяется работе с семьей: родственники проходят специальное обучение, помогающее им лучше понимать особенности зависимости быстро и эффективно оказывать поддержку близкому человеку.
Ознакомиться с деталями – вывод из запоя недорого
В подобных случаях самостоятельное лечение может привести к тяжёлым осложнениям, а промедление — стоить здоровья или даже жизни. Срочная наркологическая помощь — это шаг к безопасности и началу выздоровления.
Подробнее можно узнать тут – skoraya-narkologicheskaya-pomoshch-lyubercy
Такая услуга доступна круглосуточно, что позволяет вызвать врача в любое время. Профессиональные специалисты, приехав на дом, тщательно подберут состав капельницы с учетом индивидуальных особенностей пациента, чтобы обеспечить максимально эффективное лечение. Анонимность и высокая квалификация медперсонала делают этот способ особенно удобным для людей, которые предпочитают конфиденциальность.
Углубиться в тему – капельница от запоя на дому цена екатеринбург
Алкогольная зависимость остаётся одной из самых серьёзных проблем современного общества. Злоупотребление алкоголем разрушает здоровье, негативно влияет на психику, приводит к разрыву семей, потере работы и социального статуса. Когда самостоятельные попытки побороть тягу к спиртному не приносят результата, эффективным выходом становится кодирование от алкоголизма — медицинская процедура, позволяющая на длительный срок блокировать желание употреблять спиртное и начать путь к полноценной жизни. В наркологической клинике «АлкоСвобода» в Мытищах для кодирования применяются только современные, безопасные и признанные методики, которые подбираются индивидуально для каждого пациента с учётом всех особенностей организма.
Подробнее можно узнать тут – klinika-kodirovaniya-ot-alkogolizma
Эта процедура доступна как в условиях клиники, так и на дому, что делает ее универсальным решением для различных жизненных ситуаций. При этом важно доверять свое здоровье только профессиональным врачам, которые могут обеспечить безопасное и качественное лечение.
Подробнее – врач на дом капельница от запоя красноярск
Проблемы с алкоголем или наркотиками могут застать врасплох и привести к серьезным последствиям для организма, психического состояния и жизни пациента. Самостоятельные попытки выйти из запоя или преодолеть абстинентный синдром без медицинской поддержки редко оказываются эффективными и могут представлять реальную опасность для здоровья. Именно в таких ситуациях клиника «АльфаНаркология» предлагает услугу вызова нарколога на дом в Санкт-Петербурге и Ленинградской области. Наши специалисты оперативно реагируют на обращение, оказывают квалифицированную помощь и обеспечивают полную конфиденциальность лечения.
Подробнее – https://narcolog-na-dom-sankt-peterburg000.ru
Этап лечения
Разобраться лучше – лечение наркомании и алкоголизма краснодар
Когда запой становится угрозой для жизни, оперативное вмешательство становится ключевым для спасения здоровья и предотвращения серьезных осложнений. В Рязани вызов нарколога на дом позволяет начать лечение в самые критические моменты, обеспечивая детоксикацию организма и восстановление его нормального функционирования в условиях, где пациент чувствует себя комфортно и сохраняет свою конфиденциальность. Этот формат оказания медицинской помощи особенно актуален для тех, кто хочет избежать длительного ожидания в стационаре и предпочитает лечение в привычной домашней обстановке.
Изучить вопрос глубже – запой нарколог на дом в рязани
Клиника «НаркоМед» в Екатеринбурге предоставляет полный спектр наркологической помощи круглосуточно и анонимно. Благодаря мобильным бригадам и выездам на дом, пациенты получают профессиональное лечение прямо в комфортной обстановке, без стресса, связанного с госпитализацией. В статье подробно рассматриваются услуги клиники, этапы терапии и ключевые преимущества обращения в «НаркоМед».
Подробнее можно узнать тут – https://narkologicheskaya-klinika-ekaterinburg0.ru
В данном обзоре представлены основные направления и тренды в области медицины. Мы обсудим актуальные проблемы здравоохранения, свежие открытия и новые подходы, которые меняют представление о лечении и профилактике заболеваний. Эта информация будет полезна как специалистам, так и широкой публике.
Узнать больше – нарколог на дом вывод из запоя
Услуга вызова нарколога на дом в Красноярске — это удобный и современный способ получения медицинской помощи. Она идеально подходит для тех, кто нуждается в профессиональной поддержке, но по каким-либо причинам не может или не хочет посещать клинику.
Подробнее – http://narcolog-na-dom-krasnoyarsk55.ru
В этой статье мы подробно рассматриваем проверенные методы борьбы с зависимостями, включая психотерапию, медикаментозное лечение и поддержку со стороны общества. Мы акцентируем внимание на важности комплексного подхода и возможности успешного восстановления для людей, столкнувшихся с этой проблемой.
Углубиться в тему – нарколог на дом вывод
Капельница от запоя представляет собой инъекционную терапию, которая помогает очистить организм от токсинов, вызванных чрезмерным употреблением алкоголя. Состав капельницы включает специальные растворы, которые способствуют восстановлению водно-солевого баланса, а также витамины и препараты для нормализации функций печени и нервной системы. Это помогает пациенту избавиться от головной боли, слабости, тошноты и других симптомов похмелья, ускоряя процесс восстановления.
Узнать больше – http://kapelnica-ot-zapoya-ektb55.ru
В подобных случаях самостоятельное лечение может привести к тяжёлым осложнениям, а промедление — стоить здоровья или даже жизни. Срочная наркологическая помощь — это шаг к безопасности и началу выздоровления.
Детальнее – https://narkologicheskaya-pomoshch-lyubercy5.ru/anonimnaya-narkologicheskaya-pomoshch-v-lyubercah/
Решение вызвать нарколога для вывода из запоя должно приниматься незамедлительно, если наблюдаются тревожные признаки:
Узнать больше – http://vyvod-iz-zapoya-himki5.ru
Когда речь идет о лечении зависимостей, многие пациенты испытывают стресс от визита в медицинские учреждения, особенно если это касается такой деликатной темы, как алкоголизм. Лечение на дому помогает избежать всех этих трудностей и обеспечивает комфорт для пациента. Привычная домашняя обстановка снижает тревожность, что позитивно влияет на процесс выздоровления.
Подробнее – narcolog-na-dom-ektb55.ru/
Первичный этап заключается в оценке состояния пациента и быстром подборе схемы инфузионной терапии. Врач фиксирует показания ЭКГ, сатурацию кислорода и биохимический параметр глюкозы в крови. После этого подключается капельница с раствором для выведения продуктов распада алкоголя и одновременной коррекции показателей обмена веществ. Последующие визиты врача позволяют скорректировать терапию и предотвратить развитие побочных реакций.
Углубиться в тему – https://narkologicheskaya-pomoshh-ekaterinburg0.ru/skoraya-narkologicheskaya-pomoshh-v-ekb
Каждый пациент уникален — именно поэтому мы не применяем «типовых» решений. После первичной консультации и диагностики специалисты «КубаньМед» разрабатывают персональную программу, учитывающую состояние здоровья, психологические особенности и социальные обстоятельства пациента.
Получить дополнительные сведения – https://lechenie-alkogolizma-krasnodar0.ru/klinika-lecheniya-alkogolizma-krasnodar/
Алкоголь оказывает глубокое воздействие на здоровье: психоэмоциональное и физическое состояние человека значительно ухудшаются, если злоупотребление продолжается долго. Даже небольшие дозы алкоголя, употребляемые регулярно, вызывают накопление токсинов, которые приводят к расстройствам в работе сердечно-сосудистой системы, печени, почек и других жизненно важных органов.
Подробнее можно узнать тут – http://алко-ребцентр.рф
Вызов врача-нарколога на дом в Санкт-Петербурге начинается с детального осмотра и оценки состояния пациента. Врач измеряет давление, пульс, уровень кислорода в крови и определяет степень интоксикации.
Узнать больше – https://narcolog-na-dom-sankt-peterburg00.ru/narkolog-na-dom-czena-spb
Кроме того, врач оказывает психологическую поддержку, которая помогает пациенту справиться с чувством тревоги, депрессией и страхом, возникающими на фоне зависимости.
Получить дополнительную информацию – нарколог на дом красноярск
Алкогольная зависимость остается одной из самых серьезных проблем современного общества. Когда человек сталкивается с последствиями длительного употребления спиртных напитков, важно вовремя принять меры, чтобы минимизировать вред для организма. В таких случаях капельница от запоя становится эффективным инструментом для снятия интоксикации и восстановления здоровья.
Изучить вопрос глубже – вызвать капельницу от запоя в красноярске
Решение о необходимости кодирования может возникнуть как у самого человека, так и у его близких, если:
Получить дополнительную информацию – анонимное кодирование от алкоголизма
Запой — это состояние, которое представляет собой одну из самых серьёзных форм алкогольной зависимости. Когда человек теряет способность контролировать употребление алкоголя, его организм подвергается вредному воздействию, которое может вызвать как физические, так и психоэмоциональные осложнения. В Москве есть множество клиник и специалистов, которые предлагают качественную медицинскую помощь, включая анонимное лечение. Этот вариант подходит тем, кто хочет избавиться от зависимости, не раскрывая свою личность и не сталкиваясь с осуждением окружающих.
Изучить вопрос глубже – вывод из запоя москва
Особое внимание в клинике уделяется постоянному контролю за состоянием: врачи и медсёстры следят за показателями здоровья, в любой момент могут скорректировать курс терапии или подключить дополнительных специалистов. Все препараты подбираются индивидуально — с учётом возраста, стажа употребления, веса, состояния органов и особенностей сопутствующих заболеваний.
Получить дополнительную информацию – vrach-vyvod-iz-zapoya
Алкогольная зависимость — одна из самых распространенных проблем нашего времени, требующая немедленного и грамотного вмешательства. В Екатеринбурге капельница от запоя является одним из самых популярных и действенных методов восстановления после длительного употребления алкоголя. Она помогает организму справиться с интоксикацией, восстанавливает физическое и эмоциональное состояние пациента, улучшает самочувствие в короткие сроки. При этом лечение может быть организовано как в стационаре, так и на дому, в зависимости от удобства пациента.
Углубиться в тему – вызвать капельницу от запоя
В подобных случаях самостоятельное лечение может привести к тяжёлым осложнениям, а промедление — стоить здоровья или даже жизни. Срочная наркологическая помощь — это шаг к безопасности и началу выздоровления.
Подробнее можно узнать тут – срочная наркологическая помощь
Эта публикация исследует взаимосвязь зависимости и психологии. Мы обсудим, как психологические аспекты влияют на появление зависимостей и процесс выздоровления. Читатели смогут понять важность профессиональной поддержки и применения научных подходов в терапии.
Разобраться лучше – выезд нарколога на дом
Алкогольная зависимость – заболевание, при котором страдает не только тело, но и психика человека. При длительных запоях нарушается работа сердца, печени, почек, появляются острые психоэмоциональные расстройства: тревожность, страхи, агрессия, проблемы со сном. В стадии абстиненции часто отмечается учащённый пульс, скачки давления, дрожь в руках, галлюцинации. Это крайне опасное состояние, требующее профессионального вмешательства нарколога. Клиника «Решение+» в Ногинске предлагает квалифицированный вывод из запоя на дому и в стационаре — с индивидуальным подходом, круглосуточной поддержкой и полным соблюдением анонимности.
Подробнее – https://vyvod-iz-zapoya-noginsk5.ru/srochnyj-vyvod-iz-zapoya-v-noginske
Попытка самостоятельно выйти из запоя или преодолеть тяжелое похмелье может привести к крайне негативным последствиям. Длительное употребление алкоголя или резкий отказ без врачебного контроля опасны развитием осложнений, таких как алкогольный психоз, инсульт, инфаркт, обезвоживание и острая сердечная недостаточность.
Получить дополнительные сведения – [url=https://narcolog-na-dom-sankt-peterburg000.ru/]врач нарколог на дом[/url]
Зависимость от алкоголя или наркотиков — серьёзная проблема, которая постепенно разрушает жизнь, подрывает здоровье, нарушает семейные отношения и ведёт к социальной изоляции. Попытки самостоятельно справиться с заболеванием редко приводят к успеху и зачастую только усугубляют ситуацию. Важно не терять время и обращаться за профессиональной помощью. В наркологической клинике «Наркосфера» в Балашихе пациентов ждёт современное оборудование, команда опытных специалистов, индивидуальный подход и абсолютная анонимность.
Выяснить больше – narkologicheskaya-klinika
Этап лечения
Разобраться лучше – наркология лечение алкоголизма
В зависимости от тяжести состояния и наличия осложнений клиника «Спасение Плюс» предлагает:
Получить больше информации – https://vyvod-iz-zapoya-himki5.ru/srochnyj-vyvod-iz-zapoya-v-himkah
Пациенты клиники «НаркоМед» полностью застрахованы от утечки личной информации. Приём и лечение оформляются по псевдониму, документы не передаются в другие организации.
Получить дополнительные сведения – платная наркологическая клиника
Эти данные являются основой для составления индивидуального плана лечения, позволяющего оперативно скорректировать терапевтические меры.
Выяснить больше – нарколог на дом клиника
Одним из наиболее удобных вариантов лечения является проведение процедуры в домашних условиях. Это особенно актуально для пациентов, которые чувствуют себя слишком плохо, чтобы отправиться в клинику, или желают сохранить анонимность.
Подробнее – капельница от запоя анонимно в красноярске
В подобных случаях самостоятельное лечение может привести к тяжёлым осложнениям, а промедление — стоить здоровья или даже жизни. Срочная наркологическая помощь — это шаг к безопасности и началу выздоровления.
Получить больше информации – http://narkologicheskaya-pomoshch-lyubercy5.ru
Этот обзор посвящен успешным стратегиям избавления от зависимости, включая реальные примеры и советы. Мы разоблачим мифы и предоставим читателям достоверную информацию о различных подходах. Получите опыт многообразия методов и найдите подходящий способ для себя!
Разобраться лучше – нарколог на дом анонимно
Публикация предлагает уникальную подборку информации, которая будет интересна как специалистам, так и широкому кругу читателей. Здесь вы найдете ответы на часто задаваемые вопросы и полезные инсайты для дальнейшего применения.
Доступ к полной версии – https://aksaramaya.com/kenali-lebih-dalam-aplikasi-gecoo-dengan-berkunjung-ke-perpustakaan-daerah
С момента основания клиники мы делаем ставку на сочетание передовых медицинских протоколов и внимания к каждому пациенту. Наши наркологи регулярно проходят обучение на базе ведущих российских и европейских центров, что позволяет внедрять в практику новые аппараты для аппаратной детоксикации, в том числе плазмаферез и молекулярное диализирование. Психологи и психотерапевты клиники работают по стандартам когнитивно-поведенческой терапии и мотивационного интервьюирования, а наши реабилитационные курсы аккредитованы в Международной ассоциации специалистов по алкоголизму и наркомании.
Ознакомиться с деталями – http://narkologicheskaya-klinika-zhukovskij4.ru/
Публикация приглашает вас исследовать неизведанное — от древних тайн до современных достижений науки. Вы узнаете, как случайные находки превращались в революции, а смелые мысли — в новые эры человеческого прогресса.
Нажми и узнай всё – https://aichi-gorin-abilym.jp/?p=1
В этой публикации мы предлагаем подробные объяснения по актуальным вопросам, чтобы помочь читателям глубже понять их. Четкость и структурированность материала сделают его удобным для усвоения и применения в повседневной жизни.
Неизвестные факты о… – https://ihsanschools.ac.tz/events/sports-day
Эта информационная заметка содержит увлекательные сведения, которые могут вас удивить! Мы собрали интересные факты, которые сделают вашу жизнь ярче и полнее. Узнайте нечто новое о привычных аспектах повседневности и откройте для себя удивительный мир информации.
Лови подробности – http://fefilmlab.com/dinheiro-publico-e-importante-mas-precisamos-de-um-plano-b-afirma-rodrigo-teixeira-durante-painel-de-abertura-do-fe
Этот информативный текст выделяется своими захватывающими аспектами, которые делают сложные темы доступными и понятными. Мы стремимся предложить читателям глубину знаний вместе с разнообразием интересных фактов. Откройте новые горизонты и развивайте свои способности познавать мир!
Лучшее решение — прямо здесь – https://www.e-bordereaux.ci/main/index.php/component/k2/item/28-readable-content-when-looking?start=13850
Эта информационная заметка содержит увлекательные сведения, которые могут вас удивить! Мы собрали интересные факты, которые сделают вашу жизнь ярче и полнее. Узнайте нечто новое о привычных аспектах повседневности и откройте для себя удивительный мир информации.
Только для своих – https://qualitytools.co.ug/index.php/2021/10/25/hello-world
В этой информационной статье вы найдете интересное содержание, которое поможет вам расширить свои знания. Мы предлагаем увлекательный подход и уникальные взгляды на обсуждаемые темы, побуждая пользователей к активному мышлению и критическому анализу.
Нажми и узнай всё – https://topic.lk/2757
Этот информационный обзор станет отличным путеводителем по актуальным темам, объединяющим важные факты и мнения экспертов. Мы исследуем ключевые идеи и представляем их в доступной форме для более глубокого понимания. Читайте, чтобы оставаться в курсе событий!
Более того — здесь – http://www.annaskuriosa.se/?attachment_id=297
В этой статье представлен занимательный и актуальный контент, который заставит вас задуматься. Мы обсуждаем насущные вопросы и проблемы, а также освещаем истории, которые вдохновляют на действия и изменения. Узнайте, что стоит за событиями нашего времени!
Что ещё? Расскажи всё! – http://cbs.torzhok.tverlib.ru/nebo-vybralo-nas-prezentaciya-knigi-va-frolkina
В этой публикации мы предлагаем подробные объяснения по актуальным вопросам, чтобы помочь читателям глубже понять их. Четкость и структурированность материала сделают его удобным для усвоения и применения в повседневной жизни.
Все материалы собраны здесь – http://russianicons.ru/order.php?obj=47
В этом информативном тексте представлены захватывающие события и факты, которые заставят вас задуматься. Мы обращаем внимание на важные моменты, которые часто остаются незамеченными, и предлагаем новые перспективы на привычные вещи. Подготовьтесь к тому, чтобы быть поглощенным увлекательными рассказами!
Осуществить глубокий анализ – https://www.osteo.cz/post-3
В данной статье рассматриваются проблемы общественного здоровья и социальные факторы, влияющие на него. Мы акцентируем внимание на значении профилактики и осведомленности в защите здоровья на уровне общества. Читатели смогут узнать о новых инициативах и программах, направленных на улучшение здоровья населения.
Выяснить больше – https://narkolog-na-dom-krasnodar16.ru
Этот текст призван помочь читателю расширить кругозор и получить практические знания. Мы используем простой язык, наглядные примеры и структурированное изложение, чтобы сделать обучение максимально эффективным и увлекательным.
Только для своих – https://www.pizzeria40.com/roast-beef-with-caramelised-onion-gravy-recipe-3
Мы предлагаем вам подробное руководство, основанное на проверенных источниках и реальных примерах. Каждая часть публикации направлена на то, чтобы помочь вам разобраться в сложных вопросах и применить знания на практике.
Доступ к полной версии – https://topic.lk/2913
Этот информативный текст отличается привлекательным содержанием и актуальными данными. Мы предлагаем читателям взглянуть на привычные вещи под новым углом, предоставляя интересный и доступный материал. Получите удовольствие от чтения и расширьте кругозор!
Ссылка на источник – https://winebooks-school.net/chassagne
Эта информационная статья содержит полезные факты, советы и рекомендации, которые помогут вам быть в курсе последних тенденций и изменений в выбранной области. Материал составлен так, чтобы быть полезным и понятным каждому.
Смотрите также… – http://rulesenka.ru
Эта обзорная заметка содержит ключевые моменты и факты по актуальным вопросам. Она поможет читателям быстро ориентироваться в теме и узнать о самых важных аспектах сегодня. Получите краткий курс по современной информации и оставайтесь в курсе событий!
Расширить кругозор по теме – https://topic.lk/12318
В этой статье вы найдете познавательную и занимательную информацию, которая поможет вам лучше понять мир вокруг. Мы собрали интересные данные, которые вдохновляют на размышления и побуждают к действиям. Открывайте новую информацию и получайте удовольствие от чтения!
Почему это важно? – http://3wordpress.ru
Одним из наиболее удобных вариантов лечения является проведение процедуры в домашних условиях. Это особенно актуально для пациентов, которые чувствуют себя слишком плохо, чтобы отправиться в клинику, или желают сохранить анонимность.
Изучить вопрос глубже – http://kapelnica-ot-zapoya-krasnoyarsk55.ru
Красноярск, как и любой крупный город, сталкивается с распространенными проблемами зависимости. Учитывая высокий уровень стресса, социальное давление и быстрое развитие мегаполиса, люди часто оказываются в сложных ситуациях, связанных с алкогольной или наркотической зависимостью. В таких случаях своевременная помощь квалифицированного нарколога становится не просто желательной, а жизненно необходимой.
Узнать больше – вызвать нарколога на дом в красноярске
Перед кодированием важно снять острую интоксикацию и стабилизировать состояние. В «Орион-Клиник» пациенту проводят курс инфузионной терапии: капельницы с регидратационными растворами, гепатопротекторами и витаминно-минеральными комплексами. Это позволяет восстановить водно-электролитный баланс, поддержать функции печени и почек, нормализовать артериальное давление и работу сердца. Одновременно психолог проводит предварительные беседы для выяснения причин зависимости, уровня тревожности и мотивации. Подготовительный этап длится от одного до трёх дней в зависимости от тяжести состояния и поможет снизить риск побочных эффектов при введении кодирующего препарата.
Узнать больше – кодирование от алкоголизма на дому
После первичной диагностики начинается активная фаза детоксикации. Современные препараты вводятся капельничным методом, что позволяет быстро вывести токсины и восстановить нормальные обменные процессы. Этот этап критически важен для стабилизации работы печени, почек и сердечно-сосудистой системы.
Подробнее – https://kapelnica-ot-zapoya-tyumen0.ru/kapelnicza-ot-zapoya-na-domu-czena-tyumen/
Наркологический центр “Чистое Завтра” специализируется на лечении и реабилитации пациентов с различными формами зависимостей. Наша деятельность базируется на принципах доказательной медицины, биопсихосоциальной модели аддикции, индивидуальном подходе к каждому пациенту. Мы используем современные протоколы лечения, эффективность которых подтверждена многочисленными клиническими исследованиями.
Выяснить больше – https://алко-консультация.рф/vivod-iz-zapoya-v-stacionare-v-Moskve/
Сразу после поступления вызова нарколог прибывает на дом для проведения детального первичного осмотра. Врач собирает краткий анамнез, измеряет жизненно важные показатели, такие как пульс, артериальное давление и температура, и оценивает степень интоксикации. Эта информация является фундаментом для разработки индивидуального плана терапии, который учитывает особенности состояния пациента.
Разобраться лучше – вывод из запоя капельница
Эта информационная публикация освещает широкий спектр тем из мира медицины. Мы предлагаем читателям ясные и понятные объяснения современных заболеваний, методов профилактики и лечения. Информация будет полезна как пациентам, так и медицинским работникам, желающим поддержать уровень своих знаний.
Ознакомиться с деталями – вызов нарколога на дом
Алкогольная зависимость может стремительно ухудшать состояние здоровья, превращаясь в запой, сопровождающийся серьезной интоксикацией организма. В Санкт-Петербурге профессиональные наркологи выезжают на дом круглосуточно, чтобы оказать экстренную помощь в критических ситуациях. Такой формат лечения позволяет начать детоксикацию сразу после обращения, обеспечивая оперативное вмешательство в комфортных условиях, где пациент сохраняет свою конфиденциальность.
Получить дополнительную информацию – http://narco-vivod-clean.ru/narkolog-na-dom-czena-spb/
Врач уточняет продолжительность запоя, характер употребляемого алкоголя и наличие сопутствующих заболеваний. Детальное обследование позволяет оперативно подобрать необходимые медикаменты и минимизировать риск осложнений.
Детальнее – https://kapelnica-ot-zapoya-tyumen00.ru/postavit-kapelniczu-ot-zapoya-tyumen/
Этот формат позволяет пациентам получить профессиональную помощь в комфортной домашней обстановке. Такой подход не только обеспечивает удобство, но и гарантирует конфиденциальность, что особенно важно для многих людей.
Выяснить больше – вызов нарколога на дом в красноярске
Запой — это не просто злоупотребление алкоголем, а опасное состояние, при котором организм уже не может самостоятельно справиться с токсинами. Чем дольше продолжается запой, тем сложнее выход из него и тем выше риск осложнений.
Исследовать вопрос подробнее – https://наркология-дома.рф/vyvod-iz-zapoya-czena-v-krasnodare
Все больше людей в Екатеринбурге выбирают капельницу на дому, и это не случайно. Данная услуга имеет несколько важных преимуществ. Во-первых, это анонимность — пациент может получить помощь без необходимости посещать медицинское учреждение. Во-вторых, лечение на дому позволяет избежать лишнего стресса, который может возникнуть при пребывании в больнице. Пациент чувствует себя в своей обстановке, что способствует лучшему восстановлению.
Подробнее можно узнать тут – врач на дом капельница от запоя екатеринбург
Комплексный подход к выводу из запоя на дому в Ярославле включает несколько основных этапов, которые позволяют обеспечить оперативное и безопасное лечение:
Исследовать вопрос подробнее – http://
Врач назначает комплекс препаратов для нормализации состояния и устранения интоксикации. Применяются детоксикационные средства для очищения организма и облегчения абстинентного синдрома. Важным компонентом терапии являются витаминные комплексы и минералы, восстанавливающие метаболический баланс. При необходимости назначаются седативные препараты для снижения тревожности и нормализации сна. Также используются гепатопротекторы и другие средства для поддержки органов, пострадавших от алкогольной интоксикации.
Получить дополнительные сведения – вывод из запоя клиника красноярск
Длительный запой может привести к серьезным осложнениям, таким как повреждение печени, почек, сердечно-сосудистые нарушения и нервные расстройства. Чем быстрее начинается вывод из запоя, тем ниже риск развития хронических заболеваний. Срочный вызов нарколога на дом позволяет в первые часы кризиса начать детоксикацию, что существенно повышает шансы на полное восстановление организма. В условиях экстренной ситуации каждая минута имеет решающее значение, и своевременная помощь становится ключом к сохранению здоровья и жизни.
Узнать больше – narkolog-vyvod-iz-zapoya tula
В этой статье мы обсудим процесс восстановления после зависимостей, акцентируя внимание на различных методах и подходах к реабилитации. Читатели узнают, как создать план выздоровления и использовать полезные ресурсы для достижения устойчивых изменений.
Узнать больше – выезд нарколога на дом
Выбор места лечения зависит от состояния пациента. Если симптомы умеренные и пациент способен самостоятельно поддерживать контакт с врачом, возможно лечение на дому. Однако при более сложных случаях, когда необходим постоянный контроль и интенсивная терапия, рекомендуется госпитализация.
Узнать больше – https://наркология-помощь.рф/vyvod-iz-zapoya-na-domu-rostov-na-donu
Капельница также рекомендуется для тех, кто испытывает сильный похмельный синдром после длительных запоев. Она помогает не только облегчить состояние, но и предотвратить развитие серьезных осложнений, таких как поражение печени, сердечно-сосудистые нарушения или острые психические расстройства.
Получить больше информации – капельница от запоя цена красноярск
В этой статье мы обсудим процесс восстановления после зависимостей, акцентируя внимание на различных методах и подходах к реабилитации. Читатели узнают, как создать план выздоровления и использовать полезные ресурсы для достижения устойчивых изменений.
Получить дополнительную информацию – нарколог на дом вывод из запоя
Сразу после вызова нарколог приезжает на дом для проведения первичного осмотра и диагностики. На этом этапе проводится сбор анамнеза, измеряются жизненно важные показатели (пульс, артериальное давление, температура) и определяется степень алкогольной интоксикации. Эти данные являются основой для разработки индивидуального плана лечения.
Получить больше информации – http://kapelnica-ot-zapoya-tyumen0.ru
В этой заметке мы представляем шаги, которые помогут в процессе преодоления зависимостей. Рассматриваются стратегии поддержки и чек-листы для тех, кто хочет сделать первый шаг к выздоровлению. Наша цель — вдохновить читателей на положительные изменения и поддержать их в трудных моментах.
Получить дополнительную информацию – narkolog-na-dom
Далее, когда физическое состояние стабилизировано, совместно с врачом выбирается стратегия дальнейшего лечения. В «Новая Точка» доступны современные методы кодирования (уколы, таблетки, вшивание препаратов, гипнотерапия), но решение всегда принимается осознанно, с объяснением плюсов, рисков и индивидуальным подбором метода.
Разобраться лучше – https://lechenie-alkogolizma-korolev5.ru/lechenie-alkogolizma-anonimno-v-koroleve/
Этот обзор сосредоточен на различных подходах к избавлению от зависимости. Мы изучим традиционные и альтернативные методы, а также их сочетание для достижения максимальной эффективности. Читатели смогут открыть для себя новые стратегии и подходы, которые помогут в их борьбе с зависимостями.
Детальнее – narkolog-na-dom-czena
Основу капельницы составляют инфузионные растворы, которые помогают устранить обезвоживание. Дополнительно вводятся витамины для улучшения обменных процессов, препараты для защиты печени, а также успокоительные средства для стабилизации нервной системы. Компоненты подбираются индивидуально с учетом состояния пациента, чтобы обеспечить максимальную эффективность и безопасность.
Разобраться лучше – капельница от запоя на дому красноярск.
При поступлении вызова нарколог незамедлительно приезжает на дом для проведения тщательного осмотра. На этом этапе специалист измеряет жизненно важные показатели, собирает подробный анамнез и определяет степень интоксикации. Эти данные являются ключевыми для составления индивидуального плана лечения.
Подробнее – https://kapelnica-ot-zapoya-tyumen00.ru/kapelnicza-ot-zapoya-na-domu-czena-tyumen
Эта доказательная статья представляет собой глубокое погружение в успехи и вызовы лечения зависимостей. Мы обращаемся к научным исследованиям и опыте специалистов, чтобы предоставить читателям надежные данные об эффективности различных методик. Изучите, что работает лучше всего, и получите информацию от экспертов.
Изучить вопрос глубже – vyzov-narkologa-na-dom
Комплексный подход к выводу из запоя на дому в Ярославле включает несколько основных этапов, которые позволяют обеспечить оперативное и безопасное лечение:
Детальнее – срочный вывод из запоя
Врач уточняет длительность запоя, тип употребляемого алкоголя и наличие сопутствующих заболеваний. Тщательный анализ этой информации позволяет оперативно определить степень интоксикации и подобрать наиболее эффективные методы терапии, минимизируя риск осложнений.
Изучить вопрос глубже – вывод из запоя анонимно
Наркологический центр “Чистое Завтра” специализируется на лечении и реабилитации пациентов с различными формами зависимостей. Наша деятельность базируется на принципах доказательной медицины, биопсихосоциальной модели аддикции, индивидуальном подходе к каждому пациенту. Мы используем современные протоколы лечения, эффективность которых подтверждена многочисленными клиническими исследованиями.
Получить дополнительные сведения – http://алко-консультация.рф
Системы автоматизированного дозирования обеспечивают точное введение медикаментов, минимизируя риск передозировки и побочных эффектов. Постоянный мониторинг жизненно важных показателей позволяет врачу оперативно корректировать терапевтическую схему для достижения максимальной безопасности и эффективности.
Изучить вопрос глубже – вывод из запоя
Доступность услуги и оперативность реагирования гарантируют, что помощь будет оказана в течение 30–60 минут после вызова. Это позволяет не только быстро начать детоксикацию, но и минимизировать риск развития осложнений, таких как повреждение печени, почек и сердечно-сосудистой системы.
Исследовать вопрос подробнее – вывод из запоя на дому в туле
На данном этапе специалист уточняет, как долго продолжается запой, какой вид алкоголя употребляется и имеются ли сопутствующие заболевания. Тщательный анализ информации позволяет оперативно определить степень интоксикации и выбрать оптимальные методы терапии для быстрого и безопасного вывода из запоя.
Узнать больше – вывод из запоя клиника
Красноярск, как и любой крупный город, сталкивается с распространенными проблемами зависимости. Учитывая высокий уровень стресса, социальное давление и быстрое развитие мегаполиса, люди часто оказываются в сложных ситуациях, связанных с алкогольной или наркотической зависимостью. В таких случаях своевременная помощь квалифицированного нарколога становится не просто желательной, а жизненно необходимой.
Получить дополнительную информацию – http://
Такие признаки требуют экстренного вмешательства, чтобы не допустить ухудшения состояния и сохранить жизнь пациента.
Подробнее можно узнать тут – http://
Следующий этап — медикаментозная поддержка, которая включает препараты для защиты печени, улучшения работы сердечно-сосудистой системы и снижения симптомов абстиненции. В зависимости от состояния пациента могут применяться седативные и ноотропные препараты, позволяющие стабилизировать психоэмоциональный фон и устранить тревожность.
Подробнее – https://наркология-дома.рф
Врач уточняет, как долго продолжается запой, какие симптомы наблюдаются и присутствуют ли сопутствующие заболевания. Тщательный сбор информации позволяет оперативно подобрать необходимые медикаменты и начать детоксикацию.
Углубиться в тему – капельница от запоя в тюмени
Этот обзор сосредоточен на различных подходах к избавлению от зависимости. Мы изучим традиционные и альтернативные методы, а также их сочетание для достижения максимальной эффективности. Читатели смогут открыть для себя новые стратегии и подходы, которые помогут в их борьбе с зависимостями.
Выяснить больше – вызов врача нарколога на дом
В этом обзоре мы обсудим современные методы борьбы с зависимостями, включая медикаментозную терапию и психотерапию. Мы представим последние исследования и их результаты, чтобы читатели могли быть в курсе наиболее эффективных подходов к лечению и поддержке.
Узнать больше – нарколог на дом клиника
Основу капельницы составляют инфузионные растворы, которые помогают устранить обезвоживание. Дополнительно вводятся витамины для улучшения обменных процессов, препараты для защиты печени, а также успокоительные средства для стабилизации нервной системы. Компоненты подбираются индивидуально с учетом состояния пациента, чтобы обеспечить максимальную эффективность и безопасность.
Получить дополнительные сведения – врач на дом капельница от запоя
Профессионализм медицинского персонала имеет решающее значение для успешности лечения. Только опытные врачи могут правильно оценить состояние пациента, выбрать подходящий состав растворов и корректно провести терапию, исключив риски побочных эффектов. Опытный специалист гарантирует, что процедура будет выполнена правильно, а пациент получит все необходимые препараты для быстрого восстановления.
Получить дополнительную информацию – капельница от запоя наркология в екатеринбурге
Врач назначает комплекс препаратов для нормализации состояния и устранения интоксикации. Применяются детоксикационные средства для очищения организма и облегчения абстинентного синдрома. Важным компонентом терапии являются витаминные комплексы и минералы, восстанавливающие метаболический баланс. При необходимости назначаются седативные препараты для снижения тревожности и нормализации сна. Также используются гепатопротекторы и другие средства для поддержки органов, пострадавших от алкогольной интоксикации.
Ознакомиться с деталями – вывод из запоя анонимно
На этом этапе специалист уточняет, сколько времени продолжается запой, какие основные симптомы наблюдаются, и если имеются, то какие хронические заболевания могут влиять на течение терапии. Точный анализ этих данных позволяет сформировать персонализированную стратегию лечения, которая будет максимально адаптирована к состоянию пациента и его потребностям.
Углубиться в тему – вывод из запоя в стационаре в ярославле
В данной статье рассматриваются проблемы общественного здоровья и социальные факторы, влияющие на него. Мы акцентируем внимание на значении профилактики и осведомленности в защите здоровья на уровне общества. Читатели смогут узнать о новых инициативах и программах, направленных на улучшение здоровья населения.
Изучить вопрос глубже – нарколог на дом
Когда запой превращается в угрозу для жизни, оперативное вмешательство становится критически важным. В Тюмени, Тюменская область, опытные наркологи предлагают услугу установки капельницы от запоя прямо на дому. Такой метод позволяет начать детоксикацию с использованием современных медикаментов, что способствует быстрому выведению токсинов, восстановлению обменных процессов и нормализации работы внутренних органов. Лечение на дому обеспечивает комфортную обстановку, полную конфиденциальность и индивидуальный подход к каждому пациенту.
Получить дополнительную информацию – http://kapelnica-ot-zapoya-tyumen00.ru/
Сразу после вызова нарколог прибывает на дом для проведения тщательного первичного осмотра. На этом этапе специалист собирает краткий анамнез, измеряет жизненно важные показатели – пульс, артериальное давление, температуру – и оценивает степень алкогольной интоксикации. Полученные данные служат основой для составления индивидуального плана лечения, позволяющего подобрать оптимальные методы детоксикации.
Углубиться в тему – вывод из запоя недорого
Например, если речь идет о выводе из запоя, врач проведет тщательное обследование пациента, чтобы определить общее состояние здоровья и наличие возможных осложнений. На основе диагностики будет назначена инфузионная терапия, которая включает введение растворов, витаминов и препаратов для снятия абстиненции.
Выяснить больше – [url=https://narcolog-na-dom-v-krasnoyarske55.ru/]narcolog-na-dom-v-krasnoyarske55.ru/[/url]
Системы автоматизированного дозирования обеспечивают точное введение медикаментов, минимизируя риск передозировки и побочных эффектов. Постоянный мониторинг жизненно важных показателей позволяет врачу оперативно корректировать терапевтическую схему для достижения максимальной безопасности и эффективности.
Получить дополнительные сведения – вывод из запоя круглосуточно в санкт-петербурге
Доступность услуги и оперативность реагирования гарантируют, что помощь будет оказана в течение 30–60 минут после вызова. Это позволяет не только быстро начать детоксикацию, но и минимизировать риск развития осложнений, таких как повреждение печени, почек и сердечно-сосудистой системы.
Получить дополнительную информацию – http://vyvod-iz-zapoya-tula000.ru
Вывод из запоя на дому в Туле осуществляется по строго отлаженной схеме, которая включает несколько последовательных этапов. Такой комплексный подход позволяет не только быстро вывести токсины из организма, но и обеспечить всестороннюю поддержку пациента, включая психологическую реабилитацию.
Детальнее – вывод из запоя на дому цена в туле
Дисфункция нейромедиаторных систем головного мозга, обусловленная длительным воздействием психоактивных веществ, приводит к формированию патологического влечения — абстинентного синдрома.
Детальнее – https://алко-консультация.рф/vivod-iz-zapoya-na-domu-v-Moskve
Основу капельницы составляют инфузионные растворы, которые помогают устранить обезвоживание. Дополнительно вводятся витамины для улучшения обменных процессов, препараты для защиты печени, а также успокоительные средства для стабилизации нервной системы. Компоненты подбираются индивидуально с учетом состояния пациента, чтобы обеспечить максимальную эффективность и безопасность.
Углубиться в тему – капельница от запоя красноярский край
Эта публикация содержит ценные советы и рекомендации по избавлению от зависимости. Мы обсуждаем различные стратегии, которые могут помочь в процессе выздоровления и важность обращения за помощью. Читатели смогут использовать полученные знания для улучшения своего состояния.
Ознакомиться с деталями – вызвать нарколога на дом
Запой не проходит самостоятельно, и если он длится несколько дней, организм начинает страдать от накопления токсинов. В этом случае необходимо немедленно обратиться за помощью к профессионалам, чтобы предотвратить развитие опасных осложнений.
Подробнее тут – https://наркология-помощь.рф/vyvod-iz-zapoya-klinika-rostov-na-donu
Сразу после вызова нарколог приезжает на дом для проведения первичного осмотра и диагностики. На этом этапе проводится сбор анамнеза, измеряются жизненно важные показатели (пульс, артериальное давление, температура) и определяется степень алкогольной интоксикации. Эти данные являются основой для разработки индивидуального плана лечения.
Изучить вопрос глубже – https://kapelnica-ot-zapoya-tyumen0.ru/
В клинике каждому пациенту уделяют особое внимание. Врачи знают: универсальных решений нет, за каждым случаем — своя история и свои причины. Первый контакт начинается с конфиденциальной консультации. Можно просто позвонить или написать онлайн — уже на этом этапе врач поможет оценить ситуацию, объяснит возможные этапы и даст рекомендации по подготовке к визиту.
Подробнее тут – http://lechenie-alkogolizma-korolev5.ru/lechenie-alkogolizma-na-domu-v-koroleve/
Признаки, указывающие на необходимость медицинского вмешательства:
Подробнее – https://наркология-дома.рф/vyvod-iz-zapoya-kruglosutochno-v-krasnodare
Первый шаг в лечении — это тщательный осмотр специалиста. Наряду с измерением жизненно важных показателей (пульс, артериальное давление, температура) врач проводит сбор анамнеза, выясняя длительность запоя, тип употребляемого алкоголя и наличие сопутствующих заболеваний. Эти данные помогают оценить степень интоксикации и подобрать индивидуальный план терапии, что является ключевым для дальнейшей эффективной детоксикации.
Разобраться лучше – вывод из запоя круглосуточно
При сильной интоксикации требуется полное очищение организма от токсинов. Детоксикация помогает нормализовать работу внутренних органов, улучшить общее состояние пациента и восстановить баланс жидкостей в организме. Специалист использует современные препараты, включая электролиты, глюкозу и антиоксиданты, для безопасного и эффективного очищения организма.
Изучить вопрос глубже – вызвать нарколога на дом
Комплексное лечение организовано по строго отлаженной схеме, которая включает несколько последовательных этапов, позволяющих обеспечить оперативное и безопасное восстановление организма.
Исследовать вопрос подробнее – после капельницы от запоя в тюмени
Медицинская публикация представляет собой свод актуальных исследований, экспертных мнений и новейших достижений в сфере здравоохранения. Здесь вы найдете информацию о новых методах лечения, прорывных технологиях и их практическом применении. Мы стремимся сделать актуальные медицинские исследования доступными и понятными для широкой аудитории.
Ознакомиться с деталями – https://narkolog-na-dom-krasnodar16.ru
Этот медицинский обзор сосредоточен на последних достижениях, которые оказывают влияние на пациентов и медицинскую практику. Мы разбираем инновационные методы лечения и исследований, акцентируя внимание на их значимости для общественного здоровья. Читатели узнают о свежих данных и их возможном применении.
Детальнее – нарколог на дом недорого
Эта процедура доступна как в условиях клиники, так и на дому, что делает ее универсальным решением для различных жизненных ситуаций. При этом важно доверять свое здоровье только профессиональным врачам, которые могут обеспечить безопасное и качественное лечение.
Подробнее можно узнать тут – капельница от запоя наркология в красноярске
Эта публикация содержит ценные советы и рекомендации по избавлению от зависимости. Мы обсуждаем различные стратегии, которые могут помочь в процессе выздоровления и важность обращения за помощью. Читатели смогут использовать полученные знания для улучшения своего состояния.
Подробнее тут – вызов нарколога на дом
Когда запой угрожает здоровью, каждая минута имеет решающее значение. В Ярославле квалифицированные специалисты по наркологии оказывают помощь на дому, позволяя оперативно начать лечение алкогольной интоксикации и вывести токсины из организма. Такой формат терапии обеспечивает комфортные условия для пациента, максимальную конфиденциальность и индивидуальный подход, что особенно важно для быстрого и безопасного восстановления здоровья.
Выяснить больше – вывод из запоя
Специалист уточняет длительность запоя, характер употребляемого алкоголя и наличие сопутствующих заболеваний. Точный сбор данных позволяет оперативно корректировать лечение и выбрать оптимальные методы детоксикации.
Получить дополнительные сведения – https://narco-vivod-clean.ru/narkolog-na-dom-czena-spb
Комплексный вывод из запоя в Туле организован по отлаженной схеме, состоящей из нескольких этапов, каждый из которых направлен на безопасное и эффективное восстановление организма.
Подробнее можно узнать тут – вывод из запоя на дому круглосуточно тула
Процесс вывода из запоя капельничным методом организован по строгой схеме, позволяющей обеспечить максимальную эффективность терапии. Каждая стадия направлена на комплексное восстановление организма и минимизацию риска осложнений.
Выяснить больше – капельницу от запоя тюмень
В этой статье рассматриваются различные аспекты избавления от зависимости, включая физические и психологические методы. Мы обсудим поддержку, мотивацию и стратегии, которые помогут в процессе выздоровления. Читатели узнают, как преодолеть трудности и двигаться к новой жизни без зависимости.
Углубиться в тему – https://narkolog-na-dom-krasnodar12.ru/
После первичной диагностики начинается активная фаза медикаментозного вмешательства. Современные препараты вводятся капельничным методом, что позволяет оперативно снизить уровень токсинов в крови, восстановить нормальный обмен веществ и нормализовать работу внутренних органов, таких как печень, почки и сердце. Этот этап критически важен для стабилизации состояния пациента и предотвращения дальнейших осложнений.
Углубиться в тему – https://vyvod-iz-zapoya-tula00.ru/vyvod-iz-zapoya-anonimno-tula/
Запой не проходит самостоятельно, и если он длится несколько дней, организм начинает страдать от накопления токсинов. В этом случае необходимо немедленно обратиться за помощью к профессионалам, чтобы предотвратить развитие опасных осложнений.
Подробнее – https://наркология-помощь.рф/
Наркологический центр “Чистое Завтра” специализируется на лечении и реабилитации пациентов с различными формами зависимостей. Наша деятельность базируется на принципах доказательной медицины, биопсихосоциальной модели аддикции, индивидуальном подходе к каждому пациенту. Мы используем современные протоколы лечения, эффективность которых подтверждена многочисленными клиническими исследованиями.
Выяснить больше – https://алко-консультация.рф/vivod-iz-zapoya-na-domu-v-Moskve
Этот информативный текст сочетает в себе темы здоровья и зависимости. Мы обсудим, как хронические заболевания могут усугубить зависимости и наоборот, как зависимость может влиять на общее состояние здоровья. Читатели получат представление о комплексном подходе к лечению как физического, так и психического состояния.
Ознакомиться с деталями – нарколог на дом
В этой публикации мы рассматриваем важную тему борьбы с зависимостями, включая алкогольную и наркотическую зависимости. Мы обсудим методы лечения, реабилитации и поддержку, которые могут помочь людям, столкнувшимся с этой проблемой. Читатели узнают о перспективах выздоровления и важности комплексного подхода.
Подробнее можно узнать тут – вызов врача нарколога на дом
Этот текст сочетает в себе элементы познавательного рассказа и аналитической подачи информации. Читатель получает доступ к уникальным данным, которые соединяют прошлое с настоящим и открывают двери в будущее.
Подробная информация доступна по запросу – https://tereamint.com/t_5_front
Публикация предлагает уникальную подборку информации, которая будет интересна как специалистам, так и широкому кругу читателей. Здесь вы найдете ответы на часто задаваемые вопросы и полезные инсайты для дальнейшего применения.
Узнать напрямую – https://www.radhe-radhe.net/mauka-na-chode
Эта статья для ознакомления предлагает читателям общее представление об актуальной теме. Мы стремимся представить ключевые факты и идеи, которые помогут читателям получить представление о предмете и решить, стоит ли углубляться в изучение.
Изучить аспект более тщательно – https://candyriotband.com/delectably-upbeat-and-furiously-fun-piece-of-80s-inspired-synth-pop-music
В этой статье представлен занимательный и актуальный контент, который заставит вас задуматься. Мы обсуждаем насущные вопросы и проблемы, а также освещаем истории, которые вдохновляют на действия и изменения. Узнайте, что стоит за событиями нашего времени!
Подробная информация доступна по запросу – https://kansara.org/happy-birthday-k
Эта публикация дает возможность задействовать различные источники информации и представить их в удобной форме. Читатели смогут быстро найти нужные данные и получить ответы на интересующие их вопросы. Мы стремимся к четкости и доступности материала для всех!
Смотрите также – https://topic.lk/8762
Эта публикация завернет вас в вихрь увлекательного контента, сбрасывая стереотипы и открывая двери к новым идеям. Каждый абзац станет для вас открытием, полным ярких примеров и впечатляющих достижений. Подготовьтесь быть вовлеченными и удивленными каждый раз, когда продолжите читать.
Обратитесь за информацией – https://www.euphoriafilmfest.org/euphoria_the_irish_pub_03
В этой статье собраны факты, которые освещают целый ряд важных вопросов. Мы стремимся предложить читателям четкую, достоверную информацию, которая поможет сформировать собственное мнение и лучше понять сложные аспекты рассматриваемой темы.
Подробнее тут – https://banskonews.com/atanas-ianchovichin-e-buditel-na-godinata-v-bansko
В этой публикации мы предлагаем подробные объяснения по актуальным вопросам, чтобы помочь читателям глубже понять их. Четкость и структурированность материала сделают его удобным для усвоения и применения в повседневной жизни.
Узнать напрямую – https://new.arestipower.gr/sun-power-vl-opzs-series-280-4700-ah
В этой информационной статье вы найдете интересное содержание, которое поможет вам расширить свои знания. Мы предлагаем увлекательный подход и уникальные взгляды на обсуждаемые темы, побуждая пользователей к активному мышлению и критическому анализу.
Ознакомиться с деталями – https://bluegoldiptvbayiliksatinal.com/rusya-iptv-bayilik-firsatlari-yatirim-yapmadan-once-bilmeniz-gerekenler
Эта статья для ознакомления предлагает читателям общее представление об актуальной теме. Мы стремимся представить ключевые факты и идеи, которые помогут читателям получить представление о предмете и решить, стоит ли углубляться в изучение.
Ознакомьтесь с аналитикой – https://www.solni.pl/2024/05/16/witaj-swiecie
Мы собрали для вас самые захватывающие факты из мира науки и истории. От малознакомых деталей до грандиозных событий — эта статья расширит ваш кругозор и подарит новое понимание того, как устроен наш мир.
Секреты успеха внутри – https://dispara.com.br/index.php/2023/04/09/revolutionize-your-business-with-our-cutting-edge
Этот увлекательный информационный материал подарит вам массу новых знаний и ярких эмоций. Мы собрали для вас интересные факты и сведения, которые обогатят ваш опыт. Откройте для себя увлекательный мир информации и насладитесь процессом изучения!
Лучшее решение — прямо здесь – https://topic.lk/5261
Этот текст сочетает в себе элементы познавательного рассказа и аналитической подачи информации. Читатель получает доступ к уникальным данным, которые соединяют прошлое с настоящим и открывают двери в будущее.
Выяснить больше – http://cbs.torzhok.tverlib.ru/node/2942
Этот интересный отчет представляет собой сборник полезных фактов, касающихся актуальных тем. Мы проанализируем данные, чтобы вы могли сделать обоснованные выводы. Читайте, чтобы узнать больше о последних трендах и значимых событиях!
Погрузиться в детали – https://banskonews.com/atanas-ianchovichin-e-buditel-na-godinata-v-bansko
В этой статье вы найдете познавательную и занимательную информацию, которая поможет вам лучше понять мир вокруг. Мы собрали интересные данные, которые вдохновляют на размышления и побуждают к действиям. Открывайте новую информацию и получайте удовольствие от чтения!
Смотрите также – https://kontaktural.ru
Алкогольная зависимость остается одной из самых серьезных проблем современного общества. Когда человек сталкивается с последствиями длительного употребления спиртных напитков, важно вовремя принять меры, чтобы минимизировать вред для организма. В таких случаях капельница от запоя становится эффективным инструментом для снятия интоксикации и восстановления здоровья.
Подробнее тут – [url=https://kapelnica-ot-zapoya-krasnoyarsk55.ru/]postavit-kapelniczu-ot-zapoya krasnojarsk[/url]
Этот информативный текст отличается привлекательным содержанием и актуальными данными. Мы предлагаем читателям взглянуть на привычные вещи под новым углом, предоставляя интересный и доступный материал. Получите удовольствие от чтения и расширьте кругозор!
Расширить кругозор по теме – http://www.dossie.ru
Эта статья для ознакомления предлагает читателям общее представление об актуальной теме. Мы стремимся представить ключевые факты и идеи, которые помогут читателям получить представление о предмете и решить, стоит ли углубляться в изучение.
Что ещё? Расскажи всё! – https://kllogistic.ru
Врач-нарколог проводит комплексное обследование пациента, оценивая степень зависимости и общее состояние организма. В ходе первичного осмотра специалист не только определяет тяжесть алкогольной зависимости, но и выявляет сопутствующие патологии, которые могут повлиять на процесс лечения. Обследование включает лабораторные анализы, электрокардиограмму и другие необходимые диагностические процедуры. Врач тщательно изучает анамнез для выявления возможных противопоказаний к определенным методам терапии. Особое внимание уделяется психологическим аспектам, которые могли способствовать формированию зависимости, что помогает разработать эффективную программу лечения.
Получить больше информации – https://vyvod-iz-zapoya-krasnoyarsk55.ru/vyvod-iz-zapoya-v-krasnoyarske-staczionare
Если пациенту требуется постоянный мониторинг или комплексное лечение, мы обеспечиваем круглосуточное пребывание в стационаре. Здесь доступны углублённая диагностика — УЗИ органов брюшной полости, расширенные анализы крови, кардиомониторинг — и коррекция терапии в режиме реального времени. Комфортные палаты, ежедневное наблюдение медсестры и консультации психотерапевта создают условия для быстрого и безопасного выхода из зависимости.
Углубиться в тему – http://narkologicheskaya-pomoshh-ekaterinburg0.ru/
Клиника «НаркоМед» в Екатеринбурге предоставляет полный спектр наркологической помощи круглосуточно и анонимно. Благодаря мобильным бригадам и выездам на дом, пациенты получают профессиональное лечение прямо в комфортной обстановке, без стресса, связанного с госпитализацией. В статье подробно рассматриваются услуги клиники, этапы терапии и ключевые преимущества обращения в «НаркоМед».
Получить дополнительную информацию – https://narkologicheskaya-klinika-ekaterinburg0.ru/narkologicheskaya-klinika-otzyvy-v-ekb
После первичного осмотра начинается активная фаза детоксикации. Современные препараты вводятся капельничным методом для быстрого снижения уровня токсинов в крови и восстановления обменных процессов. Этот этап критически важен для нормализации работы печени, почек и сердечно-сосудистой системы.
Выяснить больше – https://vyvod-iz-zapoya-vladimir000.ru/vyvod-iz-zapoya-na-domu-vladimir/
Этот формат позволяет пациентам получить профессиональную помощь в комфортной домашней обстановке. Такой подход не только обеспечивает удобство, но и гарантирует конфиденциальность, что особенно важно для многих людей.
Подробнее можно узнать тут – http://narcolog-na-dom-v-krasnoyarske55.ru/narkolog-na-dom-krasnoyarsk-tseny/
Клиника «УралМед» работает без выходных и праздников: прием пациентов — круглосуточно. Это позволяет оказывать экстренную помощь при острых состояниях, а также вести наблюдение за динамикой восстановления здоровья в ночные часы.
Изучить вопрос глубже – http://lechenie-alkogolizma-ekaterinburg0.ru
Как правило, для эффективного устранения токсинов из организма и восстановления нормального функционирования всех органов и систем, назначаются специальные препараты. К таким препаратам относятся растворы для восстановления водно-солевого баланса, витамины и медикаменты для поддержания нормальной работы печени, а также препараты, стабилизирующие психоэмоциональное состояние пациента.
Подробнее можно узнать тут – https://narcolog-na-dom-ektb55.ru
Одним из наиболее привлекательных вариантов лечения является проведение капельницы от запоя на дому. Это решение избавляет пациента от необходимости посещать клинику, что важно для тех, кто не хочет привлекать лишнего внимания или испытывает трудности с передвижением. Кроме того, лечение на дому дает возможность получить помощь в комфортной обстановке, что снижает стресс и ускоряет восстановление.
Выяснить больше – капельница от запоя выезд
Специалист осуществляет первоначальный осмотр, измеряет ключевые показатели: артериальное давление, пульс, сатурацию кислорода в крови, выявляет степень интоксикации и тяжесть симптомов.
Детальнее – https://narcolog-na-dom-voronezh00.ru/narkolog-na-dom-anonimno-voronezh
При сильной интоксикации требуется полное очищение организма от токсинов. Детоксикация помогает нормализовать работу внутренних органов, улучшить общее состояние пациента и восстановить баланс жидкостей в организме. Специалист использует современные препараты, включая электролиты, глюкозу и антиоксиданты, для безопасного и эффективного очищения организма.
Подробнее можно узнать тут – нарколог на дом клиника красноярск
Комплексное лечение на дому организовано по строго отлаженной схеме, позволяющей оперативно стабилизировать состояние пациента и провести качественную детоксикацию.
Подробнее можно узнать тут – https://vyvod-iz-zapoya-vladimir00.ru/vyvod-iz-zapoya-na-domu-vladimir/
Клиника «НаркологикПлюс» предоставляет квалифицированную помощь нарколога на дому в Воронеже. Если вы или ваши близкие столкнулись с последствиями длительного употребления алкоголя или наркотиков, наши специалисты готовы оперативно выехать и оказать экстренную помощь. Мы проводим детоксикацию организма, снимаем симптомы абстинентного синдрома и стабилизируем состояние пациента, обеспечивая высокий уровень безопасности, строгую анонимность и индивидуальный подход.
Получить дополнительные сведения – https://narcolog-na-dom-voronezh0.ru/zapoj-narkolog-na-dom-voronezh/
Этап лечения
Ознакомиться с деталями – вывод из запоя круглосуточно в новокузнецке
Запой — это острое состояние, при котором контроль над потреблением алкоголя утрачивается, что может привести к опасным последствиям для здоровья. В Иркутске специалисты наркологической помощи предлагают услугу вызова нарколога на дом, что позволяет оперативно начать лечение в комфортной домашней обстановке, сохраняя полную конфиденциальность. Такой подход позволяет быстро стабилизировать состояние пациента и минимизировать риск осложнений.
Получить дополнительные сведения – http://narcolog-na-dom-v-irkutske66.ru
Чтобы избежать последствий и обеспечить безопасное восстановление организма, важно своевременно обратиться за профессиональной медицинской помощью. В клинике «Стоп-синдром» работает круглосуточная служба выезда нарколога на дом, что позволяет получить срочное лечение в комфортных условиях без госпитализации.
Ознакомиться с деталями – нарколог на дом срочно
Капельница от запоя представляет собой инъекционную терапию, которая помогает очистить организм от токсинов, вызванных чрезмерным употреблением алкоголя. Состав капельницы включает специальные растворы, которые способствуют восстановлению водно-солевого баланса, а также витамины и препараты для нормализации функций печени и нервной системы. Это помогает пациенту избавиться от головной боли, слабости, тошноты и других симптомов похмелья, ускоряя процесс восстановления.
Ознакомиться с деталями – http://kapelnica-ot-zapoya-ektb55.ru/kapelnicza-na-domu-ekaterinburg-ot-zapoya/
Эта процедура доступна как в условиях клиники, так и на дому, что делает ее универсальным решением для различных жизненных ситуаций. При этом важно доверять свое здоровье только профессиональным врачам, которые могут обеспечить безопасное и качественное лечение.
Исследовать вопрос подробнее – kapelnica-ot-zapoya-krasnoyarsk55.ru/
Есть ситуации, когда дальнейшее промедление может привести к необратимым последствиям:
Углубиться в тему – медицинское лечение алкоголизма
Процесс вывода из запоя состоит из нескольких последовательных и взаимосвязанных этапов, каждый из которых играет свою ключевую и незаменимую роль в обеспечении стабильного положительного результата и гарантированной безопасности пациента на протяжении всего периода лечения и восстановления
Ознакомиться с деталями – вывод из запоя цены архангельск
В подобных случаях вывод из запоя в домашних условиях без врачебного контроля крайне опасен и может привести к тяжёлым последствиям. Лучше сразу вызвать нарколога или привезти пациента в клинику — это поможет избежать критических осложнений.
Изучить вопрос глубже – вывод из длительного запоя
Своевременное обращение за профессиональной медицинской помощью помогает эффективно предотвратить дальнейшее ухудшение состояния, развитие серьезных хронических осложнений, таких как поражение печени, сердца, почек и головного мозга, а также минимизировать негативное воздействие алкоголя на психику и эмоциональное состояние пациента, предотвращая развитие депрессии, тревожности и других психических расстройств, связанных с алкогольной зависимостью
Получить больше информации – http://narcolog-na-dom-v-irkutske66.ru/
Если пациенту требуется постоянный мониторинг или комплексное лечение, мы обеспечиваем круглосуточное пребывание в стационаре. Здесь доступны углублённая диагностика — УЗИ органов брюшной полости, расширенные анализы крови, кардиомониторинг — и коррекция терапии в режиме реального времени. Комфортные палаты, ежедневное наблюдение медсестры и консультации психотерапевта создают условия для быстрого и безопасного выхода из зависимости.
Получить дополнительные сведения – неотложная наркологическая помощь
Выездной формат позволяет избежать контактов с другими пациентами в клинике и очистить организм в привычной обстановке. Специалисты самостоятельно привозят весь необходимый набор медикаментов и расходных материалов.
Разобраться лучше – https://narkologicheskaya-klinika-ekaterinburg0.ru/narkologicheskaya-klinika-otzyvy-v-ekb
Алкогольная зависимость остается одной из самых серьезных проблем современного общества. Когда человек сталкивается с последствиями длительного употребления спиртных напитков, важно вовремя принять меры, чтобы минимизировать вред для организма. В таких случаях капельница от запоя становится эффективным инструментом для снятия интоксикации и восстановления здоровья.
Выяснить больше – капельница от запоя клиника
Клиника «УралМед» работает без выходных и праздников: прием пациентов — круглосуточно. Это позволяет оказывать экстренную помощь при острых состояниях, а также вести наблюдение за динамикой восстановления здоровья в ночные часы.
Исследовать вопрос подробнее – https://lechenie-alkogolizma-ekaterinburg0.ru/
Процедура капельницы — это целый комплекс мероприятий, направленных на очистку организма и восстановление его нормальной работы. Для этого в капельницу добавляют раствор для регидратации, витамины, антиоксиданты, препараты для поддержания печени и успокоительные средства. Все компоненты способствуют быстрому очищению от токсинов, восстановлению психоэмоционального фона и нормализации обменных процессов.
Изучить вопрос глубже – http://kapelnica-ot-zapoya-ekb55.ru
Если узнаёте подобные признаки у себя или у родственника — не ждите кризиса. Чем быстрее обратиться за профессиональной поддержкой, тем легче вернуть здоровье и гармонию в семью.
Детальнее – https://lechenie-alkogolizma-korolev5.ru
Наркологическая клиника «АнтиДот» предлагает срочный вызов нарколога на дом в Воронеже и Воронежской области. Наша служба экстренной наркологической помощи доступна круглосуточно и позволяет быстро справиться с тяжелыми состояниями, вызванными алкогольной и наркотической зависимостью. Опытные врачи проведут детоксикацию организма, помогут снять абстинентный синдром и стабилизировать общее состояние пациента в комфортных домашних условиях.
Получить дополнительные сведения – нарколог на дом вывод из запоя
Чем раньше начато лечение, тем выше вероятность полного восстановления здоровья без тяжёлых последствий для организма и психики. В клинике «Наркосфера» к каждому случаю подходят максимально внимательно и индивидуально.
Узнать больше – narkologicheskaya-klinika-stacionar
Как правило, для эффективного устранения токсинов из организма и восстановления нормального функционирования всех органов и систем, назначаются специальные препараты. К таким препаратам относятся растворы для восстановления водно-солевого баланса, витамины и медикаменты для поддержания нормальной работы печени, а также препараты, стабилизирующие психоэмоциональное состояние пациента.
Углубиться в тему – https://narcolog-na-dom-ektb55.ru
Незамедлительно после вызова нарколог прибывает на дом для проведения тщательного осмотра. На данном этапе специалист собирает анамнез, измеряет жизненно важные показатели — пульс, артериальное давление, температуру — и оценивает степень интоксикации. Эти данные являются основой для составления индивидуального плана лечения.
Углубиться в тему – вывод из запоя недорого владимир
Благодаря применению комплексного подхода, включающего медикаментозную детоксикацию, коррекцию нарушенных обменных процессов и симптоматическую терапию, а также использованию передовых медицинских технологий, лечение проходит быстро и эффективно, что существенно снижает вероятность рецидивов и гарантирует долгосрочный результат
Ознакомиться с деталями – вывод из запоя в новокузнецке
Комплексное лечение на дому организовано по строго отлаженной схеме, позволяющей оперативно стабилизировать состояние пациента и провести качественную детоксикацию.
Выяснить больше – вывод из запоя недорого владимир
Клиника «НаркологикПлюс» предоставляет квалифицированную помощь нарколога на дому в Воронеже. Если вы или ваши близкие столкнулись с последствиями длительного употребления алкоголя или наркотиков, наши специалисты готовы оперативно выехать и оказать экстренную помощь. Мы проводим детоксикацию организма, снимаем симптомы абстинентного синдрома и стабилизируем состояние пациента, обеспечивая высокий уровень безопасности, строгую анонимность и индивидуальный подход.
Разобраться лучше – https://narcolog-na-dom-voronezh0.ru/vyzov-narkologa-na-dom-voronezh/
Такой грамотный и научно обоснованный подход позволяет максимально быстро нейтрализовать токсическую нагрузку, восстановить жизненно важные функции организма, стабилизировать состояние пациента и предотвратить развитие серьезных осложнений, обеспечивая наилучшие возможные результаты лечения в условиях экстренной ситуации
Ознакомиться с деталями – нарколог вывод из запоя архангельск
На первом этапе проводится осмотр: врач измеряет давление, пульс, уровень кислорода, температуру тела, оценивает общее состояние, собирает анамнез и анализирует возможные сопутствующие заболевания. При необходимости пациент проходит экспресс-диагностику, включая лабораторные анализы, ЭКГ и консультации других специалистов (кардиолога, невролога).
Ознакомиться с деталями – вывод из запоя цена
В некоторых случаях медлить нельзя ни минуты. Запойное состояние чревато обезвоживанием, судорогами, инфарктом, психозом. Если у пациента наблюдаются выраженные физические и психические нарушения, самостоятельное «пережидание» может закончиться тяжёлыми осложнениями.Поводом немедленно обратиться к специалистам становится:
Детальнее – vyvod-iz-zapoya
Запой – это острое и крайне опасное состояние, характеризующееся полной и неконтролируемой утратой способности регулировать потребление алкоголя, что с высокой вероятностью может привести к серьезным и даже потенциально смертельным последствиям для здоровья, поражая практически все жизненно важные органы и системы организма, от нервной и сердечно-сосудистой до пищеварительной и эндокринной
Изучить вопрос глубже – https://narcolog-na-dom-v-irkutske66.ru
Резкий отказ от алкоголя без врачебной помощи может спровоцировать абстинентный синдром, который сопровождается судорогами, галлюцинациями, аритмией и критическими скачками артериального давления. В тяжёлых случаях состояние может осложниться алкогольным делирием (белая горячка), приступами паники, депрессией и острыми сердечно-сосудистыми расстройствами.
Подробнее можно узнать тут – нарколог вывод из запоя в новокузнецке
Профессиональная психологическая помощь является фундаментальным элементом в понимании пациентом корней зависимости и инициации процесса восстановления. Квалифицированные психологи проводят персональные и групповые занятия, обучая пациентов эффективному управлению эмоциями и преодолению стрессовых ситуаций без алкоголя. В процессе терапии используются методики когнитивно-поведенческой терапии для изменения деструктивных паттернов мышления. Развитие навыков самоконтроля и укрепление самооценки становятся ключевыми факторами в формировании стойкой мотивации к трезвому образу жизни.
Получить дополнительную информацию – https://vyvod-iz-zapoya-krasnoyarsk55.ru/
Далее начинается процесс детоксикации – внутривенно вводятся растворы, которые помогают вывести остатки алкоголя, снизить нагрузку на печень и почки, восстановить водно-солевой баланс. При необходимости применяются препараты для стабилизации сердечно-сосудистой системы и поддержания работы нервной системы.
Детальнее – vyzov-narkologa-na-dom irkutsk
Вызов нарколога на дом и круглосуточная поддержка в условиях стационара — ключевая услуга клиники «НаркоЦентр», направленная на оказание экстренной и плановой помощи пациентам с алкогольной и наркотической зависимостью. Мы понимаем, что запой или интоксикация могут развиться внезапно, поэтому врач выезжает в любой район Екатеринбурга и ближайшего подмосковья менее чем за 30 минут. При этом круглосуточное дежурство специалистов позволяет продолжить наблюдение и поддержку в стенах клиники, если домашние условия оказываются недостаточно безопасными или комфортными.
Исследовать вопрос подробнее – narkologicheskaya-pomoshh-ekaterinburg0.ru/
Запой — это острое состояние, при котором контроль над потреблением алкоголя утрачивается, что может привести к опасным последствиям для здоровья. В Иркутске специалисты наркологической помощи предлагают услугу вызова нарколога на дом, что позволяет оперативно начать лечение в комфортной домашней обстановке, сохраняя полную конфиденциальность. Такой подход позволяет быстро стабилизировать состояние пациента и минимизировать риск осложнений.
Исследовать вопрос подробнее – выезд нарколога на дом иркутск
Основу капельницы составляют инфузионные растворы, которые помогают устранить обезвоживание. Дополнительно вводятся витамины для улучшения обменных процессов, препараты для защиты печени, а также успокоительные средства для стабилизации нервной системы. Компоненты подбираются индивидуально с учетом состояния пациента, чтобы обеспечить максимальную эффективность и безопасность.
Изучить вопрос глубже – капельница от запоя на дому цена красноярск
Неотъемлемой частью программы становится психотерапия — работа с мотивацией, психологической поддержкой, поиском и устранением “триггеров” зависимости, проработка самооценки, стрессоустойчивости. К работе обязательно подключаются близкие: совместные консультации помогают восстановить доверие, снизить уровень конфликтов, научиться поддерживать без контроля и упрёков.
Получить дополнительные сведения – центр лечения алкоголизма
Этот формат позволяет пациентам получить профессиональную помощь в комфортной домашней обстановке. Такой подход не только обеспечивает удобство, но и гарантирует конфиденциальность, что особенно важно для многих людей.
Разобраться лучше – нарколог на дом срочно в красноярске
Запой — это не просто временная слабость, а критическое состояние, требующее экстренного медицинского вмешательства. Особенно опасно откладывать обращение за помощью, если у человека наблюдаются такие симптомы:
Узнать больше – вывод из запоя круглосуточно
«НаркоМед» основана группой узкопрофильных специалистов, чей опыт насчитывает более 15 лет в лечении зависимости. Клиника работает круглосуточно — вы можете рассчитывать на оперативное реагирование в любой час дня и ночи. Анонимность пациентов сохраняется на уровне медицинской тайны: персональные данные и диагноз не разглашаются.
Получить дополнительную информацию – наркологическая клиника нарколог
Экстренная помощь при выводе из запоя в Архангельске организована по четко отлаженной и многократно проверенной на практике схеме, что позволяет оперативно реагировать на вызовы и оказывать максимально эффективную помощь пациентам в критическом состоянии
Изучить вопрос глубже – вывод из запоя в архангельске
После диагностики выявленные нарушения восполняются посредством инфузий с витаминами группы B, C, магнием и элементами.
Детальнее – http://lechenie-alkogolizma-ekaterinburg0.ru/anonimnoe-lechenie-alkogolizma-v-ekb/
Чем раньше начато лечение, тем выше вероятность полного восстановления здоровья без тяжёлых последствий для организма и психики. В клинике «Наркосфера» к каждому случаю подходят максимально внимательно и индивидуально.
Ознакомиться с деталями – narkologicheskaya-klinika-dlya-podrostkov
Особое внимание в клинике уделяется постоянному контролю за состоянием: врачи и медсёстры следят за показателями здоровья, в любой момент могут скорректировать курс терапии или подключить дополнительных специалистов. Все препараты подбираются индивидуально — с учётом возраста, стажа употребления, веса, состояния органов и особенностей сопутствующих заболеваний.
Узнать больше – вывод из запоя клиника
Если пациент находится в остром состоянии — начинается с детоксикации. Это не только капельницы для вывода токсинов и восстановления баланса в организме, но и поддержка работы сердца, печени, почек, купирование тревоги и бессонницы, снятие судорог, коррекция давления. Весь процесс проходит под наблюдением опытного нарколога, который учитывает хронические заболевания, особенности организма, степень интоксикации.
Разобраться лучше – lechenie-alkogolizma-cena
В состав капельницы обычно входят растворы для гидратации, витаминно-минеральные комплексы, гепатопротекторы для защиты печени, а также седативные препараты для стабилизации нервной системы. Такой подход позволяет быстро справиться с признаками похмелья и предотвратить развитие более серьезных осложнений.
Узнать больше – капельница от запоя на дому
Когда пациент решает обратиться за помощью к наркологу на дом, ему предстоит пройти ряд этапов лечения, каждый из которых будет направлен на устранение последствий алкоголизма. Врач проведет первичный осмотр, выслушает жалобы пациента и на основе собранной информации начнёт индивидуальную программу лечения.
Получить дополнительные сведения – вызов нарколога на дом свердловская область
После первичного осмотра начинается активная фаза детоксикации. Современные препараты вводятся капельничным методом для быстрого снижения уровня токсинов в крови и восстановления обменных процессов. Этот этап критически важен для нормализации работы печени, почек и сердечно-сосудистой системы.
Выяснить больше – https://vyvod-iz-zapoya-vladimir000.ru/srochnyj-vyvod-iz-zapoya-vladimir
Специалист осуществляет первоначальный осмотр, измеряет ключевые показатели: артериальное давление, пульс, сатурацию кислорода в крови, выявляет степень интоксикации и тяжесть симптомов.
Подробнее тут – https://narcolog-na-dom-voronezh00.ru
В таких случаях своевременное обращение за помощью позволяет быстро стабилизировать состояние и предотвратить развитие серьезных осложнений.
Подробнее можно узнать тут – http://narcolog-na-dom-voronezh0.ru/
При вызовах в ночное время или в случаях с тяжелой интоксикацией стоимость может увеличиваться до 3000–4500 рублей. Окончательная сумма определяется после первичного осмотра и обсуждения индивидуальной схемы лечения с пациентом.
Ознакомиться с деталями – вывод из запоя недорого владимир
Красноярск, как и любой крупный город, сталкивается с распространенными проблемами зависимости. Учитывая высокий уровень стресса, социальное давление и быстрое развитие мегаполиса, люди часто оказываются в сложных ситуациях, связанных с алкогольной или наркотической зависимостью. В таких случаях своевременная помощь квалифицированного нарколога становится не просто желательной, а жизненно необходимой.
Получить больше информации – выезд нарколога на дом
Одним из наиболее удобных вариантов лечения является проведение процедуры в домашних условиях. Это особенно актуально для пациентов, которые чувствуют себя слишком плохо, чтобы отправиться в клинику, или желают сохранить анонимность.
Ознакомиться с деталями – https://kapelnica-ot-zapoya-krasnoyarsk55.ru/kapelnicza-ot-zapoya-na-domu-krasnoyarsk
Если пациенту требуется постоянный мониторинг или комплексное лечение, мы обеспечиваем круглосуточное пребывание в стационаре. Здесь доступны углублённая диагностика — УЗИ органов брюшной полости, расширенные анализы крови, кардиомониторинг — и коррекция терапии в режиме реального времени. Комфортные палаты, ежедневное наблюдение медсестры и консультации психотерапевта создают условия для быстрого и безопасного выхода из зависимости.
Получить больше информации – http://narkologicheskaya-pomoshh-ekaterinburg0.ru
Если узнаёте подобные признаки у себя или у родственника — не ждите кризиса. Чем быстрее обратиться за профессиональной поддержкой, тем легче вернуть здоровье и гармонию в семью.
Ознакомиться с деталями – наркологическое лечение алкоголизма
Алкогольная зависимость требует быстрого и квалифицированного вмешательства, поскольку она может привести к тяжелым последствиям для здоровья. Капельница от запоя — один из наиболее эффективных методов, помогающих вывести организм из состояния алкогольной интоксикации и восстановить нормальное самочувствие. В Екатеринбурге эта процедура доступна как в медицинских учреждениях, так и на дому, что позволяет пациентам выбрать наиболее удобный и комфортный способ лечения.
Ознакомиться с деталями – капельница от запоя свердловская область
Экстренная помощь при выводе из запоя в Архангельске организована по четко отлаженной и многократно проверенной на практике схеме, что позволяет оперативно реагировать на вызовы и оказывать максимально эффективную помощь пациентам в критическом состоянии
Получить дополнительную информацию – наркология вывод из запоя архангельск
В некоторых случаях медлить нельзя ни минуты. Запойное состояние чревато обезвоживанием, судорогами, инфарктом, психозом. Если у пациента наблюдаются выраженные физические и психические нарушения, самостоятельное «пережидание» может закончиться тяжёлыми осложнениями.Поводом немедленно обратиться к специалистам становится:
Получить дополнительные сведения – срочный вывод из запоя ногинск
После обращения в клинику пациент получает первую подробную консультацию — это может быть очный визит, звонок или заявка через сайт. При необходимости организуется экстренное поступление или выезд нарколога на дом: врач приезжает с полным набором оборудования и медикаментов для оказания неотложной помощи. На первом этапе проводится диагностика: анализы крови, ЭКГ, осмотр профильных специалистов, дополнительное обследование по показаниям. Это позволяет точно определить степень зависимости, выявить осложнения и подобрать эффективную тактику лечения.
Получить больше информации – narkologicheskaya-klinika-dlya-podrostkov
Для обеспечения оперативности «НаркоМед» сформировала несколько мобильных бригад, размещённых по разным районам города. Каждая бригада оснащена портативными инфузионными насосами, современными измерительными приборами и запасом медикаментов.
Изучить вопрос глубже – наркологическая клиника свердловская область
Резкий отказ от алкоголя без врачебной помощи может спровоцировать абстинентный синдром, который сопровождается судорогами, галлюцинациями, аритмией и критическими скачками артериального давления. В тяжёлых случаях состояние может осложниться алкогольным делирием (белая горячка), приступами паники, депрессией и острыми сердечно-сосудистыми расстройствами.
Изучить вопрос глубже – вывод из запоя новокузнецк
Многодневные алкогольные запои опасны не только для здоровья, но и для жизни. В этот период организм подвергается тяжелейшей интоксикации, страдают сердце, печень, нервная система, а психоэмоциональное состояние может выйти из-под контроля. Самостоятельно выйти из запоя очень трудно и опасно: любое промедление или попытка “перетерпеть” чреваты судорогами, галлюцинациями, инфарктом, тяжелой депрессией или делирием. Именно поэтому своевременное обращение к профессионалам — залог не только скорого, но и безопасного восстановления. В наркологической клинике «НаркоМедцентр» в Балашихе организован современный и медицински обоснованный вывод из запоя: здесь пациентов ждет индивидуальный подход, круглосуточное медицинское наблюдение и полная конфиденциальность.
Углубиться в тему – vyvod-iz-zapoya-balashiha
После диагностики выявленные нарушения восполняются посредством инфузий с витаминами группы B, C, магнием и элементами.
Узнать больше – https://lechenie-alkogolizma-ekaterinburg0.ru
Чтобы избежать последствий и обеспечить безопасное восстановление организма, важно своевременно обратиться за профессиональной медицинской помощью. В клинике «Стоп-синдром» работает круглосуточная служба выезда нарколога на дом, что позволяет получить срочное лечение в комфортных условиях без госпитализации.
Получить дополнительную информацию – вызов нарколога на дом иркутск
Капельница от запоя представляет собой внутривенное введение специального раствора, который помогает организму справиться с последствиями алкогольной интоксикации. Этот метод используется для того, чтобы уменьшить проявления похмелья, таких как головная боль, тошнота, бессонница и раздражительность. Кроме того, капельница способствует нормализации работы внутренних органов и систем, ускоряя восстановление после длительного алкоголизма.
Исследовать вопрос подробнее – после капельницы от запоя екатеринбург
Основу капельницы составляют инфузионные растворы, которые помогают устранить обезвоживание. Дополнительно вводятся витамины для улучшения обменных процессов, препараты для защиты печени, а также успокоительные средства для стабилизации нервной системы. Компоненты подбираются индивидуально с учетом состояния пациента, чтобы обеспечить максимальную эффективность и безопасность.
Подробнее можно узнать тут – http://kapelnica-ot-zapoya-krasnoyarsk55.ru/kapelnicza-ot-zapoya-v-stacionare-krasnoyarsk/https://kapelnica-ot-zapoya-krasnoyarsk55.ru
Вызов специалиста на дом рекомендуется, если запой затягивается и самостоятельное прекращение пьянства становится невозможным. Своевременное обращение помогает предотвратить ухудшение состояния, развитие хронических осложнений и негативное воздействие на психику.
Получить дополнительные сведения – нарколог на дом цена
Когда пациент решает обратиться за помощью к наркологу на дом, ему предстоит пройти ряд этапов лечения, каждый из которых будет направлен на устранение последствий алкоголизма. Врач проведет первичный осмотр, выслушает жалобы пациента и на основе собранной информации начнёт индивидуальную программу лечения.
Подробнее тут – нарколог на дом свердловская область
В клинике каждому пациенту уделяют особое внимание. Врачи знают: универсальных решений нет, за каждым случаем — своя история и свои причины. Первый контакт начинается с конфиденциальной консультации. Можно просто позвонить или написать онлайн — уже на этом этапе врач поможет оценить ситуацию, объяснит возможные этапы и даст рекомендации по подготовке к визиту.
Подробнее тут – centr-lecheniya-alkogolizma
После первичного осмотра начинается активная фаза детоксикации. Современные препараты вводятся капельничным методом для быстрого снижения уровня токсинов в крови и восстановления обменных процессов. Этот этап критически важен для нормализации работы печени, почек и сердечно-сосудистой системы.
Подробнее – наркология вывод из запоя владимир
Такой грамотный и современный подход позволяет максимально быстро стабилизировать критическое состояние пациента, минимизировать риск развития опасных осложнений, предотвратить дальнейшее ухудшение здоровья и создать благоприятные условия для эффективного и комфортного выздоровления в домашней обстановке, снижая стресс и тревожность, связанные с госпитализацией
Узнать больше – нарколог в иркутске
Алкогольная и наркотическая зависимости могут привести к тяжелым и опасным для жизни состояниям. Вызов нарколога становится необходимым, если:
Подробнее тут – вызов нарколога на дом воронежская область
Экстренная медицинская помощь при зависимостях становится необходимостью в ситуациях, когда пациент не может самостоятельно прервать запой или прекратить употребление наркотических веществ. Обратиться к наркологу на дом срочно рекомендуется при возникновении следующих признаков:
Выяснить больше – вызов нарколога на дом воронеж
Если пациенту требуется постоянный мониторинг или комплексное лечение, мы обеспечиваем круглосуточное пребывание в стационаре. Здесь доступны углублённая диагностика — УЗИ органов брюшной полости, расширенные анализы крови, кардиомониторинг — и коррекция терапии в режиме реального времени. Комфортные палаты, ежедневное наблюдение медсестры и консультации психотерапевта создают условия для быстрого и безопасного выхода из зависимости.
Детальнее – вызвать наркологическую помощь
Врач назначает комплекс препаратов для нормализации состояния и устранения интоксикации. Применяются детоксикационные средства для очищения организма и облегчения абстинентного синдрома. Важным компонентом терапии являются витаминные комплексы и минералы, восстанавливающие метаболический баланс. При необходимости назначаются седативные препараты для снижения тревожности и нормализации сна. Также используются гепатопротекторы и другие средства для поддержки органов, пострадавших от алкогольной интоксикации.
Подробнее можно узнать тут – вывод из запоя цена красноярск.
В обычных условиях цена услуги составляет от 1500 до 2500 рублей. Эта сумма включает выезд специалиста, первичный осмотр и базовую детоксикационную терапию.
Получить дополнительные сведения – вывод из запоя владимирская область
Чем дольше и интенсивнее продолжается запой, тем выше становится риск возникновения широкого спектра серьезных и потенциально смертельных осложнений, начиная от тяжелых нарушений работы сердечно-сосудистой системы и заканчивая необратимым повреждением жизненно важных внутренних органов, что требует немедленной и комплексной медицинской помощи
Подробнее можно узнать тут – вывод из запоя цена архангельск
Запой — это не просто временная слабость, а критическое состояние, требующее экстренного медицинского вмешательства. Особенно опасно откладывать обращение за помощью, если у человека наблюдаются такие симптомы:
Узнать больше – vyvod-iz-zapoya-na-domu-nedorogo
После обращения в клинику пациент получает первую подробную консультацию — это может быть очный визит, звонок или заявка через сайт. При необходимости организуется экстренное поступление или выезд нарколога на дом: врач приезжает с полным набором оборудования и медикаментов для оказания неотложной помощи. На первом этапе проводится диагностика: анализы крови, ЭКГ, осмотр профильных специалистов, дополнительное обследование по показаниям. Это позволяет точно определить степень зависимости, выявить осложнения и подобрать эффективную тактику лечения.
Получить дополнительные сведения – narkologicheskaya-klinika-v-balashihe
Если пациент находится в остром состоянии — начинается с детоксикации. Это не только капельницы для вывода токсинов и восстановления баланса в организме, но и поддержка работы сердца, печени, почек, купирование тревоги и бессонницы, снятие судорог, коррекция давления. Весь процесс проходит под наблюдением опытного нарколога, который учитывает хронические заболевания, особенности организма, степень интоксикации.
Ознакомиться с деталями – lechenie-alkogolizma-anonimno
В подобных случаях вывод из запоя в домашних условиях без врачебного контроля крайне опасен и может привести к тяжёлым последствиям. Лучше сразу вызвать нарколога или привезти пациента в клинику — это поможет избежать критических осложнений.
Ознакомиться с деталями – круглосуточный вывод из запоя балашиха
«НаркоМед» основана группой узкопрофильных специалистов, чей опыт насчитывает более 15 лет в лечении зависимости. Клиника работает круглосуточно — вы можете рассчитывать на оперативное реагирование в любой час дня и ночи. Анонимность пациентов сохраняется на уровне медицинской тайны: персональные данные и диагноз не разглашаются.
Изучить вопрос глубже – https://narkologicheskaya-klinika-ekaterinburg0.ru/narkologicheskaya-klinika-otzyvy-v-ekb
Одним из наиболее удобных вариантов лечения является проведение процедуры в домашних условиях. Это особенно актуально для пациентов, которые чувствуют себя слишком плохо, чтобы отправиться в клинику, или желают сохранить анонимность.
Подробнее – капельница от запоя выезд
Алкоголизм — это не просто вредная привычка или “слабость характера”. Это тяжёлое хроническое заболевание, способное разрушить здоровье, психику, семью, карьеру. На первых порах зависимость подкрадывается незаметно: человек пьёт “по случаю”, для снятия усталости, ради компании. Но постепенно спиртное становится единственным способом отвлечься, расслабиться, уйти от тревог и проблем. Со временем самоконтроль ослабевает, периоды трезвости укорачиваются, а любые попытки “перестать пить” заканчиваются тяжёлым абстинентным синдромом, бессонницей, раздражительностью, головными болями и срывами. В такой ситуации никакие уговоры и угрозы не работают. Необходима профессиональная, комплексная медицинская помощь — именно такую поддержку с максимальной анонимностью и уважением к пациенту предлагает наркологическая клиника «Новая Точка» в Королёве.
Получить дополнительные сведения – лечение алкоголизма
Этот формат позволяет пациентам получить профессиональную помощь в комфортной домашней обстановке. Такой подход не только обеспечивает удобство, но и гарантирует конфиденциальность, что особенно важно для многих людей.
Детальнее – вызвать нарколога на дом в красноярске
После диагностики выявленные нарушения восполняются посредством инфузий с витаминами группы B, C, магнием и элементами.
Подробнее тут – http://lechenie-alkogolizma-ekaterinburg0.ru/
Запой – это состояние полной утраты контроля над потреблением алкоголя, представляющее серьезную опасность для здоровья и даже жизни, поскольку в результате длительной алкогольной интоксикации возникают критические нарушения работы внутренних органов
Получить дополнительную информацию – вывод из запоя цены новокузнецк
Такая услуга доступна круглосуточно, что позволяет вызвать врача в любое время. Профессиональные специалисты, приехав на дом, тщательно подберут состав капельницы с учетом индивидуальных особенностей пациента, чтобы обеспечить максимально эффективное лечение. Анонимность и высокая квалификация медперсонала делают этот способ особенно удобным для людей, которые предпочитают конфиденциальность.
Разобраться лучше – kapelnicza-ot-zapoya-czena ekaterinburg
В Архангельске, в условиях, когда каждая минута на счету, экстренная медицинская помощь становится особенно актуальной, и специализированные службы, укомплектованные опытными и квалифицированными специалистами, готовы оперативно вмешаться для стабилизации критического состояния пациента и предотвращения непоправимых последствий для его здоровья
Углубиться в тему – вывод из запоя на дому архангельск недорого
Первичный этап заключается в оценке состояния пациента и быстром подборе схемы инфузионной терапии. Врач фиксирует показания ЭКГ, сатурацию кислорода и биохимический параметр глюкозы в крови. После этого подключается капельница с раствором для выведения продуктов распада алкоголя и одновременной коррекции показателей обмена веществ. Последующие визиты врача позволяют скорректировать терапию и предотвратить развитие побочных реакций.
Исследовать вопрос подробнее – http://narkologicheskaya-pomoshh-ekaterinburg0.ru/neotlozhnaya-narkologicheskaya-pomoshh-v-ekb/
В некоторых случаях медлить нельзя ни минуты. Запойное состояние чревато обезвоживанием, судорогами, инфарктом, психозом. Если у пациента наблюдаются выраженные физические и психические нарушения, самостоятельное «пережидание» может закончиться тяжёлыми осложнениями.Поводом немедленно обратиться к специалистам становится:
Ознакомиться с деталями – https://vyvod-iz-zapoya-noginsk5.ru/
Каждый пациент получает индивидуально разработанную схему терапии, которая включает комплексное воздействие на организм:
Получить дополнительные сведения – вывод из запоя капельница в новокузнецке
Когда запой становится критическим, оперативное вмешательство имеет решающее значение для спасения здоровья и предотвращения необратимых последствий. Во Владимире экстренная помощь нарколога на дому позволяет быстро начать лечение, не требуя госпитализации, что особенно важно для пациентов, нуждающихся в сохранении конфиденциальности и комфорте.
Детальнее – https://vyvod-iz-zapoya-vladimir000.ru/vyvod-iz-zapoya-anonimno-vladimir/
Как правило, для эффективного устранения токсинов из организма и восстановления нормального функционирования всех органов и систем, назначаются специальные препараты. К таким препаратам относятся растворы для восстановления водно-солевого баланса, витамины и медикаменты для поддержания нормальной работы печени, а также препараты, стабилизирующие психоэмоциональное состояние пациента.
Углубиться в тему – vyzvat-narkologa-na-dom ekaterinburg
Алкогольная и наркотическая зависимости могут привести к тяжелым и опасным для жизни состояниям. Вызов нарколога становится необходимым, если:
Получить больше информации – нарколог на дом круглосуточно воронеж
Кроме того, лечение на дому гарантирует полную анонимность и строжайшую конфиденциальность, что особенно важно для тех пациентов, которые по каким-либо причинам не желают разглашать информацию о своей проблеме с алкогольной зависимостью, обеспечивая индивидуальный и деликатный подход к каждому конкретному случаю, учитывая все особенности и потребности пациента
Подробнее тут – нарколог на дом недорого иркутск
После поступления звонка нарколог оперативно выезжает по указанному адресу и прибывает в течение 30–60 минут. Врач незамедлительно приступает к оказанию помощи по четко отработанному алгоритму, состоящему из следующих этапов:
Изучить вопрос глубже – https://narcolog-na-dom-voronezh00.ru/
Комплексное лечение на дому организовано по строго отлаженной схеме, позволяющей оперативно стабилизировать состояние пациента и провести качественную детоксикацию.
Получить дополнительную информацию – http://vyvod-iz-zapoya-vladimir00.ru
После поступления заявки врач выезжает в течение 30–60 минут и по прибытии проводит диагностику, оценивает состояние пациента, измеряет пульс, давление, уровень кислорода в крови.
Выяснить больше – нарколог на дом анонимно иркутск
Чем раньше начато лечение, тем выше вероятность полного восстановления здоровья без тяжёлых последствий для организма и психики. В клинике «Наркосфера» к каждому случаю подходят максимально внимательно и индивидуально.
Детальнее – https://narkologicheskaya-klinika-balashiha5.ru
Далее, когда физическое состояние стабилизировано, совместно с врачом выбирается стратегия дальнейшего лечения. В «Новая Точка» доступны современные методы кодирования (уколы, таблетки, вшивание препаратов, гипнотерапия), но решение всегда принимается осознанно, с объяснением плюсов, рисков и индивидуальным подбором метода.
Изучить вопрос глубже – нарколог лечение алкоголизма
Алкогольная зависимость остается одной из самых серьезных проблем современного общества. Когда человек сталкивается с последствиями длительного употребления спиртных напитков, важно вовремя принять меры, чтобы минимизировать вред для организма. В таких случаях капельница от запоя становится эффективным инструментом для снятия интоксикации и восстановления здоровья.
Выяснить больше – врача капельницу от запоя красноярск
Особое внимание в клинике уделяется постоянному контролю за состоянием: врачи и медсёстры следят за показателями здоровья, в любой момент могут скорректировать курс терапии или подключить дополнительных специалистов. Все препараты подбираются индивидуально — с учётом возраста, стажа употребления, веса, состояния органов и особенностей сопутствующих заболеваний.
Углубиться в тему – вывод из запоя дешево
Красноярск, как и любой крупный город, сталкивается с распространенными проблемами зависимости. Учитывая высокий уровень стресса, социальное давление и быстрое развитие мегаполиса, люди часто оказываются в сложных ситуациях, связанных с алкогольной или наркотической зависимостью. В таких случаях своевременная помощь квалифицированного нарколога становится не просто желательной, а жизненно необходимой.
Узнать больше – вызов нарколога на дом красноярск.
«НаркоМед» основана группой узкопрофильных специалистов, чей опыт насчитывает более 15 лет в лечении зависимости. Клиника работает круглосуточно — вы можете рассчитывать на оперативное реагирование в любой час дня и ночи. Анонимность пациентов сохраняется на уровне медицинской тайны: персональные данные и диагноз не разглашаются.
Получить больше информации – частная наркологическая клиника екатеринбург.
Запой — это острое состояние, при котором контроль над потреблением алкоголя утрачивается, что может привести к опасным последствиям для здоровья. В Иркутске специалисты наркологической помощи предлагают услугу вызова нарколога на дом, что позволяет оперативно начать лечение в комфортной домашней обстановке, сохраняя полную конфиденциальность. Такой подход позволяет быстро стабилизировать состояние пациента и минимизировать риск осложнений.
Подробнее – [url=https://narcolog-na-dom-v-irkutske66.ru/]вызвать нарколога на дом[/url]
В Архангельске, в условиях, когда каждая минута на счету, экстренная медицинская помощь становится особенно актуальной, и специализированные службы, укомплектованные опытными и квалифицированными специалистами, готовы оперативно вмешаться для стабилизации критического состояния пациента и предотвращения непоправимых последствий для его здоровья
Разобраться лучше – http://vyvod-iz-zapoya-arkhangelsk66.ru/vyvod-iz-zapoya-klinika-arkhangelsk
Алкоголизм — хроническое заболевание, требующее комплексного подхода и круглосуточного контроля. Клиника «УралМед» в Екатеринбурге предлагает полный спектр услуг для пациентов любого уровня зависимости: от экстренной детоксикации до долгосрочной реабилитации. Главные принципы работы — абсолютная анонимность, индивидуальный план лечения и постоянное сопровождение квалифицированной командой специалистов.
Подробнее – http://lechenie-alkogolizma-ekaterinburg0.ru
Процедура капельницы — это целый комплекс мероприятий, направленных на очистку организма и восстановление его нормальной работы. Для этого в капельницу добавляют раствор для регидратации, витамины, антиоксиданты, препараты для поддержания печени и успокоительные средства. Все компоненты способствуют быстрому очищению от токсинов, восстановлению психоэмоционального фона и нормализации обменных процессов.
Изучить вопрос глубже – http://kapelnica-ot-zapoya-ekb55.ru/kapelnicza-ot-zapoya-v-stacionare-ekaterinburg/https://kapelnica-ot-zapoya-ekb55.ru
На первом этапе проводится осмотр: врач измеряет давление, пульс, уровень кислорода, температуру тела, оценивает общее состояние, собирает анамнез и анализирует возможные сопутствующие заболевания. При необходимости пациент проходит экспресс-диагностику, включая лабораторные анализы, ЭКГ и консультации других специалистов (кардиолога, невролога).
Подробнее тут – вывод из запоя на дому недорого
Когда организм насыщен токсинами, нормальное функционирование органов нарушается. Капельница помогает быстро очистить кровь, восстановить клетки печени и улучшить общее состояние пациента, чтобы как можно быстрее вернуться к привычному уровню жизни.
Получить больше информации – капельница от запоя вызов город
Вызов нарколога на дом и круглосуточная поддержка в условиях стационара — ключевая услуга клиники «НаркоЦентр», направленная на оказание экстренной и плановой помощи пациентам с алкогольной и наркотической зависимостью. Мы понимаем, что запой или интоксикация могут развиться внезапно, поэтому врач выезжает в любой район Екатеринбурга и ближайшего подмосковья менее чем за 30 минут. При этом круглосуточное дежурство специалистов позволяет продолжить наблюдение и поддержку в стенах клиники, если домашние условия оказываются недостаточно безопасными или комфортными.
Получить больше информации – http://narkologicheskaya-pomoshh-ekaterinburg0.ru
В клинике каждому пациенту уделяют особое внимание. Врачи знают: универсальных решений нет, за каждым случаем — своя история и свои причины. Первый контакт начинается с конфиденциальной консультации. Можно просто позвонить или написать онлайн — уже на этом этапе врач поможет оценить ситуацию, объяснит возможные этапы и даст рекомендации по подготовке к визиту.
Получить больше информации – http://www.domen.ru
Алкогольная зависимость остается одной из самых серьезных проблем современного общества. Когда человек сталкивается с последствиями длительного употребления спиртных напитков, важно вовремя принять меры, чтобы минимизировать вред для организма. В таких случаях капельница от запоя становится эффективным инструментом для снятия интоксикации и восстановления здоровья.
Подробнее тут – капельница от запоя на дому цена
Комплексный и научно обоснованный подход включает в себя медикаментозную детоксикацию, направленную на быстрое выведение токсинов и продуктов распада алкоголя из организма, и психологическую поддержку, помогающую пациенту справиться с абстинентным синдромом, снизить тягу к алкоголю и сформировать мотивацию к дальнейшему лечению и реабилитации, позволяя обеспечить наиболее быстрое, эффективное и безопасное восстановление физического и психического здоровья пациента в комфортных домашних условиях.
Углубиться в тему – частный нарколог на дом в иркутске
Врач-нарколог проводит комплексное обследование пациента, оценивая степень зависимости и общее состояние организма. В ходе первичного осмотра специалист не только определяет тяжесть алкогольной зависимости, но и выявляет сопутствующие патологии, которые могут повлиять на процесс лечения. Обследование включает лабораторные анализы, электрокардиограмму и другие необходимые диагностические процедуры. Врач тщательно изучает анамнез для выявления возможных противопоказаний к определенным методам терапии. Особое внимание уделяется психологическим аспектам, которые могли способствовать формированию зависимости, что помогает разработать эффективную программу лечения.
Получить дополнительные сведения – вывод из запоя анонимно
Далее, когда физическое состояние стабилизировано, совместно с врачом выбирается стратегия дальнейшего лечения. В «Новая Точка» доступны современные методы кодирования (уколы, таблетки, вшивание препаратов, гипнотерапия), но решение всегда принимается осознанно, с объяснением плюсов, рисков и индивидуальным подбором метода.
Подробнее тут – lechenie-alkogolizma-v-koroleve
Когда запой становится критическим, оперативное вмешательство имеет решающее значение для спасения здоровья и предотвращения необратимых последствий. Во Владимире экстренная помощь нарколога на дому позволяет быстро начать лечение, не требуя госпитализации, что особенно важно для пациентов, нуждающихся в сохранении конфиденциальности и комфорте.
Разобраться лучше – вывод из запоя круглосуточно владимир
Наши специалисты используют проверенные медикаменты, которые подбираются индивидуально для каждого пациента:
Узнать больше – http://narcolog-na-dom-voronezh0.ru/narkolog-na-dom-anonimno-voronezh/
Зависимость от алкоголя или наркотиков — серьёзная проблема, которая постепенно разрушает жизнь, подрывает здоровье, нарушает семейные отношения и ведёт к социальной изоляции. Попытки самостоятельно справиться с заболеванием редко приводят к успеху и зачастую только усугубляют ситуацию. Важно не терять время и обращаться за профессиональной помощью. В наркологической клинике «Наркосфера» в Балашихе пациентов ждёт современное оборудование, команда опытных специалистов, индивидуальный подход и абсолютная анонимность.
Узнать больше – https://narkologicheskaya-klinika-balashiha5.ru
Когда пациент решает обратиться за помощью к наркологу на дом, ему предстоит пройти ряд этапов лечения, каждый из которых будет направлен на устранение последствий алкоголизма. Врач проведет первичный осмотр, выслушает жалобы пациента и на основе собранной информации начнёт индивидуальную программу лечения.
Узнать больше – http://www.domen.ru
Комплексное лечение на дому организовано по строго отлаженной схеме, позволяющей оперативно стабилизировать состояние пациента и провести качественную детоксикацию.
Подробнее – нарколог на дом вывод из запоя на дому
Наркологическая клиника «АнтиДот» предлагает срочный вызов нарколога на дом в Воронеже и Воронежской области. Наша служба экстренной наркологической помощи доступна круглосуточно и позволяет быстро справиться с тяжелыми состояниями, вызванными алкогольной и наркотической зависимостью. Опытные врачи проведут детоксикацию организма, помогут снять абстинентный синдром и стабилизировать общее состояние пациента в комфортных домашних условиях.
Получить дополнительную информацию – нарколог на дом круглосуточно в воронеже
В подобных случаях вывод из запоя в домашних условиях без врачебного контроля крайне опасен и может привести к тяжёлым последствиям. Лучше сразу вызвать нарколога или привезти пациента в клинику — это поможет избежать критических осложнений.
Исследовать вопрос подробнее – vyvod-iz-zapoya-kruglosutochno
Экстренная помощь при выводе из запоя в Архангельске организована по четко отлаженной и многократно проверенной на практике схеме, что позволяет оперативно реагировать на вызовы и оказывать максимально эффективную помощь пациентам в критическом состоянии
Детальнее – вывод из запоя на дому архангельск цены
Достаточно связаться по телефону или через мессенджер и сообщить минимальный набор данных — имя и адрес. Все остальные детали обсуждаются устно, без фиксации на бумаге.
Подробнее тут – http://narkologicheskaya-klinika-ekaterinburg0.ru/
После обращения по телефону или через сайт диспетчер уточняет адрес и состояние пациента. В экстренных случаях команда врачей может прибыть уже в течение 60 минут, обычно — за 1–2 часа. На месте проводится первичный осмотр: проверяются жизненные показатели, уточняется история употребления, сопутствующие заболевания. Врач определяет наиболее безопасную и эффективную тактику, исходя из возраста, состояния здоровья и длительности запоя.
Разобраться лучше – вывод из запоя капельница
Чтобы избежать опасных последствий, необходимо постепенно и безопасно вывести алкоголь из организма. Клиника «Ясный горизонт» предлагает профессиональный вывод из запоя в Новокузнецке как в условиях стационара, так и с выездом нарколога на дом.
Получить больше информации – вывод из запоя цена
Клиника «УралМед» работает без выходных и праздников: прием пациентов — круглосуточно. Это позволяет оказывать экстренную помощь при острых состояниях, а также вести наблюдение за динамикой восстановления здоровья в ночные часы.
Получить больше информации – https://lechenie-alkogolizma-ekaterinburg0.ru/klinika-lecheniya-alkogolizma-v-ekb
Далее, когда физическое состояние стабилизировано, совместно с врачом выбирается стратегия дальнейшего лечения. В «Новая Точка» доступны современные методы кодирования (уколы, таблетки, вшивание препаратов, гипнотерапия), но решение всегда принимается осознанно, с объяснением плюсов, рисков и индивидуальным подбором метода.
Подробнее тут – klinika-lechenie-alkogolizma-ceny
Алкогольная зависимость — одна из самых распространенных проблем нашего времени, требующая немедленного и грамотного вмешательства. В Екатеринбурге капельница от запоя является одним из самых популярных и действенных методов восстановления после длительного употребления алкоголя. Она помогает организму справиться с интоксикацией, восстанавливает физическое и эмоциональное состояние пациента, улучшает самочувствие в короткие сроки. При этом лечение может быть организовано как в стационаре, так и на дому, в зависимости от удобства пациента.
Разобраться лучше – капельница от запоя выезд в екатеринбурге
Запой и алкогольная интоксикация – это состояния, при которых организм уже не способен самостоятельно справиться с токсинами. Попытки выйти из запоя без медицинского вмешательства могут привести к серьёзным осложнениям, таким как скачки давления, судороги, галлюцинации и даже алкогольный психоз.
Углубиться в тему – запой нарколог на дом в иркутске
Современная жизнь, особенно в крупном городе, как Красноярск, часто становится причиной различных зависимостей. Работа в условиях постоянного стресса, высокий ритм жизни и эмоциональные перегрузки могут привести к проблемам, которые требуют неотложной медицинской помощи. Одним из наиболее удобных решений в такой ситуации является вызов нарколога на дом.
Подробнее можно узнать тут – https://narcolog-na-dom-v-krasnoyarske55.ru/narkolog-na-dom-krasnoyarsk-tseny/
Вызов нарколога на дом и круглосуточная поддержка в условиях стационара — ключевая услуга клиники «НаркоЦентр», направленная на оказание экстренной и плановой помощи пациентам с алкогольной и наркотической зависимостью. Мы понимаем, что запой или интоксикация могут развиться внезапно, поэтому врач выезжает в любой район Екатеринбурга и ближайшего подмосковья менее чем за 30 минут. При этом круглосуточное дежурство специалистов позволяет продолжить наблюдение и поддержку в стенах клиники, если домашние условия оказываются недостаточно безопасными или комфортными.
Подробнее тут – https://narkologicheskaya-pomoshh-ekaterinburg0.ru/vyzvat-narkologicheskuyu-pomoshh-v-ekb
Основу капельницы составляют инфузионные растворы, которые помогают устранить обезвоживание. Дополнительно вводятся витамины для улучшения обменных процессов, препараты для защиты печени, а также успокоительные средства для стабилизации нервной системы. Компоненты подбираются индивидуально с учетом состояния пациента, чтобы обеспечить максимальную эффективность и безопасность.
Детальнее – поставить капельницу от запоя в красноярске
Запой – это острое и крайне опасное состояние, характеризующееся полной и неконтролируемой утратой способности регулировать потребление алкоголя, что с высокой вероятностью может привести к серьезным и даже потенциально смертельным последствиям для здоровья, поражая практически все жизненно важные органы и системы организма, от нервной и сердечно-сосудистой до пищеварительной и эндокринной
Исследовать вопрос подробнее – вызов нарколога на дом в иркутске
Распознать необходимость лечения просто: достаточно внимательно отнестись к тревожным признакам. Вот лишь некоторые ситуации, когда обращение в наркологическую клинику становится жизненно важным:
Выяснить больше – narkologicheskaya-klinika-balashiha5.ru/
Одним из ключевых достоинств выезда нарколога на дом является возможность лечения в привычной для пациента среде, что способствует снижению стресса и ускоряет процесс выздоровления. Кроме того, лечение на дому гарантирует полную анонимность и индивидуальный подход к каждому пациенту.
Подробнее – нарколог на дом цена в иркутске
В подобных случаях вывод из запоя в домашних условиях без врачебного контроля крайне опасен и может привести к тяжёлым последствиям. Лучше сразу вызвать нарколога или привезти пациента в клинику — это поможет избежать критических осложнений.
Узнать больше – anonimnyj-vyvod-iz-zapoya
Когда запой становится критическим, оперативное вмешательство имеет решающее значение для спасения здоровья и предотвращения необратимых последствий. Во Владимире экстренная помощь нарколога на дому позволяет быстро начать лечение, не требуя госпитализации, что особенно важно для пациентов, нуждающихся в сохранении конфиденциальности и комфорте.
Подробнее тут – https://vyvod-iz-zapoya-vladimir000.ru/vyvod-iz-zapoya-anonimno-vladimir
Экстренная помощь при выводе из запоя в Архангельске организована по четко отлаженной и многократно проверенной на практике схеме, что позволяет оперативно реагировать на вызовы и оказывать максимально эффективную помощь пациентам в критическом состоянии
Подробнее тут – вывод из запоя на дому архангельск цены
После вашего звонка нарколог выезжает на дом в течение 30–60 минут. Прибыв на место, специалист проводит всесторонний медицинский осмотр, включая измерение артериального давления, пульса и уровня кислорода в крови, а также собирает анамнез для определения степени интоксикации.
Углубиться в тему – вызов нарколога на дом воронеж.
Когда пациент решает обратиться за помощью к наркологу на дом, ему предстоит пройти ряд этапов лечения, каждый из которых будет направлен на устранение последствий алкоголизма. Врач проведет первичный осмотр, выслушает жалобы пациента и на основе собранной информации начнёт индивидуальную программу лечения.
Выяснить больше – нарколог на дом вывод из запоя екатеринбург
При вызовах в ночное время или в случаях с тяжелой интоксикацией стоимость может увеличиваться до 3000–4500 рублей. Окончательная сумма определяется после первичного осмотра и обсуждения индивидуальной схемы лечения с пациентом.
Подробнее можно узнать тут – вывод из запоя цена владимир
Особое внимание в клинике уделяется постоянному контролю за состоянием: врачи и медсёстры следят за показателями здоровья, в любой момент могут скорректировать курс терапии или подключить дополнительных специалистов. Все препараты подбираются индивидуально — с учётом возраста, стажа употребления, веса, состояния органов и особенностей сопутствующих заболеваний.
Подробнее можно узнать тут – вывод из запоя с выездом
Есть ситуации, когда дальнейшее промедление может привести к необратимым последствиям:
Углубиться в тему – klinika-lechenie-alkogolizma-ceny
После поступления звонка нарколог оперативно выезжает по указанному адресу и прибывает в течение 30–60 минут. Врач незамедлительно приступает к оказанию помощи по четко отработанному алгоритму, состоящему из следующих этапов:
Исследовать вопрос подробнее – вызов врача нарколога на дом
Выездной формат позволяет избежать контактов с другими пациентами в клинике и очистить организм в привычной обстановке. Специалисты самостоятельно привозят весь необходимый набор медикаментов и расходных материалов.
Подробнее – chastnaya narkologicheskaya klinika ekaterinburg
Эта процедура доступна как в условиях клиники, так и на дому, что делает ее универсальным решением для различных жизненных ситуаций. При этом важно доверять свое здоровье только профессиональным врачам, которые могут обеспечить безопасное и качественное лечение.
Углубиться в тему – http://kapelnica-ot-zapoya-krasnoyarsk55.ru
После диагностики выявленные нарушения восполняются посредством инфузий с витаминами группы B, C, магнием и элементами.
Разобраться лучше – https://lechenie-alkogolizma-ekaterinburg0.ru/
В Новокузнецке опытные специалисты предлагают современные и эффективные методики вывода из запоя, позволяющие оперативно стабилизировать состояние пациента, минимизировать риски для здоровья и обеспечить максимально безопасное и комфортное восстановление организма
Получить дополнительные сведения – вывод из запоя на дому новокузнецк круглосуточно
Круглосуточная клиника «НаркоЦентр» предлагает широкий спектр наркологических услуг в Екатеринбурге и области. В числе основных направлений — выезд врача на дом, проведение детоксикационных процедур, индивидуальные программы восстановления, врачебное сопровождение в стационаре, а также психологическая и физиотерапевтическая реабилитация. Мы опираемся на международные стандарты терапии и применяем только сертифицированные препараты, что гарантирует безопасность и эффективность лечения.
Узнать больше – http://narkologicheskaya-pomoshh-ekaterinburg0.ru
В состав капельницы обычно входят растворы для гидратации, витаминно-минеральные комплексы, гепатопротекторы для защиты печени, а также седативные препараты для стабилизации нервной системы. Такой подход позволяет быстро справиться с признаками похмелья и предотвратить развитие более серьезных осложнений.
Исследовать вопрос подробнее – http://kapelnica-ot-zapoya-ekb55.ru/kapelnicza-ot-zapoya-v-stacionare-ekaterinburg/https://kapelnica-ot-zapoya-ekb55.ru
Есть ситуации, когда дальнейшее промедление может привести к необратимым последствиям:
Исследовать вопрос подробнее – klinika-lechenie-alkogolizma-ceny
Запой – это острое и крайне опасное состояние, характеризующееся полной и неконтролируемой утратой способности регулировать потребление алкоголя, что с высокой вероятностью может привести к серьезным и даже потенциально смертельным последствиям для здоровья, поражая практически все жизненно важные органы и системы организма, от нервной и сердечно-сосудистой до пищеварительной и эндокринной
Углубиться в тему – нарколог на дом недорого иркутск
Это позволяет оперативно и с высокой точностью определить степень алкогольной интоксикации, выявить наличие сопутствующих заболеваний и выбрать наиболее оптимальную и безопасную стратегию лечения, учитывающую все индивидуальные особенности конкретного пациента.
Подробнее тут – http://vyvod-iz-zapoya-arkhangelsk66.ru/vyvod-iz-zapoya-kruglosutochno-arkhangelsk
Алкогольный запой – это не просто следствие длительного употребления спиртного, а серьёзное состояние, которое требует квалифицированного лечения. В состоянии запоя организм не может самостоятельно очиститься от токсинов, что приводит к нарушению работы внутренних органов, обезвоживанию, резким скачкам давления и серьёзным психоэмоциональным расстройствам.
Подробнее можно узнать тут – vyvod-iz-zapoya-kruglosutochno novokuznetsk
В клинике «Решение+» предусмотрены оба основных формата: выезд на дом и лечение в стационаре. Домашний вариант подойдёт тем, чьё состояние относительно стабильно, нет риска тяжёлых осложнений. Врач приезжает с полным комплектом оборудования и медикаментов, проводит капельницу на дому и даёт инструкции по дальнейшему уходу.
Углубиться в тему – vyvod-iz-zapoya-v-stacionare
В зависимости от индивидуальных особенностей и пожеланий пациента, терапия может проводиться разными способами:
Изучить вопрос глубже – вывод из запоя красноярск.
Распознать необходимость лечения просто: достаточно внимательно отнестись к тревожным признакам. Вот лишь некоторые ситуации, когда обращение в наркологическую клинику становится жизненно важным:
Выяснить больше – наркологическая клиника в балашихе
В подобных случаях вывод из запоя в домашних условиях без врачебного контроля крайне опасен и может привести к тяжёлым последствиям. Лучше сразу вызвать нарколога или привезти пациента в клинику — это поможет избежать критических осложнений.
Подробнее тут – vrach-vyvod-iz-zapoya
Срочный вызов нарколога необходим, если:
Ознакомиться с деталями – https://narcolog-na-dom-v-irkutske6.ru/
Есть ситуации, когда дальнейшее промедление может привести к необратимым последствиям:
Ознакомиться с деталями – lechenie-alkogolizma
Когда запой становится критическим, оперативное вмешательство имеет решающее значение для спасения здоровья и предотвращения необратимых последствий. Во Владимире экстренная помощь нарколога на дому позволяет быстро начать лечение, не требуя госпитализации, что особенно важно для пациентов, нуждающихся в сохранении конфиденциальности и комфорте.
Узнать больше – https://vyvod-iz-zapoya-vladimir000.ru/vyvod-iz-zapoya-anonimno-vladimir/
Когда речь идет о лечении зависимостей, многие пациенты испытывают стресс от визита в медицинские учреждения, особенно если это касается такой деликатной темы, как алкоголизм. Лечение на дому помогает избежать всех этих трудностей и обеспечивает комфорт для пациента. Привычная домашняя обстановка снижает тревожность, что позитивно влияет на процесс выздоровления.
Ознакомиться с деталями – нарколог на дом екатеринбург
В таких случаях своевременное обращение за помощью позволяет быстро стабилизировать состояние и предотвратить развитие серьезных осложнений.
Подробнее можно узнать тут – https://narcolog-na-dom-voronezh0.ru/narkolog-na-dom-anonimno-voronezh
Когда организм насыщен токсинами, нормальное функционирование органов нарушается. Капельница помогает быстро очистить кровь, восстановить клетки печени и улучшить общее состояние пациента, чтобы как можно быстрее вернуться к привычному уровню жизни.
Изучить вопрос глубже – http://kapelnica-ot-zapoya-ektb55.ru/kapelnicza-ot-zapoya-v-stacionare-ekaterinburg/https://kapelnica-ot-zapoya-ektb55.ru
Выездной формат позволяет избежать контактов с другими пациентами в клинике и очистить организм в привычной обстановке. Специалисты самостоятельно привозят весь необходимый набор медикаментов и расходных материалов.
Получить дополнительную информацию – наркологическая клиника нарколог
Алкогольная зависимость остается одной из самых серьезных проблем современного общества. Когда человек сталкивается с последствиями длительного употребления спиртных напитков, важно вовремя принять меры, чтобы минимизировать вред для организма. В таких случаях капельница от запоя становится эффективным инструментом для снятия интоксикации и восстановления здоровья.
Разобраться лучше – http://kapelnica-ot-zapoya-krasnoyarsk55.ru/kapelnicza-ot-zapoya-na-domu-krasnoyarsk/
Когда запой становится угрозой для здоровья, оперативное вмешательство имеет решающее значение. В Тюмени, Тюменская область, услуга «капельница от запоя на дому» помогает быстро начать детоксикацию организма, восстановить нормальный обмен веществ и стабилизировать работу внутренних органов. Такой метод лечения позволяет пациенту получить профессиональную медицинскую помощь в комфортной домашней обстановке, при этом сохраняя конфиденциальность и снижая эмоциональный стресс.
Узнать больше – https://vyvod-iz-zapoya-vladimir00.ru/vyvod-iz-zapoya-anonimno-vladimir
В этих случаях вызов нарколога на дом не только оправдан, но и жизненно необходим для предотвращения опасных осложнений и стабилизации здоровья пациента.
Узнать больше – нарколог на дом вывод в воронеже
Если пациенту требуется постоянный мониторинг или комплексное лечение, мы обеспечиваем круглосуточное пребывание в стационаре. Здесь доступны углублённая диагностика — УЗИ органов брюшной полости, расширенные анализы крови, кардиомониторинг — и коррекция терапии в режиме реального времени. Комфортные палаты, ежедневное наблюдение медсестры и консультации психотерапевта создают условия для быстрого и безопасного выхода из зависимости.
Подробнее тут – срочная наркологическая помощь
Каждый пациент в «УралМед» получает персональный маршрут реабилитации, составленный после комплексного обследования. План включает медикаментозное выведение из запоя, коррекцию биохимических показателей и психологическую реабилитацию.
Исследовать вопрос подробнее – лечение алкоголизма екатеринбург
Алкогольная зависимость — одна из самых распространенных проблем нашего времени, требующая немедленного и грамотного вмешательства. В Екатеринбурге капельница от запоя является одним из самых популярных и действенных методов восстановления после длительного употребления алкоголя. Она помогает организму справиться с интоксикацией, восстанавливает физическое и эмоциональное состояние пациента, улучшает самочувствие в короткие сроки. При этом лечение может быть организовано как в стационаре, так и на дому, в зависимости от удобства пациента.
Ознакомиться с деталями – капельница от запоя на дому цена екатеринбург
Одним из ключевых достоинств выезда нарколога на дом является возможность лечения в привычной для пациента среде, что способствует снижению стресса и ускоряет процесс выздоровления. Кроме того, лечение на дому гарантирует полную анонимность и индивидуальный подход к каждому пациенту.
Подробнее тут – вызов нарколога на дом иркутск.
При прибытии на место вызова квалифицированный врач проводит детальный и всесторонний осмотр пациента, измеряет основные жизненно важные показатели (артериальное давление, пульс, частоту дыхания, температуру тела), тщательно изучает анамнез пациента, собирая информацию о предыдущих заболеваниях, аллергических реакциях и принимаемых лекарственных препаратах, чтобы максимально точно оценить риски и спланировать лечение
Выяснить больше – вывод из запоя на дому архангельск цены
Кроме того, врач оказывает психологическую поддержку, которая помогает пациенту справиться с чувством тревоги, депрессией и страхом, возникающими на фоне зависимости.
Детальнее – vyzvat-narkologa-na-dom krasnojarsk
В Иркутске опытные и квалифицированные специалисты, оказывающие наркологическую помощь, предлагают востребованную и удобную услугу вызова врача-нарколога на дом, что предоставляет уникальную возможность оперативно начать необходимое лечение в комфортной и привычной домашней обстановке, обеспечивая при этом полную конфиденциальность и анонимность, что особенно важно для многих пациентов
Подробнее тут – нарколог на дом иркутск
Каждый пациент в «НаркоМедцентре» в Балашихе с самого начала окружён вниманием и заботой. Сразу после обращения по телефону или через сайт медицинский персонал консультирует родственников, уточняет детали состояния, даёт рекомендации по первой помощи и при необходимости отправляет бригаду наркологов на дом. В случае тяжёлых абстинентных проявлений возможно экстренное транспортирование пациента в стационар.
Получить дополнительные сведения – vyvod-iz-zapoya-klinika
Выбирая лечение в «Наркосфере», пациенты Балашихи и Балашихинского района могут быть уверены в высоком качестве услуг и современном подходе. Здесь применяют только сертифицированные препараты, используются новейшие методы терапии и реабилитации. Клиника работает круглосуточно, принимает пациентов в любой день недели и всегда готова к экстренному реагированию. Индивидуальный подход проявляется не только в подборе схемы лечения, но и в поддержке семьи на каждом этапе выздоровления. Весь процесс проходит в обстановке полной конфиденциальности: сведения о пациентах не передаются в сторонние организации, не оформляется наркологический учёт.
Подробнее – chastnaya-narkologicheskaya-klinika
Особое внимание в клинике уделяется постоянному контролю за состоянием: врачи и медсёстры следят за показателями здоровья, в любой момент могут скорректировать курс терапии или подключить дополнительных специалистов. Все препараты подбираются индивидуально — с учётом возраста, стажа употребления, веса, состояния органов и особенностей сопутствующих заболеваний.
Выяснить больше – нарколог вывод из запоя
Клиника «НаркоМед» в Екатеринбурге предоставляет полный спектр наркологической помощи круглосуточно и анонимно. Благодаря мобильным бригадам и выездам на дом, пациенты получают профессиональное лечение прямо в комфортной обстановке, без стресса, связанного с госпитализацией. В статье подробно рассматриваются услуги клиники, этапы терапии и ключевые преимущества обращения в «НаркоМед».
Изучить вопрос глубже – наркологические клиники алкоголизм свердловская область
Процесс лечения будет зависеть от состояния пациента и его особенностей. Врач подберёт нужную дозировку и состав препаратов для наиболее эффективного результата.
Углубиться в тему – вызов нарколога на дом
Использование автоматизированных систем дозирования обеспечивает точное введение лекарственных средств, что минимизирует риск передозировки и побочных эффектов. Постоянный мониторинг жизненно важных показателей позволяет врачу оперативно корректировать дозировки и адаптировать терапию под динамику состояния пациента.
Углубиться в тему – http://vyvod-iz-zapoya-vladimir000.ru/vyvod-iz-zapoya-anonimno-vladimir/
В таких случаях своевременное обращение за помощью позволяет быстро стабилизировать состояние и предотвратить развитие серьезных осложнений.
Получить больше информации – нарколог на дом круглосуточно в воронеже
Этап лечения
Углубиться в тему – [url=https://vyvod-iz-zapoya-novokuznetsk6.ru/]вывод из запоя недорого в новокузнецке[/url]
Анализ рынка услуг экстренной помощи в Тюмени позволяет выделить следующие ориентировочные цены:
Узнать больше – https://vyvod-iz-zapoya-vladimir00.ru/
Запой – это крайне опасное состояние, характеризующееся полной утратой контроля над употреблением алкоголя, когда токсичные вещества в огромном количестве накапливаются в организме, непосредственно угрожая жизни и нормальному функционированию всех систем
Выяснить больше – http://vyvod-iz-zapoya-arkhangelsk66.ru/vyvod-iz-zapoya-klinika-arkhangelsk
Далее, когда физическое состояние стабилизировано, совместно с врачом выбирается стратегия дальнейшего лечения. В «Новая Точка» доступны современные методы кодирования (уколы, таблетки, вшивание препаратов, гипнотерапия), но решение всегда принимается осознанно, с объяснением плюсов, рисков и индивидуальным подбором метода.
Получить больше информации – лечение алкоголизма на дому стоимость
Если пациенту требуется постоянный мониторинг или комплексное лечение, мы обеспечиваем круглосуточное пребывание в стационаре. Здесь доступны углублённая диагностика — УЗИ органов брюшной полости, расширенные анализы крови, кардиомониторинг — и коррекция терапии в режиме реального времени. Комфортные палаты, ежедневное наблюдение медсестры и консультации психотерапевта создают условия для быстрого и безопасного выхода из зависимости.
Углубиться в тему – https://narkologicheskaya-pomoshh-ekaterinburg0.ru/neotlozhnaya-narkologicheskaya-pomoshh-v-ekb/
Чтобы избежать последствий и обеспечить безопасное восстановление организма, важно своевременно обратиться за профессиональной медицинской помощью. В клинике «Стоп-синдром» работает круглосуточная служба выезда нарколога на дом, что позволяет получить срочное лечение в комфортных условиях без госпитализации.
Подробнее – вызов врача нарколога на дом иркутск
В клинике «Решение+» предусмотрены оба основных формата: выезд на дом и лечение в стационаре. Домашний вариант подойдёт тем, чьё состояние относительно стабильно, нет риска тяжёлых осложнений. Врач приезжает с полным комплектом оборудования и медикаментов, проводит капельницу на дому и даёт инструкции по дальнейшему уходу.
Изучить вопрос глубже – вывод из запоя дешево
После поступления звонка нарколог оперативно выезжает по указанному адресу и прибывает в течение 30–60 минут. Врач незамедлительно приступает к оказанию помощи по четко отработанному алгоритму, состоящему из следующих этапов:
Получить дополнительные сведения – нарколог на дом цена
После диагностики выявленные нарушения восполняются посредством инфузий с витаминами группы B, C, магнием и элементами.
Подробнее – клиника лечения алкоголизма екатеринбург.
Процедура капельницы — это целый комплекс мероприятий, направленных на очистку организма и восстановление его нормальной работы. Для этого в капельницу добавляют раствор для регидратации, витамины, антиоксиданты, препараты для поддержания печени и успокоительные средства. Все компоненты способствуют быстрому очищению от токсинов, восстановлению психоэмоционального фона и нормализации обменных процессов.
Подробнее можно узнать тут – после капельницы от запоя
Выбирая лечение в «Наркосфере», пациенты Балашихи и Балашихинского района могут быть уверены в высоком качестве услуг и современном подходе. Здесь применяют только сертифицированные препараты, используются новейшие методы терапии и реабилитации. Клиника работает круглосуточно, принимает пациентов в любой день недели и всегда готова к экстренному реагированию. Индивидуальный подход проявляется не только в подборе схемы лечения, но и в поддержке семьи на каждом этапе выздоровления. Весь процесс проходит в обстановке полной конфиденциальности: сведения о пациентах не передаются в сторонние организации, не оформляется наркологический учёт.
Подробнее можно узнать тут – narkologicheskaya-klinika
Каждый пациент в «НаркоМедцентре» в Балашихе с самого начала окружён вниманием и заботой. Сразу после обращения по телефону или через сайт медицинский персонал консультирует родственников, уточняет детали состояния, даёт рекомендации по первой помощи и при необходимости отправляет бригаду наркологов на дом. В случае тяжёлых абстинентных проявлений возможно экстренное транспортирование пациента в стационар.
Получить дополнительную информацию – vyvod-iz-zapoya-na-domu
Своевременное обращение за профессиональной медицинской помощью помогает эффективно предотвратить дальнейшее ухудшение состояния, развитие серьезных хронических осложнений, таких как поражение печени, сердца, почек и головного мозга, а также минимизировать негативное воздействие алкоголя на психику и эмоциональное состояние пациента, предотвращая развитие депрессии, тревожности и других психических расстройств, связанных с алкогольной зависимостью
Получить дополнительную информацию – платный нарколог на дом в иркутске
Заключительная фаза реабилитации фокусируется на обучении пациента жизни без алкоголизма и развитии навыков преодоления жизненных трудностей естественным путем. В рамках этого этапа пациенты активно участвуют в специализированных программах, нацеленных на восстановление утраченных социальных связей и профессиональных компетенций. Программа включает трудотерапию, образовательные курсы и тематические семинары. Особое внимание уделяется работе с семьей: родственники проходят специальное обучение, помогающее им лучше понимать особенности зависимости быстро и эффективно оказывать поддержку близкому человеку.
Подробнее – http://vyvod-iz-zapoya-krasnoyarsk55.ru/vyvod-iz-zapoya-v-krasnoyarske-staczionare/
В Архангельске, в условиях, когда каждая минута на счету, экстренная медицинская помощь становится особенно актуальной, и специализированные службы, укомплектованные опытными и квалифицированными специалистами, готовы оперативно вмешаться для стабилизации критического состояния пациента и предотвращения непоправимых последствий для его здоровья
Подробнее можно узнать тут – вывод. из. запоя. архангельск.
Выездной формат позволяет избежать контактов с другими пациентами в клинике и очистить организм в привычной обстановке. Специалисты самостоятельно привозят весь необходимый набор медикаментов и расходных материалов.
Узнать больше – наркологическая клиника екатеринбург.
Вызов специалиста на дом рекомендуется, если запой затягивается и самостоятельное прекращение пьянства становится невозможным. Своевременное обращение помогает предотвратить ухудшение состояния, развитие хронических осложнений и негативное воздействие на психику.
Исследовать вопрос подробнее – нарколог на дом клиника в иркутске
Кроме того, анонимность является важной составляющей этой услуги. Лечение дома исключает возможность столкновения с посторонними людьми и помогает пациентам сохранить свою репутацию. Клиника «Гармония и Свет» обеспечивает полную конфиденциальность, предоставляя пациентам возможность получать помощь без лишних вопросов и обсуждений.
Подробнее – вызов врача нарколога на дом в екатеринбурге
После первичного осмотра начинается активная фаза детоксикации. Современные препараты вводятся капельничным методом для быстрого снижения уровня токсинов в крови и восстановления обменных процессов. Этот этап критически важен для нормализации работы печени, почек и сердечно-сосудистой системы.
Получить больше информации – владимир вывод из запоя
Клиника «НаркологикПлюс» предоставляет квалифицированную помощь нарколога на дому в Воронеже. Если вы или ваши близкие столкнулись с последствиями длительного употребления алкоголя или наркотиков, наши специалисты готовы оперативно выехать и оказать экстренную помощь. Мы проводим детоксикацию организма, снимаем симптомы абстинентного синдрома и стабилизируем состояние пациента, обеспечивая высокий уровень безопасности, строгую анонимность и индивидуальный подход.
Ознакомиться с деталями – https://narcolog-na-dom-voronezh0.ru/zapoj-narkolog-na-dom-voronezh/
Служба выездных бригад работает круглосуточно и готова выехать по любому адресу в черте города и ближайших пригородах. Врач прибывает полностью оснащённым — с набором препаратов для восстановления водно-электролитного баланса, коррекции артериального давления и поддержки функций печени. Первая помощь включает введение детоксикационных растворов, средств для нормализации работы сердечно-сосудистой системы и купирования абстинентного синдрома.
Выяснить больше – narkologicheskaya-pomoshh-ekaterinburg0.ru/
Услуга капельничного вывода из запоя на дому в Тюмени предоставляет комплексный подход к экстренному лечению алкогольной интоксикации. Врач приезжает на дом, проводит первичный осмотр, собирает анамнез и назначает индивидуальную схему терапии. Современные методы инфузионной терапии позволяют точно дозировать препараты, обеспечивая быструю детоксикацию и минимизируя риск осложнений.
Получить дополнительные сведения – https://vyvod-iz-zapoya-vladimir00.ru/vyvod-iz-zapoya-anonimno-vladimir/
Запой — это не просто временная слабость, а критическое состояние, требующее экстренного медицинского вмешательства. Особенно опасно откладывать обращение за помощью, если у человека наблюдаются такие симптомы:
Узнать больше – vyvod-iz-zapoya
При сильной интоксикации требуется полное очищение организма от токсинов. Детоксикация помогает нормализовать работу внутренних органов, улучшить общее состояние пациента и восстановить баланс жидкостей в организме. Специалист использует современные препараты, включая электролиты, глюкозу и антиоксиданты, для безопасного и эффективного очищения организма.
Изучить вопрос глубже – http://narcolog-na-dom-krasnoyarsk55.ru
Запой – это состояние полной утраты контроля над потреблением алкоголя, представляющее серьезную опасность для здоровья и даже жизни, поскольку в результате длительной алкогольной интоксикации возникают критические нарушения работы внутренних органов
Разобраться лучше – вывод. из. запоя. новокузнецк.
Стоимость капельницы от запоя в Екатеринбурге зависит от нескольких факторов, таких как состав раствора, срочность вызова и место проведения процедуры. Базовый состав включает физраствор, витамины, антиоксиданты и средства для защиты печени, но в случае необходимости могут быть добавлены дополнительные препараты, что увеличивает цену.
Изучить вопрос глубже – капельница от запоя вызов город
После поступления звонка нарколог оперативно выезжает по указанному адресу и прибывает в течение 30–60 минут. Врач незамедлительно приступает к оказанию помощи по четко отработанному алгоритму, состоящему из следующих этапов:
Получить больше информации – http://narcolog-na-dom-voronezh00.ru
Алкоголизм — хроническое заболевание, требующее комплексного подхода и круглосуточного контроля. Клиника «УралМед» в Екатеринбурге предлагает полный спектр услуг для пациентов любого уровня зависимости: от экстренной детоксикации до долгосрочной реабилитации. Главные принципы работы — абсолютная анонимность, индивидуальный план лечения и постоянное сопровождение квалифицированной командой специалистов.
Узнать больше – lechenie-alkogolizma-ekaterinburg0.ru/
Выбирая лечение в «Наркосфере», пациенты Балашихи и Балашихинского района могут быть уверены в высоком качестве услуг и современном подходе. Здесь применяют только сертифицированные препараты, используются новейшие методы терапии и реабилитации. Клиника работает круглосуточно, принимает пациентов в любой день недели и всегда готова к экстренному реагированию. Индивидуальный подход проявляется не только в подборе схемы лечения, но и в поддержке семьи на каждом этапе выздоровления. Весь процесс проходит в обстановке полной конфиденциальности: сведения о пациентах не передаются в сторонние организации, не оформляется наркологический учёт.
Изучить вопрос глубже – narkologicheskaya-klinika-dlya-podrostkov
Многодневные алкогольные запои опасны не только для здоровья, но и для жизни. В этот период организм подвергается тяжелейшей интоксикации, страдают сердце, печень, нервная система, а психоэмоциональное состояние может выйти из-под контроля. Самостоятельно выйти из запоя очень трудно и опасно: любое промедление или попытка “перетерпеть” чреваты судорогами, галлюцинациями, инфарктом, тяжелой депрессией или делирием. Именно поэтому своевременное обращение к профессионалам — залог не только скорого, но и безопасного восстановления. В наркологической клинике «НаркоМедцентр» в Балашихе организован современный и медицински обоснованный вывод из запоя: здесь пациентов ждет индивидуальный подход, круглосуточное медицинское наблюдение и полная конфиденциальность.
Разобраться лучше – vyvod-iz-zapoya-na-domu-kruglosutochno
В Иркутске опытные и квалифицированные специалисты, оказывающие наркологическую помощь, предлагают востребованную и удобную услугу вызова врача-нарколога на дом, что предоставляет уникальную возможность оперативно начать необходимое лечение в комфортной и привычной домашней обстановке, обеспечивая при этом полную конфиденциальность и анонимность, что особенно важно для многих пациентов
Узнать больше – нарколог на дом иркутск
Кроме того, врач оказывает психологическую поддержку, которая помогает пациенту справиться с чувством тревоги, депрессией и страхом, возникающими на фоне зависимости.
Подробнее – нарколог на дом анонимно в красноярске
Чтобы избежать опасных последствий, необходимо постепенно и безопасно вывести алкоголь из организма. Клиника «Ясный горизонт» предлагает профессиональный вывод из запоя в Новокузнецке как в условиях стационара, так и с выездом нарколога на дом.
Выяснить больше – http://vyvod-iz-zapoya-novokuznetsk6.ru
Профессионализм медицинского персонала имеет решающее значение для успешности лечения. Только опытные врачи могут правильно оценить состояние пациента, выбрать подходящий состав растворов и корректно провести терапию, исключив риски побочных эффектов. Опытный специалист гарантирует, что процедура будет выполнена правильно, а пациент получит все необходимые препараты для быстрого восстановления.
Изучить вопрос глубже – капельница от запоя на дому екатеринбург.
Такой грамотный и научно обоснованный подход позволяет максимально быстро нейтрализовать токсическую нагрузку, восстановить жизненно важные функции организма, стабилизировать состояние пациента и предотвратить развитие серьезных осложнений, обеспечивая наилучшие возможные результаты лечения в условиях экстренной ситуации
Подробнее тут – вывод из запоя недорого архангельск
Запой и алкогольная интоксикация – это состояния, при которых организм уже не способен самостоятельно справиться с токсинами. Попытки выйти из запоя без медицинского вмешательства могут привести к серьёзным осложнениям, таким как скачки давления, судороги, галлюцинации и даже алкогольный психоз.
Исследовать вопрос подробнее – нарколог на дом иркутск
В клинике «Решение+» предусмотрены оба основных формата: выезд на дом и лечение в стационаре. Домашний вариант подойдёт тем, чьё состояние относительно стабильно, нет риска тяжёлых осложнений. Врач приезжает с полным комплектом оборудования и медикаментов, проводит капельницу на дому и даёт инструкции по дальнейшему уходу.
Изучить вопрос глубже – narkolog-vyvod-iz-zapoya
Если пациенту требуется постоянный мониторинг или комплексное лечение, мы обеспечиваем круглосуточное пребывание в стационаре. Здесь доступны углублённая диагностика — УЗИ органов брюшной полости, расширенные анализы крови, кардиомониторинг — и коррекция терапии в режиме реального времени. Комфортные палаты, ежедневное наблюдение медсестры и консультации психотерапевта создают условия для быстрого и безопасного выхода из зависимости.
Ознакомиться с деталями – https://narkologicheskaya-pomoshh-ekaterinburg0.ru/skoraya-narkologicheskaya-pomoshh-v-ekb/
С увеличением темпа жизни и нарастающим стрессом, многие люди в Екатеринбурге сталкиваются с зависимостями, особенно с алкогольной. Алкогольная зависимость является одной из наиболее распространённых проблем, требующих немедленного вмешательства специалистов. Важно помнить, что в сложных ситуациях, связанных с зависимостью, помощь не должна откладываться. Вызов нарколога на дом в Екатеринбурге становится идеальным вариантом для тех, кто не может или не хочет покидать свой дом, но нуждается в медицинской помощи.
Получить больше информации – вызвать нарколога на дом екатеринбург
Выездной формат позволяет избежать контактов с другими пациентами в клинике и очистить организм в привычной обстановке. Специалисты самостоятельно привозят весь необходимый набор медикаментов и расходных материалов.
Ознакомиться с деталями – https://narkologicheskaya-klinika-ekaterinburg0.ru/narkologicheskaya-klinika-otzyvy-v-ekb
В клинике каждому пациенту уделяют особое внимание. Врачи знают: универсальных решений нет, за каждым случаем — своя история и свои причины. Первый контакт начинается с конфиденциальной консультации. Можно просто позвонить или написать онлайн — уже на этом этапе врач поможет оценить ситуацию, объяснит возможные этапы и даст рекомендации по подготовке к визиту.
Получить дополнительную информацию – лечение алкоголизма цена
Незамедлительно после вызова нарколог прибывает на дом для проведения тщательного осмотра. На данном этапе специалист собирает анамнез, измеряет жизненно важные показатели — пульс, артериальное давление, температуру — и оценивает степень интоксикации. Эти данные являются основой для составления индивидуального плана лечения.
Изучить вопрос глубже – https://vyvod-iz-zapoya-vladimir000.ru/vyvod-iz-zapoya-na-domu-vladimir
Анализ рынка услуг экстренной помощи в Тюмени позволяет выделить следующие ориентировочные цены:
Подробнее – вывод из запоя владимир
Такая услуга доступна круглосуточно, что позволяет вызвать врача в любое время. Профессиональные специалисты, приехав на дом, тщательно подберут состав капельницы с учетом индивидуальных особенностей пациента, чтобы обеспечить максимально эффективное лечение. Анонимность и высокая квалификация медперсонала делают этот способ особенно удобным для людей, которые предпочитают конфиденциальность.
Получить больше информации – поставить капельницу от запоя в екатеринбурге
Клиника «НаркологикПлюс» предоставляет квалифицированную помощь нарколога на дому в Воронеже. Если вы или ваши близкие столкнулись с последствиями длительного употребления алкоголя или наркотиков, наши специалисты готовы оперативно выехать и оказать экстренную помощь. Мы проводим детоксикацию организма, снимаем симптомы абстинентного синдрома и стабилизируем состояние пациента, обеспечивая высокий уровень безопасности, строгую анонимность и индивидуальный подход.
Ознакомиться с деталями – vyzvat-narkologa-na-dom voronezh
Чем раньше начато лечение, тем выше вероятность полного восстановления здоровья без тяжёлых последствий для организма и психики. В клинике «Наркосфера» к каждому случаю подходят максимально внимательно и индивидуально.
Исследовать вопрос подробнее – platnaya-narkologicheskaya-klinika
Многодневные алкогольные запои опасны не только для здоровья, но и для жизни. В этот период организм подвергается тяжелейшей интоксикации, страдают сердце, печень, нервная система, а психоэмоциональное состояние может выйти из-под контроля. Самостоятельно выйти из запоя очень трудно и опасно: любое промедление или попытка “перетерпеть” чреваты судорогами, галлюцинациями, инфарктом, тяжелой депрессией или делирием. Именно поэтому своевременное обращение к профессионалам — залог не только скорого, но и безопасного восстановления. В наркологической клинике «НаркоМедцентр» в Балашихе организован современный и медицински обоснованный вывод из запоя: здесь пациентов ждет индивидуальный подход, круглосуточное медицинское наблюдение и полная конфиденциальность.
Исследовать вопрос подробнее – vyvod-iz-zapoya-balashiha
После диагностики выявленные нарушения восполняются посредством инфузий с витаминами группы B, C, магнием и элементами.
Углубиться в тему – lechenie alkogolizma ekaterinburg
После поступления звонка нарколог оперативно выезжает по указанному адресу и прибывает в течение 30–60 минут. Врач незамедлительно приступает к оказанию помощи по четко отработанному алгоритму, состоящему из следующих этапов:
Углубиться в тему – нарколог на дом круглосуточно воронеж
Чем дольше и интенсивнее продолжается запой, тем выше становится риск возникновения широкого спектра серьезных и потенциально смертельных осложнений, начиная от тяжелых нарушений работы сердечно-сосудистой системы и заканчивая необратимым повреждением жизненно важных внутренних органов, что требует немедленной и комплексной медицинской помощи
Детальнее – наркология вывод из запоя архангельск
Лечение на дому начинается с оперативного выезда квалифицированного нарколога, который проводит тщательный первичный осмотр, детально оценивает физическое и эмоциональное состояние пациента, определяет степень алкогольной интоксикации и абстинентного синдрома, а также назначает индивидуальную и персонализированную программу терапии, учитывающую все особенности конкретного случая и направленную на максимально быстрое и безопасное восстановление здоровья
Разобраться лучше – вызов нарколога на дом в иркутске
Лечение проводится непосредственно в домашних условиях, что позволяет избежать стресса, связанного с пребыванием в стационаре. Применение современных медикаментов и индивидуальный подход к выбору терапии обеспечивают безопасность и эффективность процедуры.
Получить больше информации – выезд нарколога на дом
Заключительная фаза реабилитации фокусируется на обучении пациента жизни без алкоголизма и развитии навыков преодоления жизненных трудностей естественным путем. В рамках этого этапа пациенты активно участвуют в специализированных программах, нацеленных на восстановление утраченных социальных связей и профессиональных компетенций. Программа включает трудотерапию, образовательные курсы и тематические семинары. Особое внимание уделяется работе с семьей: родственники проходят специальное обучение, помогающее им лучше понимать особенности зависимости быстро и эффективно оказывать поддержку близкому человеку.
Детальнее – вывод из запоя в стационаре в красноярске
Круглосуточная клиника «НаркоЦентр» предлагает широкий спектр наркологических услуг в Екатеринбурге и области. В числе основных направлений — выезд врача на дом, проведение детоксикационных процедур, индивидуальные программы восстановления, врачебное сопровождение в стационаре, а также психологическая и физиотерапевтическая реабилитация. Мы опираемся на международные стандарты терапии и применяем только сертифицированные препараты, что гарантирует безопасность и эффективность лечения.
Исследовать вопрос подробнее – наркологическая помощь
В подобных случаях вывод из запоя в домашних условиях без врачебного контроля крайне опасен и может привести к тяжёлым последствиям. Лучше сразу вызвать нарколога или привезти пациента в клинику — это поможет избежать критических осложнений.
Детальнее – вывод из запоя в стационаре
Как правило, для эффективного устранения токсинов из организма и восстановления нормального функционирования всех органов и систем, назначаются специальные препараты. К таким препаратам относятся растворы для восстановления водно-солевого баланса, витамины и медикаменты для поддержания нормальной работы печени, а также препараты, стабилизирующие психоэмоциональное состояние пациента.
Подробнее – http://narcolog-na-dom-ektb55.ru/narkolog-na-dom-kruglosutochno-ekaterinburg/
Пациенты клиники «НаркоМед» полностью застрахованы от утечки личной информации. Приём и лечение оформляются по псевдониму, документы не передаются в другие организации.
Подробнее можно узнать тут – https://narkologicheskaya-klinika-ekaterinburg0.ru/chastnaya-narkologicheskaya-klinika-v-ekb/
Чтобы избежать опасных последствий, необходимо постепенно и безопасно вывести алкоголь из организма. Клиника «Ясный горизонт» предлагает профессиональный вывод из запоя в Новокузнецке как в условиях стационара, так и с выездом нарколога на дом.
Получить больше информации – вывод из запоя на дому новокузнецк
После первичного осмотра начинается активная фаза детоксикации. Современные препараты вводятся капельничным методом для быстрого снижения уровня токсинов в крови и восстановления обменных процессов. Этот этап критически важен для нормализации работы печени, почек и сердечно-сосудистой системы.
Исследовать вопрос подробнее – вывод. из. запоя. владимир.
Такая услуга доступна круглосуточно, что позволяет вызвать врача в любое время. Профессиональные специалисты, приехав на дом, тщательно подберут состав капельницы с учетом индивидуальных особенностей пациента, чтобы обеспечить максимально эффективное лечение. Анонимность и высокая квалификация медперсонала делают этот способ особенно удобным для людей, которые предпочитают конфиденциальность.
Исследовать вопрос подробнее – капельница от запоя цена екатеринбург
В данной подробной статье максимально детально описываются уникальные и современные методики вывода из запоя, разработанные с учетом последних достижений медицинской науки и направленные на быстрое, эффективное и, что самое главное, безопасное восстановление здоровья в экстренных и неотложных случаях, когда промедление может стоить пациенту жизни
Изучить вопрос глубже – вывод из запоя на дому архангельск круглосуточно
Зависимость от алкоголя или наркотиков — серьёзная проблема, которая постепенно разрушает жизнь, подрывает здоровье, нарушает семейные отношения и ведёт к социальной изоляции. Попытки самостоятельно справиться с заболеванием редко приводят к успеху и зачастую только усугубляют ситуацию. Важно не терять время и обращаться за профессиональной помощью. В наркологической клинике «Наркосфера» в Балашихе пациентов ждёт современное оборудование, команда опытных специалистов, индивидуальный подход и абсолютная анонимность.
Получить дополнительную информацию – платная наркологическая клиника
Чтобы избежать последствий и обеспечить безопасное восстановление организма, важно своевременно обратиться за профессиональной медицинской помощью. В клинике «Стоп-синдром» работает круглосуточная служба выезда нарколога на дом, что позволяет получить срочное лечение в комфортных условиях без госпитализации.
Разобраться лучше – https://narcolog-na-dom-v-irkutske6.ru/vrach-narkolog-na-dom-irkutsk/
В подобных случаях вывод из запоя в домашних условиях без врачебного контроля крайне опасен и может привести к тяжёлым последствиям. Лучше сразу вызвать нарколога или привезти пациента в клинику — это поможет избежать критических осложнений.
Получить дополнительные сведения – vrach-vyvod-iz-zapoya
Алкогольная и наркотическая зависимости могут привести к тяжелым и опасным для жизни состояниям. Вызов нарколога становится необходимым, если:
Подробнее тут – нарколог на дом вывод воронеж
Комплексное лечение на дому организовано по строго отлаженной схеме, позволяющей оперативно стабилизировать состояние пациента и провести качественную детоксикацию.
Подробнее тут – http://vyvod-iz-zapoya-vladimir00.ru/vyvod-iz-zapoya-na-domu-vladimir/https://vyvod-iz-zapoya-vladimir00.ru
В случаях, когда транспортировка в клинику затруднительна или пациент испытывает выраженный стресс, возможно выездное консультирование и начальная детоксикация на дому. Врач прибывает с портативным набором для инфузий, оперативно stabilizирует состояние и даёт рекомендации по дальнейшим действиям.
Выяснить больше – клиника лечения алкоголизма в екатеринбурге
В этих случаях вызов нарколога на дом не только оправдан, но и жизненно необходим для предотвращения опасных осложнений и стабилизации здоровья пациента.
Получить дополнительные сведения – http://narcolog-na-dom-voronezh00.ru
Такой грамотный и современный подход позволяет максимально быстро стабилизировать критическое состояние пациента, минимизировать риск развития опасных осложнений, предотвратить дальнейшее ухудшение здоровья и создать благоприятные условия для эффективного и комфортного выздоровления в домашней обстановке, снижая стресс и тревожность, связанные с госпитализацией
Изучить вопрос глубже – https://narcolog-na-dom-v-irkutske66.ru/vrach-narkolog-na-dom-irkutsk/
После обращения по телефону или через сайт диспетчер уточняет адрес и состояние пациента. В экстренных случаях команда врачей может прибыть уже в течение 60 минут, обычно — за 1–2 часа. На месте проводится первичный осмотр: проверяются жизненные показатели, уточняется история употребления, сопутствующие заболевания. Врач определяет наиболее безопасную и эффективную тактику, исходя из возраста, состояния здоровья и длительности запоя.
Получить дополнительные сведения – срочный вывод из запоя ногинск
Современная жизнь, особенно в крупном городе, как Красноярск, часто становится причиной различных зависимостей. Работа в условиях постоянного стресса, высокий ритм жизни и эмоциональные перегрузки могут привести к проблемам, которые требуют неотложной медицинской помощи. Одним из наиболее удобных решений в такой ситуации является вызов нарколога на дом.
Получить больше информации – http://
Красноярск, как и любой крупный город, сталкивается с распространенными проблемами зависимости. Учитывая высокий уровень стресса, социальное давление и быстрое развитие мегаполиса, люди часто оказываются в сложных ситуациях, связанных с алкогольной или наркотической зависимостью. В таких случаях своевременная помощь квалифицированного нарколога становится не просто желательной, а жизненно необходимой.
Подробнее – вызов нарколога на дом красноярск
Если узнаёте подобные признаки у себя или у родственника — не ждите кризиса. Чем быстрее обратиться за профессиональной поддержкой, тем легче вернуть здоровье и гармонию в семью.
Разобраться лучше – lechenie-alkogolizma-korolev5.ru/
Если пациенту требуется постоянный мониторинг или комплексное лечение, мы обеспечиваем круглосуточное пребывание в стационаре. Здесь доступны углублённая диагностика — УЗИ органов брюшной полости, расширенные анализы крови, кардиомониторинг — и коррекция терапии в режиме реального времени. Комфортные палаты, ежедневное наблюдение медсестры и консультации психотерапевта создают условия для быстрого и безопасного выхода из зависимости.
Узнать больше – narkologicheskaya pomoshch ekaterinburg
При прибытии на место вызова квалифицированный врач проводит детальный и всесторонний осмотр пациента, измеряет основные жизненно важные показатели (артериальное давление, пульс, частоту дыхания, температуру тела), тщательно изучает анамнез пациента, собирая информацию о предыдущих заболеваниях, аллергических реакциях и принимаемых лекарственных препаратах, чтобы максимально точно оценить риски и спланировать лечение
Подробнее – https://vyvod-iz-zapoya-arkhangelsk66.ru/vyvod-iz-zapoya-na-domu-arkhangelsk
С увеличением темпа жизни и нарастающим стрессом, многие люди в Екатеринбурге сталкиваются с зависимостями, особенно с алкогольной. Алкогольная зависимость является одной из наиболее распространённых проблем, требующих немедленного вмешательства специалистов. Важно помнить, что в сложных ситуациях, связанных с зависимостью, помощь не должна откладываться. Вызов нарколога на дом в Екатеринбурге становится идеальным вариантом для тех, кто не может или не хочет покидать свой дом, но нуждается в медицинской помощи.
Получить дополнительные сведения – нарколог на дом екатеринбург
Пациенты клиники «НаркоМед» полностью застрахованы от утечки личной информации. Приём и лечение оформляются по псевдониму, документы не передаются в другие организации.
Изучить вопрос глубже – частная наркологическая клиника екатеринбург
В период восстановления пациент получает психологическую поддержку, работает с психотерапевтом, осваивает навыки самоконтроля, учится противостоять стрессу без возвращения к прежним привычкам. После выписки возможно амбулаторное сопровождение, дистанционные консультации и поддержка для всей семьи.
Ознакомиться с деталями – narkologicheskaya-klinika
Кроме того, врач приедет в любое удобное для пациента время, даже ночью, обеспечив круглосуточный доступ к медицинской помощи. Специалист подбирает индивидуальный состав капельницы, что позволяет оптимально поддержать организм в зависимости от состояния пациента.
Получить дополнительную информацию – врач на дом капельница от запоя екатеринбург
Многодневные алкогольные запои опасны не только для здоровья, но и для жизни. В этот период организм подвергается тяжелейшей интоксикации, страдают сердце, печень, нервная система, а психоэмоциональное состояние может выйти из-под контроля. Самостоятельно выйти из запоя очень трудно и опасно: любое промедление или попытка “перетерпеть” чреваты судорогами, галлюцинациями, инфарктом, тяжелой депрессией или делирием. Именно поэтому своевременное обращение к профессионалам — залог не только скорого, но и безопасного восстановления. В наркологической клинике «НаркоМедцентр» в Балашихе организован современный и медицински обоснованный вывод из запоя: здесь пациентов ждет индивидуальный подход, круглосуточное медицинское наблюдение и полная конфиденциальность.
Изучить вопрос глубже – https://vyvod-iz-zapoya-balashiha5.ru
Алкогольная зависимость — одна из самых распространенных проблем нашего времени, требующая немедленного и грамотного вмешательства. В Екатеринбурге капельница от запоя является одним из самых популярных и действенных методов восстановления после длительного употребления алкоголя. Она помогает организму справиться с интоксикацией, восстанавливает физическое и эмоциональное состояние пациента, улучшает самочувствие в короткие сроки. При этом лечение может быть организовано как в стационаре, так и на дому, в зависимости от удобства пациента.
Получить больше информации – поставить капельницу от запоя в екатеринбурге
В Новокузнецке клиники, специализирующиеся на лечении алкогольной зависимости, работают в соответствии с современными медицинскими протоколами, что обеспечивает максимально быстрый старт необходимой терапии, высокую результативность проводимого лечения и значительное улучшение состояния пациента уже в первые часы после обращения за помощью
Получить больше информации – https://vyvod-iz-zapoya-novokuznetsk66.ru/
Незамедлительно после вызова нарколог прибывает на дом для проведения тщательного осмотра. На данном этапе специалист собирает анамнез, измеряет жизненно важные показатели — пульс, артериальное давление, температуру — и оценивает степень интоксикации. Эти данные являются основой для составления индивидуального плана лечения.
Исследовать вопрос подробнее – http://
Одним из ключевых достоинств выезда нарколога на дом является возможность лечения в привычной для пациента среде, что способствует снижению стресса и ускоряет процесс выздоровления. Кроме того, лечение на дому гарантирует полную анонимность и индивидуальный подход к каждому пациенту.
Выяснить больше – нарколог на дом вывод из запоя иркутск
Алкогольная и наркотическая зависимости могут привести к тяжелым и опасным для жизни состояниям. Вызов нарколога становится необходимым, если:
Подробнее – вызвать нарколога на дом в воронеже
Анализ рынка услуг экстренной помощи в Тюмени позволяет выделить следующие ориентировочные цены:
Подробнее – https://vyvod-iz-zapoya-vladimir00.ru/vyvod-iz-zapoya-na-domu-vladimir/
Клиника «УралМед» работает без выходных и праздников: прием пациентов — круглосуточно. Это позволяет оказывать экстренную помощь при острых состояниях, а также вести наблюдение за динамикой восстановления здоровья в ночные часы.
Углубиться в тему – https://lechenie-alkogolizma-ekaterinburg0.ru/
Лечение на дому начинается с оперативного выезда квалифицированного нарколога, который проводит тщательный первичный осмотр, детально оценивает физическое и эмоциональное состояние пациента, определяет степень алкогольной интоксикации и абстинентного синдрома, а также назначает индивидуальную и персонализированную программу терапии, учитывающую все особенности конкретного случая и направленную на максимально быстрое и безопасное восстановление здоровья
Получить дополнительные сведения – https://narcolog-na-dom-v-irkutske66.ru/narkolog-na-dom-kruglosutochno-irkutsk
Алкогольный запой – это не просто следствие длительного употребления спиртного, а серьёзное состояние, которое требует квалифицированного лечения. В состоянии запоя организм не может самостоятельно очиститься от токсинов, что приводит к нарушению работы внутренних органов, обезвоживанию, резким скачкам давления и серьёзным психоэмоциональным расстройствам.
Получить дополнительную информацию – вывод из запоя на дому кемеровская область
Наркологическая клиника «АнтиДот» предлагает срочный вызов нарколога на дом в Воронеже и Воронежской области. Наша служба экстренной наркологической помощи доступна круглосуточно и позволяет быстро справиться с тяжелыми состояниями, вызванными алкогольной и наркотической зависимостью. Опытные врачи проведут детоксикацию организма, помогут снять абстинентный синдром и стабилизировать общее состояние пациента в комфортных домашних условиях.
Получить дополнительные сведения – vrach-narkolog-na-dom voronezh
Если пациент находится в критическом состоянии, не осознаёт происходящее, проявляет агрессию или, наоборот, впадает в апатию, не стоит ждать — необходимо вызвать нарколога немедленно.
Подробнее можно узнать тут – https://narcolog-na-dom-v-irkutske6.ru/vrach-narkolog-na-dom-irkutsk
Экстренная помощь при выводе из запоя в Архангельске организована по четко отлаженной и многократно проверенной на практике схеме, что позволяет оперативно реагировать на вызовы и оказывать максимально эффективную помощь пациентам в критическом состоянии
Углубиться в тему – http://vyvod-iz-zapoya-arkhangelsk66.ru
Алкогольная зависимость — комплексная проблема, которая нуждается в квалифицированном лечении. В Красноярске функционирует широкая сеть медицинских учреждений, готовых оказать поддержку тем, кто столкнулся с этой проблемой. Вывод из запоя в Красноярске осуществляется как в клинических условиях, так и при выезде специалистов на дом, что дает возможность подобрать оптимальный вариант лечения для каждого пациента.
Ознакомиться с деталями – вывод из запоя на дому круглосуточно в красноярске
Вызов нарколога на дом и круглосуточная поддержка в условиях стационара — ключевая услуга клиники «НаркоЦентр», направленная на оказание экстренной и плановой помощи пациентам с алкогольной и наркотической зависимостью. Мы понимаем, что запой или интоксикация могут развиться внезапно, поэтому врач выезжает в любой район Екатеринбурга и ближайшего подмосковья менее чем за 30 минут. При этом круглосуточное дежурство специалистов позволяет продолжить наблюдение и поддержку в стенах клиники, если домашние условия оказываются недостаточно безопасными или комфортными.
Исследовать вопрос подробнее – наркологическая помощь на дому в екатеринбурге
Далее начинается этап детоксикации — это основа безопасного и эффективного вывода из запоя. Используются капельницы с современными очищающими и поддерживающими препаратами, комплекс витаминов, препараты для поддержки печени, почек и сердечно-сосудистой системы. При необходимости назначаются средства для стабилизации психоэмоционального состояния, купирования судорог, нормализации сна и снижения тревожности.
Получить больше информации – kruglosutochnyj-vyvod-iz-zapoya-balashiha
Распознать необходимость лечения просто: достаточно внимательно отнестись к тревожным признакам. Вот лишь некоторые ситуации, когда обращение в наркологическую клинику становится жизненно важным:
Получить дополнительные сведения – chastnaya-narkologicheskaya-klinika-v-balashihe
Многодневные алкогольные запои опасны не только для здоровья, но и для жизни. В этот период организм подвергается тяжелейшей интоксикации, страдают сердце, печень, нервная система, а психоэмоциональное состояние может выйти из-под контроля. Самостоятельно выйти из запоя очень трудно и опасно: любое промедление или попытка “перетерпеть” чреваты судорогами, галлюцинациями, инфарктом, тяжелой депрессией или делирием. Именно поэтому своевременное обращение к профессионалам — залог не только скорого, но и безопасного восстановления. В наркологической клинике «НаркоМедцентр» в Балашихе организован современный и медицински обоснованный вывод из запоя: здесь пациентов ждет индивидуальный подход, круглосуточное медицинское наблюдение и полная конфиденциальность.
Получить дополнительные сведения – вывод из запоя недорого балашиха
Пациенты клиники «НаркоМед» полностью застрахованы от утечки личной информации. Приём и лечение оформляются по псевдониму, документы не передаются в другие организации.
Разобраться лучше – бесплатная наркологическая клиника в екатеринбурге
Кроме того, анонимность является важной составляющей этой услуги. Лечение дома исключает возможность столкновения с посторонними людьми и помогает пациентам сохранить свою репутацию. Клиника «Гармония и Свет» обеспечивает полную конфиденциальность, предоставляя пациентам возможность получать помощь без лишних вопросов и обсуждений.
Детальнее – вызов нарколога на дом екатеринбург.
Такая услуга доступна круглосуточно, что позволяет вызвать врача в любое время. Профессиональные специалисты, приехав на дом, тщательно подберут состав капельницы с учетом индивидуальных особенностей пациента, чтобы обеспечить максимально эффективное лечение. Анонимность и высокая квалификация медперсонала делают этот способ особенно удобным для людей, которые предпочитают конфиденциальность.
Исследовать вопрос подробнее – капельница от запоя на дому екатеринбург
После первичного осмотра начинается активная фаза детоксикации. Современные препараты вводятся капельничным методом для быстрого снижения уровня токсинов в крови и восстановления обменных процессов. Этот этап критически важен для нормализации работы печени, почек и сердечно-сосудистой системы.
Детальнее – вывод из запоя дешево владимир
Комплексное лечение на дому организовано по строго отлаженной схеме, позволяющей оперативно стабилизировать состояние пациента и провести качественную детоксикацию.
Получить дополнительную информацию – вывод из запоя цены владимир
Алкоголизм — хроническое заболевание, требующее комплексного подхода и круглосуточного контроля. Клиника «УралМед» в Екатеринбурге предлагает полный спектр услуг для пациентов любого уровня зависимости: от экстренной детоксикации до долгосрочной реабилитации. Главные принципы работы — абсолютная анонимность, индивидуальный план лечения и постоянное сопровождение квалифицированной командой специалистов.
Подробнее – клиника лечения алкоголизма екатеринбург
В данной подробной статье максимально детально описываются уникальные и современные методики вывода из запоя, разработанные с учетом последних достижений медицинской науки и направленные на быстрое, эффективное и, что самое главное, безопасное восстановление здоровья в экстренных и неотложных случаях, когда промедление может стоить пациенту жизни
Подробнее можно узнать тут – вывод из запоя архангельской область
В таких случаях своевременное обращение за помощью позволяет быстро стабилизировать состояние и предотвратить развитие серьезных осложнений.
Подробнее можно узнать тут – http://narcolog-na-dom-voronezh0.ru/vyzov-narkologa-na-dom-voronezh/
Есть ситуации, когда дальнейшее промедление может привести к необратимым последствиям:
Ознакомиться с деталями – http://www.domen.ru
Если у пациента выраженная интоксикация, судороги, хронические заболевания, лучше выбрать стационарный формат. Здесь гарантированы круглосуточное медицинское наблюдение, возможность быстрого реагирования на любые изменения состояния, консультации узких специалистов. Для пациентов созданы комфортные условия проживания, организовано индивидуальное питание, действует поддержка психолога.
Углубиться в тему – нарколог вывод из запоя
Одним из ключевых и неоспоримых достоинств выезда квалифицированного нарколога на дом является уникальная возможность проведения лечения в привычной и безопасной для пациента среде, что способствует значительному снижению уровня стресса и тревожности, ускоряет естественный процесс выздоровления и повышает общую эффективность проводимой терапии, создавая атмосферу доверия и поддержки
Узнать больше – http://narcolog-na-dom-v-irkutske66.ru/narkolog-na-dom-czena-irkutsk
После поступления звонка нарколог оперативно выезжает по указанному адресу и прибывает в течение 30–60 минут. Врач незамедлительно приступает к оказанию помощи по четко отработанному алгоритму, состоящему из следующих этапов:
Получить дополнительную информацию – [url=https://narcolog-na-dom-voronezh00.ru/]выезд нарколога на дом воронеж[/url]
Первичный этап заключается в оценке состояния пациента и быстром подборе схемы инфузионной терапии. Врач фиксирует показания ЭКГ, сатурацию кислорода и биохимический параметр глюкозы в крови. После этого подключается капельница с раствором для выведения продуктов распада алкоголя и одновременной коррекции показателей обмена веществ. Последующие визиты врача позволяют скорректировать терапию и предотвратить развитие побочных реакций.
Изучить вопрос глубже – наркологическая помощь на дому екатеринбург
Лечение проводится непосредственно в домашних условиях, что позволяет избежать стресса, связанного с пребыванием в стационаре. Применение современных медикаментов и индивидуальный подход к выбору терапии обеспечивают безопасность и эффективность процедуры.
Узнать больше – запой нарколог на дом иркутск
Медикаментозное лечение — это еще один важный этап. Оно включает использование препаратов, которые помогают пациенту восстановиться как физически, так и психологически. Нарколог контролирует процесс лечения, чтобы исключить побочные эффекты и скорректировать терапию при необходимости.
Ознакомиться с деталями – вызов нарколога на дом в красноярске
Выбирая лечение в «Наркосфере», пациенты Балашихи и Балашихинского района могут быть уверены в высоком качестве услуг и современном подходе. Здесь применяют только сертифицированные препараты, используются новейшие методы терапии и реабилитации. Клиника работает круглосуточно, принимает пациентов в любой день недели и всегда готова к экстренному реагированию. Индивидуальный подход проявляется не только в подборе схемы лечения, но и в поддержке семьи на каждом этапе выздоровления. Весь процесс проходит в обстановке полной конфиденциальности: сведения о пациентах не передаются в сторонние организации, не оформляется наркологический учёт.
Ознакомиться с деталями – narkologicheskaya-klinika-dlya-podrostkov
Многодневные алкогольные запои опасны не только для здоровья, но и для жизни. В этот период организм подвергается тяжелейшей интоксикации, страдают сердце, печень, нервная система, а психоэмоциональное состояние может выйти из-под контроля. Самостоятельно выйти из запоя очень трудно и опасно: любое промедление или попытка “перетерпеть” чреваты судорогами, галлюцинациями, инфарктом, тяжелой депрессией или делирием. Именно поэтому своевременное обращение к профессионалам — залог не только скорого, но и безопасного восстановления. В наркологической клинике «НаркоМедцентр» в Балашихе организован современный и медицински обоснованный вывод из запоя: здесь пациентов ждет индивидуальный подход, круглосуточное медицинское наблюдение и полная конфиденциальность.
Подробнее – вывод из запоя
Пациенты клиники «НаркоМед» полностью застрахованы от утечки личной информации. Приём и лечение оформляются по псевдониму, документы не передаются в другие организации.
Получить дополнительную информацию – частная наркологическая клиника свердловская область
Алкогольная зависимость — одна из самых распространенных проблем нашего времени, требующая немедленного и грамотного вмешательства. В Екатеринбурге капельница от запоя является одним из самых популярных и действенных методов восстановления после длительного употребления алкоголя. Она помогает организму справиться с интоксикацией, восстанавливает физическое и эмоциональное состояние пациента, улучшает самочувствие в короткие сроки. При этом лечение может быть организовано как в стационаре, так и на дому, в зависимости от удобства пациента.
Ознакомиться с деталями – капельница от запоя цена в екатеринбурге
Запой и алкогольная интоксикация – это состояния, при которых организм уже не способен самостоятельно справиться с токсинами. Попытки выйти из запоя без медицинского вмешательства могут привести к серьёзным осложнениям, таким как скачки давления, судороги, галлюцинации и даже алкогольный психоз.
Подробнее можно узнать тут – вызов врача нарколога на дом иркутск
Как помогает организму
Получить дополнительную информацию – http://vyvod-iz-zapoya-novokuznetsk6.ru/vyvod-iz-zapoya-nedorogo-novokuzneczk/https://vyvod-iz-zapoya-novokuznetsk6.ru
Когда пациент решает обратиться за помощью к наркологу на дом, ему предстоит пройти ряд этапов лечения, каждый из которых будет направлен на устранение последствий алкоголизма. Врач проведет первичный осмотр, выслушает жалобы пациента и на основе собранной информации начнёт индивидуальную программу лечения.
Получить дополнительные сведения – https://narcolog-na-dom-ektb55.ru/
При сильной интоксикации требуется полное очищение организма от токсинов. Детоксикация помогает нормализовать работу внутренних органов, улучшить общее состояние пациента и восстановить баланс жидкостей в организме. Специалист использует современные препараты, включая электролиты, глюкозу и антиоксиданты, для безопасного и эффективного очищения организма.
Подробнее можно узнать тут – запой нарколог на дом в красноярске
При прибытии на место вызова квалифицированный врач проводит детальный и всесторонний осмотр пациента, измеряет основные жизненно важные показатели (артериальное давление, пульс, частоту дыхания, температуру тела), тщательно изучает анамнез пациента, собирая информацию о предыдущих заболеваниях, аллергических реакциях и принимаемых лекарственных препаратах, чтобы максимально точно оценить риски и спланировать лечение
Подробнее можно узнать тут – вывести из запоя
При вызовах в ночное время или в случаях с тяжелой интоксикацией стоимость может увеличиваться до 3000–4500 рублей. Окончательная сумма определяется после первичного осмотра и обсуждения индивидуальной схемы лечения с пациентом.
Разобраться лучше – https://vyvod-iz-zapoya-vladimir00.ru/vyvod-iz-zapoya-anonimno-vladimir/
После первичного осмотра начинается активная фаза детоксикации. Современные препараты вводятся капельничным методом для быстрого снижения уровня токсинов в крови и восстановления обменных процессов. Этот этап критически важен для нормализации работы печени, почек и сердечно-сосудистой системы.
Получить дополнительную информацию – https://vyvod-iz-zapoya-vladimir000.ru/vyvod-iz-zapoya-anonimno-vladimir/
После диагностики выявленные нарушения восполняются посредством инфузий с витаминами группы B, C, магнием и элементами.
Изучить вопрос глубже – http://lechenie-alkogolizma-ekaterinburg0.ru
В таких случаях своевременное обращение за помощью позволяет быстро стабилизировать состояние и предотвратить развитие серьезных осложнений.
Выяснить больше – вызвать нарколога на дом воронеж
Запой – это острое и крайне опасное состояние, характеризующееся полной и неконтролируемой утратой способности регулировать потребление алкоголя, что с высокой вероятностью может привести к серьезным и даже потенциально смертельным последствиям для здоровья, поражая практически все жизненно важные органы и системы организма, от нервной и сердечно-сосудистой до пищеварительной и эндокринной
Узнать больше – вызов нарколога на дом иркутск
Если пациенту требуется постоянный мониторинг или комплексное лечение, мы обеспечиваем круглосуточное пребывание в стационаре. Здесь доступны углублённая диагностика — УЗИ органов брюшной полости, расширенные анализы крови, кардиомониторинг — и коррекция терапии в режиме реального времени. Комфортные палаты, ежедневное наблюдение медсестры и консультации психотерапевта создают условия для быстрого и безопасного выхода из зависимости.
Выяснить больше – наркологическая клиника клиника помощь
Далее начинается этап детоксикации — это основа безопасного и эффективного вывода из запоя. Используются капельницы с современными очищающими и поддерживающими препаратами, комплекс витаминов, препараты для поддержки печени, почек и сердечно-сосудистой системы. При необходимости назначаются средства для стабилизации психоэмоционального состояния, купирования судорог, нормализации сна и снижения тревожности.
Подробнее тут – нарколог вывод из запоя
Чем раньше начато лечение, тем выше вероятность полного восстановления здоровья без тяжёлых последствий для организма и психики. В клинике «Наркосфера» к каждому случаю подходят максимально внимательно и индивидуально.
Ознакомиться с деталями – https://narkologicheskaya-klinika-balashiha5.ru/
Кроме того, врач приедет в любое удобное для пациента время, даже ночью, обеспечив круглосуточный доступ к медицинской помощи. Специалист подбирает индивидуальный состав капельницы, что позволяет оптимально поддержать организм в зависимости от состояния пациента.
Углубиться в тему – https://kapelnica-ot-zapoya-ektb55.ru/kapelnicza-na-domu-ekaterinburg-ot-zapoya/
Наркологическая клиника «АнтиДот» предлагает срочный вызов нарколога на дом в Воронеже и Воронежской области. Наша служба экстренной наркологической помощи доступна круглосуточно и позволяет быстро справиться с тяжелыми состояниями, вызванными алкогольной и наркотической зависимостью. Опытные врачи проведут детоксикацию организма, помогут снять абстинентный синдром и стабилизировать общее состояние пациента в комфортных домашних условиях.
Разобраться лучше – вызвать нарколога на дом
Многодневные алкогольные запои опасны не только для здоровья, но и для жизни. В этот период организм подвергается тяжелейшей интоксикации, страдают сердце, печень, нервная система, а психоэмоциональное состояние может выйти из-под контроля. Самостоятельно выйти из запоя очень трудно и опасно: любое промедление или попытка “перетерпеть” чреваты судорогами, галлюцинациями, инфарктом, тяжелой депрессией или делирием. Именно поэтому своевременное обращение к профессионалам — залог не только скорого, но и безопасного восстановления. В наркологической клинике «НаркоМедцентр» в Балашихе организован современный и медицински обоснованный вывод из запоя: здесь пациентов ждет индивидуальный подход, круглосуточное медицинское наблюдение и полная конфиденциальность.
Исследовать вопрос подробнее – вывод из алкогольного запоя
Алкогольная зависимость — комплексная проблема, которая нуждается в квалифицированном лечении. В Красноярске функционирует широкая сеть медицинских учреждений, готовых оказать поддержку тем, кто столкнулся с этой проблемой. Вывод из запоя в Красноярске осуществляется как в клинических условиях, так и при выезде специалистов на дом, что дает возможность подобрать оптимальный вариант лечения для каждого пациента.
Выяснить больше – http://www.domen.ru
Алкогольная зависимость — одна из самых распространенных проблем нашего времени, требующая немедленного и грамотного вмешательства. В Екатеринбурге капельница от запоя является одним из самых популярных и действенных методов восстановления после длительного употребления алкоголя. Она помогает организму справиться с интоксикацией, восстанавливает физическое и эмоциональное состояние пациента, улучшает самочувствие в короткие сроки. При этом лечение может быть организовано как в стационаре, так и на дому, в зависимости от удобства пациента.
Изучить вопрос глубже – kapelnicza-ot-zapoya-na-domu ekaterinburg
Выездной формат позволяет избежать контактов с другими пациентами в клинике и очистить организм в привычной обстановке. Специалисты самостоятельно привозят весь необходимый набор медикаментов и расходных материалов.
Подробнее – частная наркологическая клиника екатеринбург.
В Архангельске, в условиях, когда каждая минута на счету, экстренная медицинская помощь становится особенно актуальной, и специализированные службы, укомплектованные опытными и квалифицированными специалистами, готовы оперативно вмешаться для стабилизации критического состояния пациента и предотвращения непоправимых последствий для его здоровья
Разобраться лучше – вывод из запоя цены архангельск
В рамках детоксикации применяются капельничные инфузии, содержащие необходимые электролиты, витамины и современные препараты, позволяющие эффективно очистить кровь, а постоянный и тщательный контроль жизненных показателей пациента обеспечивает максимальную безопасность проводимой процедуры и позволяет оперативно корректировать дозировку лекарственных средств по мере необходимости, учитывая индивидуальные особенности организма и реакцию на терапию.
Получить дополнительные сведения – https://vyvod-iz-zapoya-novokuznetsk66.ru/narkologiya-vyvod-iz-zapoya-novokuzneczk
В обычных условиях цена услуги составляет от 1500 до 2500 рублей. Эта сумма включает выезд специалиста, первичный осмотр и базовую детоксикационную терапию.
Получить дополнительную информацию – анонимный вывод из запоя владимир
Кроме того, анонимность является важной составляющей этой услуги. Лечение дома исключает возможность столкновения с посторонними людьми и помогает пациентам сохранить свою репутацию. Клиника «Гармония и Свет» обеспечивает полную конфиденциальность, предоставляя пациентам возможность получать помощь без лишних вопросов и обсуждений.
Получить дополнительные сведения – вызов нарколога на дом екатеринбург
Если узнаёте подобные признаки у себя или у родственника — не ждите кризиса. Чем быстрее обратиться за профессиональной поддержкой, тем легче вернуть здоровье и гармонию в семью.
Подробнее тут – lechenie-alkogolizma-korolev
После первичного осмотра начинается активная фаза детоксикации. Современные препараты вводятся капельничным методом для быстрого снижения уровня токсинов в крови и восстановления обменных процессов. Этот этап критически важен для нормализации работы печени, почек и сердечно-сосудистой системы.
Подробнее – vyvod-iz-zapoya-vladimir000.ru/
Срочный вызов нарколога необходим, если:
Детальнее – вызов нарколога на дом иркутск
После обращения по телефону или через сайт диспетчер уточняет адрес и состояние пациента. В экстренных случаях команда врачей может прибыть уже в течение 60 минут, обычно — за 1–2 часа. На месте проводится первичный осмотр: проверяются жизненные показатели, уточняется история употребления, сопутствующие заболевания. Врач определяет наиболее безопасную и эффективную тактику, исходя из возраста, состояния здоровья и длительности запоя.
Ознакомиться с деталями – vyvod-iz-zapoya-noginsk
Вызов специалиста на дом рекомендуется, если запой затягивается и самостоятельное прекращение пьянства становится невозможным. Своевременное обращение помогает предотвратить ухудшение состояния, развитие хронических осложнений и негативное воздействие на психику.
Выяснить больше – врач нарколог на дом иркутск.
Если пациенту требуется постоянный мониторинг или комплексное лечение, мы обеспечиваем круглосуточное пребывание в стационаре. Здесь доступны углублённая диагностика — УЗИ органов брюшной полости, расширенные анализы крови, кардиомониторинг — и коррекция терапии в режиме реального времени. Комфортные палаты, ежедневное наблюдение медсестры и консультации психотерапевта создают условия для быстрого и безопасного выхода из зависимости.
Узнать больше – наркологическая помощь на дому екатеринбург
В таких случаях своевременное обращение за помощью позволяет быстро стабилизировать состояние и предотвратить развитие серьезных осложнений.
Получить дополнительную информацию – https://narcolog-na-dom-voronezh0.ru/
Вызов квалифицированного специалиста-нарколога на дом настоятельно рекомендуется в тех случаях, когда запой затягивается на длительное время, становится особенно тяжелым и мучительным, а самостоятельное прекращение употребления алкоголя становится практически невозможным из-за сильной физической и психологической зависимости
Выяснить больше – http://narcolog-na-dom-v-irkutske66.ru
На первом этапе проводится осмотр: врач измеряет давление, пульс, уровень кислорода, температуру тела, оценивает общее состояние, собирает анамнез и анализирует возможные сопутствующие заболевания. При необходимости пациент проходит экспресс-диагностику, включая лабораторные анализы, ЭКГ и консультации других специалистов (кардиолога, невролога).
Узнать больше – вывод из длительного запоя
Каждый пациент получает индивидуально разработанную схему терапии, которая включает комплексное воздействие на организм:
Ознакомиться с деталями – http://vyvod-iz-zapoya-novokuznetsk6.ru
Чем раньше начато лечение, тем выше вероятность полного восстановления здоровья без тяжёлых последствий для организма и психики. В клинике «Наркосфера» к каждому случаю подходят максимально внимательно и индивидуально.
Подробнее можно узнать тут – platnaya-narkologicheskaya-klinika
В таких критических условиях время становится самым ценным и решающим фактором, поэтому оперативный вывод из запоя позволяет не только остановить дальнейшее ухудшение состояния, но и значительно снизить вероятность возникновения хронических заболеваний, инвалидизации и даже летального исхода, обеспечивая пациенту шанс на полноценное выздоровление и возвращение к нормальной жизни
Исследовать вопрос подробнее – http://vyvod-iz-zapoya-arkhangelsk66.ru/vyvod-iz-zapoya-kruglosutochno-arkhangelsk/
В этой информационной статье вы найдете интересное содержание, которое поможет вам расширить свои знания. Мы предлагаем увлекательный подход и уникальные взгляды на обсуждаемые темы, побуждая пользователей к активному мышлению и критическому анализу.
Получить полную информацию – https://majesticbisonranch.ca/ego-quoque
Этот увлекательный информационный материал подарит вам массу новых знаний и ярких эмоций. Мы собрали для вас интересные факты и сведения, которые обогатят ваш опыт. Откройте для себя увлекательный мир информации и насладитесь процессом изучения!
Обратиться к источнику – https://nexzmediagroup.com/elementor-1385
В этой публикации мы предлагаем подробные объяснения по актуальным вопросам, чтобы помочь читателям глубже понять их. Четкость и структурированность материала сделают его удобным для усвоения и применения в повседневной жизни.
Доступ к полной версии – https://blogmulheres30.com/transformando-seu-espaco-dicas-para-criar-um-lar-que-inspira-paz
Публикация приглашает вас исследовать неизведанное — от древних тайн до современных достижений науки. Вы узнаете, как случайные находки превращались в революции, а смелые мысли — в новые эры человеческого прогресса.
Получить полную информацию – https://bestrobottoys.com/page/5
Публикация приглашает вас исследовать неизведанное — от древних тайн до современных достижений науки. Вы узнаете, как случайные находки превращались в революции, а смелые мысли — в новые эры человеческого прогресса.
Более подробно об этом – https://www.wakeup-radio.com/qtvideo/pon-pon-girl
Мы предлагаем вам подробное руководство, основанное на проверенных источниках и реальных примерах. Каждая часть публикации направлена на то, чтобы помочь вам разобраться в сложных вопросах и применить знания на практике.
Посмотреть подробности – https://lifebnf.bonificaoficial.com/2024/09/25/ola-mundo
Эта статья предлагает живое освещение актуальной темы с множеством интересных фактов. Мы рассмотрим ключевые моменты, которые делают данную тему важной и актуальной. Подготовьтесь к насыщенному путешествию по неизвестным аспектам и узнайте больше о значимых событиях.
Осуществить глубокий анализ – https://avocats-narbonne-am.fr/hello-world
В этой публикации мы предлагаем подробные объяснения по актуальным вопросам, чтобы помочь читателям глубже понять их. Четкость и структурированность материала сделают его удобным для усвоения и применения в повседневной жизни.
Выяснить больше – https://irabordo.ru
Этот информационный материал собраны данные, которые помогут лучше понять текущие тенденции и процессы в различных сферах жизни. Мы предоставляем четкий анализ, графики и примеры, чтобы информация была не только понятной, но и практичной для принятия решений.
Заходи — там интересно – https://bethanyfamilyinstitute.com/high-quality-da-dr-backlinks-high-tf-backlinks-high-traffic-guest-post-website-available-ahrefs-domain-rating-70-moz-domain-authority-1928
Публикация предлагает уникальную подборку информации, которая будет интересна как специалистам, так и широкому кругу читателей. Здесь вы найдете ответы на часто задаваемые вопросы и полезные инсайты для дальнейшего применения.
Почему это важно? – https://clizak.com/drive-traffic-and-convert-leads-with-our-expert-digital
В этой публикации мы предлагаем подробные объяснения по актуальным вопросам, чтобы помочь читателям глубже понять их. Четкость и структурированность материала сделают его удобным для усвоения и применения в повседневной жизни.
Почему это важно? – https://immowert.pl/kontakt-2
Эта статья для ознакомления предлагает читателям общее представление об актуальной теме. Мы стремимся представить ключевые факты и идеи, которые помогут читателям получить представление о предмете и решить, стоит ли углубляться в изучение.
Только для своих – http://malayatours.com/2023/08/21/nurturing-the-bond-between-humans-and-nature
Эта обзорная заметка содержит ключевые моменты и факты по актуальным вопросам. Она поможет читателям быстро ориентироваться в теме и узнать о самых важных аспектах сегодня. Получите краткий курс по современной информации и оставайтесь в курсе событий!
Узнай первым! – https://hadieth.nl/hadith-qudsi-7
Этот увлекательный информационный материал подарит вам массу новых знаний и ярких эмоций. Мы собрали для вас интересные факты и сведения, которые обогатят ваш опыт. Откройте для себя увлекательный мир информации и насладитесь процессом изучения!
Посмотреть подробности – https://highbrow-lowlife.com/uncategorized/2-new-albums-out-by-vanessa-sinclair-pete-murphy
В этой статье вы найдете познавательную и занимательную информацию, которая поможет вам лучше понять мир вокруг. Мы собрали интересные данные, которые вдохновляют на размышления и побуждают к действиям. Открывайте новую информацию и получайте удовольствие от чтения!
Почему это важно? – https://eezyliving.ae/its-time-to-design-your-dream-outdoor-living
Эта публикация дает возможность задействовать различные источники информации и представить их в удобной форме. Читатели смогут быстро найти нужные данные и получить ответы на интересующие их вопросы. Мы стремимся к четкости и доступности материала для всех!
Почему это важно? – https://nexzmediagroup.com/elementor-1385
Эта публикация завернет вас в вихрь увлекательного контента, сбрасывая стереотипы и открывая двери к новым идеям. Каждый абзац станет для вас открытием, полным ярких примеров и впечатляющих достижений. Подготовьтесь быть вовлеченными и удивленными каждый раз, когда продолжите читать.
Только факты! – http://spb2103.ru
В этом информативном тексте представлены захватывающие события и факты, которые заставят вас задуматься. Мы обращаем внимание на важные моменты, которые часто остаются незамеченными, и предлагаем новые перспективы на привычные вещи. Подготовьтесь к тому, чтобы быть поглощенным увлекательными рассказами!
Расширить кругозор по теме – https://sdscollegejadla.com/iqac-meeting-held-on-date-05-11-2022
Этот увлекательный информационный материал подарит вам массу новых знаний и ярких эмоций. Мы собрали для вас интересные факты и сведения, которые обогатят ваш опыт. Откройте для себя увлекательный мир информации и насладитесь процессом изучения!
Ознакомьтесь с аналитикой – https://almontag.com/%D8%A3%D9%81%D8%B6%D9%84-%D8%A3%D9%86%D9%88%D8%A7%D8%B9-%D8%B3%D9%85%D9%83-%D8%A7%D9%84%D8%AA%D9%88%D9%86%D8%A9-%D8%AD%D9%88%D9%84-%D8%A7%D9%84%D8%B9%D8%A7%D9%84%D9%85
Без врачебного контроля организм подвергается чрезмерному стрессу, что может приводить к критическим последствиям. При длительном употреблении алкоголя происходит адаптация физиологических процессов к присутствию этанола, и когда эта поддержка внезапно исчезает, центральная нервная система и внутренние органы реагируют крайне остро.
Подробнее тут – вывод из запоя цена архангельск
Мы предлагаем вам подробное руководство, основанное на проверенных источниках и реальных примерах. Каждая часть публикации направлена на то, чтобы помочь вам разобраться в сложных вопросах и применить знания на практике.
Узнать напрямую – https://bigbeescouts.org/2023/06/22/the-power-of-effective-communication-in-business
Когда пациент решает обратиться за помощью к наркологу на дом, ему предстоит пройти ряд этапов лечения, каждый из которых будет направлен на устранение последствий алкоголизма. Врач проведет первичный осмотр, выслушает жалобы пациента и на основе собранной информации начнёт индивидуальную программу лечения.
Получить дополнительную информацию – http://narcolog-na-dom-ektb55.ru/narkolog-na-dom-ekaterinburg-tseny/
Когда организм на пределе, важна срочная помощь в Ростове-На-Дону — это команда опытных наркологов, которые помогут быстро и мягко выйти из запоя без вреда для здоровья.
Подробнее – вывод из запоя анонимно город ростов-на-дону
Если требуется срочное кодирование или детоксикация, вызов нарколога на дом – лучшее решение в Иркутске. Профессиональный нарколог приедет, оценит состояние, проведет детоксикацию на дому. «ТрезвоМед»: анонимный выезд нарколога 24/7, помощь при отказе от алкоголя. Тяжело бросить пить в одиночку? Обратитесь к наркологу! Главное – быстро оказать помощь при интоксикации, – нарколог Васильев.
Углубиться в тему – http://narcolog-na-dom-v-irkutske0.ru/narkolog-na-dom-czena-irkutsk
Лечение выводится поэтапно, чтобы обеспечить безопасность и максимальную эффективность терапии. Каждый этап продуман и адаптирован под индивидуальные особенности пациента.
Получить дополнительную информацию – частный нарколог на дом красноярск
Самостоятельно выйти из запоя — почти невозможно. В Ростове-На-Дону врачи клиники проводят медикаментозный вывод из запоя с круглосуточным выездом. Доверяйте профессионалам.
Подробнее – нарколог вывод из запоя в ростове-на-дону
Когда следует немедленно обращаться за помощью:
Подробнее тут – вызвать нарколога на дом новокузнецк
Запой – это состояние, когда организм требует постоянного поступления алкоголя для нормальной работы. Запой вызывает накопление вредных веществ, что негативно влияет на органы и иммунную систему. Не пытайтесь самостоятельно избавиться от запоя, это может навредить. Получите квалифицированную помощь на дому от клиники «Семья и Здоровье». Мы быстро приедем и окажем круглосуточную поддержку при запое. Длительное употребление алкоголя опасно для здоровья и жизни. Не ждите, пока станет слишком поздно, обратитесь за помощью при запое!
Разобраться лучше – http://vyvod-iz-zapoya-krasnoyarsk0.ru
Затяжной запой опасен для жизни. Врачи наркологической клиники в Ростове-На-Дону проводят срочный вывод из запоя — на дому или в стационаре. Анонимно, безопасно, круглосуточно.
Проверенные методы — узнай сейчас – вывод из запоя анонимно в ростове-на-дону
Каждый день запоя увеличивает риск для жизни. Не рискуйте — специалисты в Ростове-На-Дону приедут на дом и окажут экстренную помощь. Без боли, стресса и ожидания.
Не пропусти важное – вывод из запоя на дому город ростов-на-дону
Кроме того, врач оказывает психологическую поддержку, которая помогает пациенту справиться с чувством тревоги, депрессией и страхом, возникающими на фоне зависимости.
Получить больше информации – https://narcolog-na-dom-v-krasnoyarske55.ru/narkolog-na-dom-krasnoyarsk-tseny
Врач-нарколог проводит комплексное обследование пациента, оценивая степень зависимости и общее состояние организма. В ходе первичного осмотра специалист не только определяет тяжесть алкогольной зависимости, но и выявляет сопутствующие патологии, которые могут повлиять на процесс лечения. Обследование включает лабораторные анализы, электрокардиограмму и другие необходимые диагностические процедуры. Врач тщательно изучает анамнез для выявления возможных противопоказаний к определенным методам терапии. Особое внимание уделяется психологическим аспектам, которые могли способствовать формированию зависимости, что помогает разработать эффективную программу лечения.
Углубиться в тему – http://vyvod-iz-zapoya-krasnoyarsk55.ru/vyvod-iz-zapoya-krasnoyarsk-kruglosutochno/
Красноярск, как и любой крупный город, сталкивается с распространенными проблемами зависимости. Учитывая высокий уровень стресса, социальное давление и быстрое развитие мегаполиса, люди часто оказываются в сложных ситуациях, связанных с алкогольной или наркотической зависимостью. В таких случаях своевременная помощь квалифицированного нарколога становится не просто желательной, а жизненно необходимой.
Изучить вопрос глубже – врач нарколог на дом
Кроме того, врач приедет в любое удобное для пациента время, даже ночью, обеспечив круглосуточный доступ к медицинской помощи. Специалист подбирает индивидуальный состав капельницы, что позволяет оптимально поддержать организм в зависимости от состояния пациента.
Получить больше информации – капельница от запоя вызов
Лечение запоя в клинике «Преодоление» строится на поэтапном подходе, направленном на полное восстановление организма. После первичной диагностики назначается индивидуальная программа, включающая следующие шаги:
Детальнее – http://наркология-помощь.рф/
Специалист уточняет длительность запоя, характер употребляемого алкоголя и наличие сопутствующих заболеваний. Точный сбор данных позволяет оперативно корректировать лечение и выбрать оптимальные методы детоксикации.
Исследовать вопрос подробнее – http://narco-vivod-clean.ru
Клиника «Гармония и Свет» предоставляет качественные услуги нарколога на дому, обеспечивая пациентам комфортное лечение в привычной обстановке. Это позволяет не только своевременно получить квалифицированную помощь, но и сделать процесс лечения максимально непринужденным и анонимным.
Получить дополнительные сведения – нарколог на дом цена екатеринбург
Когда алкогольная зависимость достигает критической стадии, оперативное вмешательство становится жизненно необходимым для спасения здоровья. В Рязани профессиональные наркологи выезжают на дом круглосуточно, чтобы предоставить экстренную помощь при запоях и алкогольной интоксикации. Такой формат лечения позволяет начать детоксикацию в комфортной и привычной обстановке, сохраняя конфиденциальность и обеспечивая индивидуальный подход к каждому пациенту.
Получить больше информации – https://наркология-дома1.рф/narkolog-na-dom-kruglosutochno-ryazan
Длительное употребление алкоголя вызывает острую интоксикацию организма, что может привести к тяжёлым последствиям для здоровья. В таких случаях важно не откладывать лечение, а обратиться за квалифицированной медицинской помощью.
Подробнее тут – http://наркология-дома.рф
Каждый день запоя увеличивает риск для жизни. Не рискуйте — специалисты в Ростове-На-Дону приедут на дом и окажут экстренную помощь. Без боли, стресса и ожидания.
Проверенные методы — узнай сейчас – вывод из запоя на дому круглосуточно в ростове-на-дону
Особую опасность представляет белая горячка (алкогольный психоз). У пациента возникают галлюцинации, приступы паники, агрессивное поведение, дезориентация во времени и пространстве. Это состояние требует незамедлительного вмешательства врача, так как человек может представлять опасность для себя и окружающих.
Углубиться в тему – нарколог на дом круглосуточно новокузнецк
Лечение проводится в комфортных домашних условиях, что снижает стресс и помогает быстрее восстановиться.
Получить больше информации – http://vyvod-iz-zapoya-novosibirsk00.ru/
Если требуется срочное кодирование или детоксикация, вызов нарколога на дом – лучшее решение в Иркутске. Профессиональный нарколог приедет, оценит состояние, проведет детоксикацию на дому. «ТрезвоМед»: анонимный выезд нарколога 24/7, помощь при отказе от алкоголя. Тяжело бросить пить в одиночку? Обратитесь к наркологу! Главное – быстро оказать помощь при интоксикации, – нарколог Васильев.
Углубиться в тему – narkolog na dom irkutsk
Запой – это не просто пьянство, а состояние, когда организм становится зависимым от алкоголя. Накопление токсинов приводит к сбоям в работе органов и ослаблению защиты организма. Самостоятельный выход из запоя может быть опасен и только усугубить состояние. Мы предлагаем лечение запоя на дому, чтобы избежать больницы и создать комфорт. Наши специалисты быстро приедут к вам и окажут всю необходимую помощь круглосуточно. Запой приводит к серьезным проблемам со здоровьем, ухудшает качество жизни и угрожает жизни. Очень важно вовремя обратиться за помощью, чтобы избежать необратимых последствий.
Получить дополнительную информацию – нарколог на дом вывод из запоя красноярск
Запой может быть не только физически тяжёлым, но и психологически разрушительным. Поэтому важно вовремя обратиться за помощью. Вывод из запоя в Нижнем Новгороде — это необходимая медицинская процедура, которая помогает победить алкогольную зависимость и восстановить здоровье. Мы в клинике «АнтиЗависимость» предлагаем круглосуточную помощь в комфортных условиях — на дому или в стационаре.
Детальнее – https://narcolog-na-dom-novokuznetsk0.ru/narkolog-na-dom-klinika-novokuzneczk/
Когда организм на пределе, важна срочная помощь в Ростове-На-Дону — это команда опытных наркологов, которые помогут быстро и мягко выйти из запоя без вреда для здоровья.
Познакомиться с результатами исследований – ростов-на-дону.
В Ростове-На-Дону решение есть — наркологическая клиника. Здесь помогают людям выйти из запоя без страха и осуждения. Всё анонимно, грамотно и с заботой о каждом пациенте.
Изучите внимательнее – срочный вывод из запоя город ростов-на-дону
Процедура занимает от 1,5 до 3 часов, после чего пациент остаётся под наблюдением для оценки эффективности лечения.
Подробнее тут – https://наркология-помощь.рф
Затяжной запой опасен для жизни. Врачи наркологической клиники в Ростове-На-Дону проводят срочный вывод из запоя — на дому или в стационаре. Анонимно, безопасно, круглосуточно.
Подробнее – vyvod-iz-zapoya-na-domu rostov-na-donu
Как правило, для эффективного устранения токсинов из организма и восстановления нормального функционирования всех органов и систем, назначаются специальные препараты. К таким препаратам относятся растворы для восстановления водно-солевого баланса, витамины и медикаменты для поддержания нормальной работы печени, а также препараты, стабилизирующие психоэмоциональное состояние пациента.
Ознакомиться с деталями – vrach-narkolog-na-dom ekaterinburg
Этот формат позволяет пациентам получить профессиональную помощь в комфортной домашней обстановке. Такой подход не только обеспечивает удобство, но и гарантирует конфиденциальность, что особенно важно для многих людей.
Исследовать вопрос подробнее – нарколог на дом вывод в красноярске
Процесс лечения организован по отлаженной схеме, которая включает несколько последовательных этапов для быстрого и безопасного вывода из запоя:
Ознакомиться с деталями – вывод из запоя на дому цена в санкт-петербурге
В такой момент человеку нужна не просто поддержка — ему нужна медицинская помощь. В Электростали её оказывает наркологическая клиника «Трезвый Исток». Мы работаем круглосуточно, без праздников и выходных. И выезжаем сразу — без очередей, без лишней бюрократии. Только быстрый, грамотный и безопасный вывод из запоя — на дому или в стационаре, в зависимости от состояния пациента.
Изучить вопрос глубже – vyvod-iz-zapoya-na-domu-cena
Помощь нужна, если:
Получить дополнительные сведения – vyvod-iz-zapoya
Мы рекомендуем рассмотреть кодирование, если:
Разобраться лучше – https://kodirovanie-ot-alkogolizma-shchelkovo3.ru
Заключительная фаза реабилитации фокусируется на обучении пациента жизни без алкоголизма и развитии навыков преодоления жизненных трудностей естественным путем. В рамках этого этапа пациенты активно участвуют в специализированных программах, нацеленных на восстановление утраченных социальных связей и профессиональных компетенций. Программа включает трудотерапию, образовательные курсы и тематические семинары. Особое внимание уделяется работе с семьей: родственники проходят специальное обучение, помогающее им лучше понимать особенности зависимости быстро и эффективно оказывать поддержку близкому человеку.
Подробнее – вывод из запоя анонимно
Когда алкогольная зависимость достигает критической стадии, оперативное вмешательство становится жизненно необходимым для спасения здоровья. В Рязани профессиональные наркологи выезжают на дом круглосуточно, чтобы предоставить экстренную помощь при запоях и алкогольной интоксикации. Такой формат лечения позволяет начать детоксикацию в комфортной и привычной обстановке, сохраняя конфиденциальность и обеспечивая индивидуальный подход к каждому пациенту.
Получить дополнительную информацию – http://наркология-дома1.рф
Когда организм на пределе, важна срочная помощь в Коломне — это команда опытных наркологов, которые помогут быстро и мягко выйти из запоя без вреда для здоровья.
Разобраться лучше – капельница от запоя анонимно в коломне
Когда организм насыщен токсинами, нормальное функционирование органов нарушается. Капельница помогает быстро очистить кровь, восстановить клетки печени и улучшить общее состояние пациента, чтобы как можно быстрее вернуться к привычному уровню жизни.
Ознакомиться с деталями – после капельницы от запоя в екатеринбурге
В Коломне решение есть — наркологическая клиника. Здесь помогают людям выйти из запоя без страха и осуждения. Всё анонимно, грамотно и с заботой о каждом пациенте.
Выяснить больше – https://kapelnica-ot-zapoya-kolomna.ru/
В Ростове-На-Дону решение есть — наркологическая клиника. Здесь помогают людям выйти из запоя без страха и осуждения. Всё анонимно, грамотно и с заботой о каждом пациенте.
Прочитать подробнее – вывод из запоя анонимно в ростове-на-дону
Запой может быть не только физически тяжёлым, но и психологически разрушительным. Поэтому важно вовремя обратиться за помощью. Вывод из запоя в Нижнем Новгороде — это необходимая медицинская процедура, которая помогает победить алкогольную зависимость и восстановить здоровье. Мы в клинике «АнтиЗависимость» предлагаем круглосуточную помощь в комфортных условиях — на дому или в стационаре.
Детальнее – запой нарколог на дом новокузнецк
Запой не проходит самостоятельно, и если он длится несколько дней, организм начинает страдать от накопления токсинов. В этом случае необходимо немедленно обратиться за помощью к профессионалам, чтобы предотвратить развитие опасных осложнений.
Разобраться лучше – http://наркология-помощь.рф/vyvod-iz-zapoya-klinika-rostov-na-donu/
Экстренный вызов нарколога на дом в Иркутске от «ТрезвоМед» при запое, интоксикации или кодировании – анонимно и удобно. Осмотр, детоксикация капельницей, индивидуальный план лечения – все это на дому! «ТрезвоМед» – круглосуточная помощь, анонимность и безопасность при отказе от алкоголя. Не можете бросить пить самостоятельно? Нужна помощь нарколога! Васильев: «Своевременная помощь при интоксикации – залог успешного выздоровления».
Узнать больше – нарколог на дом в иркутске
С увеличением темпа жизни и нарастающим стрессом, многие люди в Екатеринбурге сталкиваются с зависимостями, особенно с алкогольной. Алкогольная зависимость является одной из наиболее распространённых проблем, требующих немедленного вмешательства специалистов. Важно помнить, что в сложных ситуациях, связанных с зависимостью, помощь не должна откладываться. Вызов нарколога на дом в Екатеринбурге становится идеальным вариантом для тех, кто не может или не хочет покидать свой дом, но нуждается в медицинской помощи.
Углубиться в тему – вызвать нарколога на дом екатеринбург
Затяжной запой опасен для жизни. Врачи наркологической клиники в Коломне проводят срочный вывод из запоя — на дому или в стационаре. Анонимно, безопасно, круглосуточно.
Получить больше информации – вызвать капельницу от запоя на дому в коломне
Каждый день запоя увеличивает риск для жизни. Не рискуйте — специалисты в Коломне приедут на дом и окажут экстренную помощь. Без боли, стресса и ожидания.
Детальнее – капельница от запоя наркология в коломне
Запой – это состояние, когда организм требует постоянного поступления алкоголя для нормальной работы. Запой вызывает накопление вредных веществ, что негативно влияет на органы и иммунную систему. Не пытайтесь самостоятельно избавиться от запоя, это может навредить. Получите квалифицированную помощь на дому от клиники «Семья и Здоровье». Мы быстро приедем и окажем круглосуточную поддержку при запое. Длительное употребление алкоголя опасно для здоровья и жизни. Не ждите, пока станет слишком поздно, обратитесь за помощью при запое!
Исследовать вопрос подробнее – вывод из запоя в красноярске
Обратившись к нам, вы получите анонимное и безопасное лечение, полностью соответствующее медицинским стандартам.
Детальнее – нарколог на дом круглосуточно новокузнецк
При сильной интоксикации требуется полное очищение организма от токсинов. Детоксикация помогает нормализовать работу внутренних органов, улучшить общее состояние пациента и восстановить баланс жидкостей в организме. Специалист использует современные препараты, включая электролиты, глюкозу и антиоксиданты, для безопасного и эффективного очищения организма.
Исследовать вопрос подробнее – запой нарколог на дом
Близкий человек в запое? Не ждите ухудшения. Обратитесь в клинику — здесь проведут профессиональный вывод из запоя с последующим восстановлением организма.
Познакомиться с результатами исследований – vyvod-iz-zapoya-klinika rostov-na-donu
Основной этап – введение внутривенной капельницы с специально разработанными растворами. Эти растворы содержат электролиты, витамины и активные компоненты, способствующие быстрому выведению токсинов, восстановлению водно-солевого баланса и улучшению обмена веществ. Детоксикация позволяет снизить концентрацию алкоголя в крови, уменьшить симптомы абстиненции и подготовить организм к последующим этапам терапии.
Узнать больше – нарколог на дом красноярск
Когда организм на пределе, важна срочная помощь в Ростове-На-Дону — это команда опытных наркологов, которые помогут быстро и мягко выйти из запоя без вреда для здоровья.
Как это работает — подробно – вывод из запоя цена ростовская область
Действие и назначение
Детальнее – вывод из запоя на дому круглосуточно в новосибирске
В зависимости от состояния пациента мы предлагаем два формата помощи: выезд нарколога на дом или госпитализацию в стационар. Оба варианта включают детоксикацию — выведение токсинов из организма с помощью инфузионной терапии (капельницы), а также медикаментозную поддержку: успокоительные, витамины, препараты для печени и сердца.
Выяснить больше – анонимный вывод из запоя
Пожалуй, самый распространённый миф — что если просто не пить сутки-двое, то всё наладится. Но если человек длительное время находился в состоянии опьянения, его тело уже адаптировалось к токсичной среде. Резкий отказ без медицинской помощи может привести к судорогам, галлюцинациям, тяжёлой бессоннице, паническим атакам и скачкам давления. Человек буквально «сгорает» изнутри — от собственного обмена веществ, который не справляется с последствиями интоксикации.
Узнать больше – vyvod-iz-zapoya-ehlektrostal3.ru/
Мы рекомендуем рассмотреть кодирование, если:
Подробнее тут – анонимное кодирование от алкоголизма
Процесс лечения организован по отлаженной схеме, которая включает несколько последовательных этапов для быстрого и безопасного вывода из запоя:
Изучить вопрос глубже – вывод из запоя ленинградская область
Когда организм на пределе, важна срочная помощь в Ростове-На-Дону — это команда опытных наркологов, которые помогут быстро и мягко выйти из запоя без вреда для здоровья.
Слушай внимательно — тут важно – вывод из запоя капельница в ростове-на-дону
С увеличением темпа жизни и нарастающим стрессом, многие люди в Екатеринбурге сталкиваются с зависимостями, особенно с алкогольной. Алкогольная зависимость является одной из наиболее распространённых проблем, требующих немедленного вмешательства специалистов. Важно помнить, что в сложных ситуациях, связанных с зависимостью, помощь не должна откладываться. Вызов нарколога на дом в Екатеринбурге становится идеальным вариантом для тех, кто не может или не хочет покидать свой дом, но нуждается в медицинской помощи.
Исследовать вопрос подробнее – вызвать нарколога на дом
Лечение запоя в клинике «Преодоление» строится на поэтапном подходе, направленном на полное восстановление организма. После первичной диагностики назначается индивидуальная программа, включающая следующие шаги:
Получить больше информации – https://наркология-помощь.рф/vyvod-iz-zapoya-anonimno-rostov-na-donu
Близкий человек в запое? Не ждите ухудшения. Обратитесь в клинику — здесь проведут профессиональный вывод из запоя с последующим восстановлением организма.
Раскрыть тему полностью – vyvod-iz-zapoya-na-domu rostov-na-donu
Запой может быть не только физически тяжёлым, но и психологически разрушительным. Поэтому важно вовремя обратиться за помощью. Вывод из запоя в Нижнем Новгороде — это необходимая медицинская процедура, которая помогает победить алкогольную зависимость и восстановить здоровье. Мы в клинике «АнтиЗависимость» предлагаем круглосуточную помощь в комфортных условиях — на дому или в стационаре.
Исследовать вопрос подробнее – вызвать нарколога на дом
Запой – это неконтролируемое употребление алкоголя, которое приводит к серьезным последствиям. Алкогольное отравление организма приводит к серьезным проблемам со здоровьем. Выходить из запоя самостоятельно – рискованно и неэффективно. Мы предлагаем помощь при запое на дому, в привычных для вас условиях. Круглосуточная помощь при запое с выездом на дом за 30-60 минут. Длительный запой разрушает организм и может быть смертельным. Чем раньше вы обратитесь за помощью, тем больше шансов на выздоровление.
Узнать больше – https://vyvod-iz-zapoya-krasnoyarsk0.ru/vyvod-iz-zapoya-kruglosutochno-krasnoyarsk
Нужна срочная помощь при алкогольном отравлении или запое? Вызовите нарколога на дом в Иркутске! Квалифицированная помощь нарколога на дому: диагностика, капельница, стабилизация состояния. Круглосуточный выезд нарколога, анонимность и снижение рисков – с «ТрезвоМед». Самостоятельный отказ невозможен? Необходима наркологическая помощь. Васильев: «Не затягивайте с помощью при алкогольном отравлении!».
Получить дополнительные сведения – выезд нарколога на дом цена иркутск
– человек не может прекратить употребление сам; – наблюдается агрессия, страх, паника, бессвязная речь; – нарушен сон, отсутствует аппетит, сильная слабость; – алкоголь стал способом снятия боли или тревоги; – попытки отказа приводят к ухудшению состояния.
Углубиться в тему – pomoshch-vyvod-iz-zapoya
В Ростове-На-Дону решение есть — наркологическая клиника. Здесь помогают людям выйти из запоя без страха и осуждения. Всё анонимно, грамотно и с заботой о каждом пациенте.
Изучите внимательнее – вывод из запоя на дому ростовская область
Перед началом кодирования важно провести комплексную диагностику. Врачи клиники оценивают общее состояние пациента, определяют степень зависимости, выявляют противопоказания к медикаментозным препаратам, уточняют психоэмоциональный фон. На этом этапе важно, чтобы пациент был трезв — либо как минимум 2–3 дня без алкоголя, либо прошёл процедуру детоксикации в нашей клинике или дома под наблюдением.
Подробнее тут – kodirovanie-ot-alkogolizma
Обратившись к нам, вы получите анонимное и безопасное лечение, полностью соответствующее медицинским стандартам.
Выяснить больше – https://narcolog-na-dom-novokuznetsk00.ru/narkolog-lechenie-na-domu-novokuzneczk/
Процесс лечения будет зависеть от состояния пациента и его особенностей. Врач подберёт нужную дозировку и состав препаратов для наиболее эффективного результата.
Подробнее тут – vyzov-narkologa-na-dom ekaterinburg
Длительное злоупотребление алкоголем приводит к накоплению токсинов, нарушению обменных процессов и ухудшению работы внутренних органов. Своевременное вмешательство позволяет снизить риск серьезных осложнений, таких как сердечно-сосудистые заболевания, повреждение печени и почек, а также уменьшить психоэмоциональное напряжение. Экстренный вызов нарколога на дом в Рязани помогает начать лечение на ранних этапах, когда каждая минута имеет значение.
Выяснить больше – http://наркология-дома1.рф/vrach-narkolog-na-dom-ryazan/
При этом внешне он может не подавать тревожных признаков — особенно в первые часы. Вот почему важно не ждать ухудшения. Если вы замечаете, что человек несколько дней подряд пьёт, не может остановиться, начинает путать день с ночью, проявляет тревожность или отказывается от еды — это уже достаточный повод для обращения к врачу.
Разобраться лучше – vyvod-iz-zapoya-s-vyezdom-ehlektrostal
Основной этап – введение внутривенной капельницы с специально разработанными растворами. Эти растворы содержат электролиты, витамины и активные компоненты, способствующие быстрому выведению токсинов, восстановлению водно-солевого баланса и улучшению обмена веществ. Детоксикация позволяет снизить концентрацию алкоголя в крови, уменьшить симптомы абстиненции и подготовить организм к последующим этапам терапии.
Выяснить больше – https://narcolog-na-dom-krasnoyarsk0.ru/narkolog-na-dom-anonimno-krasnoyars
Самостоятельно выйти из запоя — почти невозможно. В Коломне врачи клиники проводят медикаментозный вывод из запоя с круглосуточным выездом. Доверяйте профессионалам.
Получить дополнительную информацию – kapelnicza-ot-zapoya kolomna
Медикаментозное лечение — это еще один важный этап. Оно включает использование препаратов, которые помогают пациенту восстановиться как физически, так и психологически. Нарколог контролирует процесс лечения, чтобы исключить побочные эффекты и скорректировать терапию при необходимости.
Подробнее можно узнать тут – http://narcolog-na-dom-v-krasnoyarske55.ru/
Выбор места лечения зависит от состояния пациента. Если симптомы умеренные и пациент способен самостоятельно поддерживать контакт с врачом, возможно лечение на дому. Однако при более сложных случаях, когда необходим постоянный контроль и интенсивная терапия, рекомендуется госпитализация.
Исследовать вопрос подробнее – https://наркология-помощь.рф/vyvod-iz-zapoya-na-domu-rostov-na-donu
Самостоятельно выйти из запоя — почти невозможно. В Ростове-На-Дону врачи клиники проводят медикаментозный вывод из запоя с круглосуточным выездом. Доверяйте профессионалам.
Слушай внимательно — тут важно – вывод из запоя клиника
После первичной диагностики начинается активная фаза лечения, в ходе которой современные препараты вводятся капельничным методом для быстрого выведения токсинов. Этот этап способствует восстановлению нормальных обменных процессов и стабилизации работы жизненно важных органов.
Получить дополнительные сведения – http://narco-vivod-clean.ru/vyzov-narkologa-na-dom-spb/https://narco-vivod-clean.ru
Самостоятельно выйти из запоя — почти невозможно. В Коломне врачи клиники проводят медикаментозный вывод из запоя с круглосуточным выездом. Доверяйте профессионалам.
Выяснить больше – вызвать капельницу от запоя на дому коломна
Когда организм на пределе, важна срочная помощь в Коломне — это команда опытных наркологов, которые помогут быстро и мягко выйти из запоя без вреда для здоровья.
Исследовать вопрос подробнее – капельница от запоя на дому цена в коломне
Каждый день запоя увеличивает риск для жизни. Не рискуйте — специалисты в Ростове-На-Дону приедут на дом и окажут экстренную помощь. Без боли, стресса и ожидания.
Получить профессиональную консультацию – вывод из запоя в стационаре в ростове-на-дону
Когда организм на пределе, важна срочная помощь в Коломне — это команда опытных наркологов, которые помогут быстро и мягко выйти из запоя без вреда для здоровья.
Изучить вопрос глубже – капельница от запоя клиника в коломне
Лечение начинается с первичной диагностики, в ходе которой врач проводит осмотр пациента, измеряет уровень кислорода в крови, артериальное давление и пульс, оценивает общее состояние. После диагностики начинается этап детоксикации, направленный на очищение организма от токсинов. С помощью внутривенных растворов выводятся продукты распада этанола, нормализуется обмен веществ и восстанавливается водный баланс.
Детальнее – http://наркология-дома.рф/vyvod-iz-zapoya-kruglosutochno-v-krasnodare/
В зависимости от индивидуальных особенностей и пожеланий пациента, терапия может проводиться разными способами:
Получить дополнительную информацию – вывод из запоя недорого
– человек не может прекратить употребление сам; – наблюдается агрессия, страх, паника, бессвязная речь; – нарушен сон, отсутствует аппетит, сильная слабость; – алкоголь стал способом снятия боли или тревоги; – попытки отказа приводят к ухудшению состояния.
Узнать больше – вывод из запоя серпухов
Лечение запоя в клинике «Преодоление» строится на поэтапном подходе, направленном на полное восстановление организма. После первичной диагностики назначается индивидуальная программа, включающая следующие шаги:
Исследовать вопрос подробнее – https://наркология-помощь.рф/vyvod-iz-zapoya-na-domu-rostov-na-donu/
Перед началом кодирования важно провести комплексную диагностику. Врачи клиники оценивают общее состояние пациента, определяют степень зависимости, выявляют противопоказания к медикаментозным препаратам, уточняют психоэмоциональный фон. На этом этапе важно, чтобы пациент был трезв — либо как минимум 2–3 дня без алкоголя, либо прошёл процедуру детоксикации в нашей клинике или дома под наблюдением.
Узнать больше – кодирование от алкоголизма стоимость
В «Трезвом Истоке» мы понимаем: принять решение о вызове — это шаг, требующий смелости. Особенно если речь идёт о близком человеке, который отрицает наличие проблемы. Именно поэтому наши врачи умеют работать тактично, без давления. Мы не заставляем — мы объясняем. Спокойно, профессионально и по-человечески.
Детальнее – вывод из запоя вызов на дом
Публикация приглашает вас исследовать неизведанное — от древних тайн до современных достижений науки. Вы узнаете, как случайные находки превращались в революции, а смелые мысли — в новые эры человеческого прогресса.
Осуществить глубокий анализ – https://gcem.org/saturday-january-6-2024
Эта статья для ознакомления предлагает читателям общее представление об актуальной теме. Мы стремимся представить ключевые факты и идеи, которые помогут читателям получить представление о предмете и решить, стоит ли углубляться в изучение.
Изучить вопрос глубже – http://www.mm-baitservice-blog.at/2018/03/01/37-2/bild3/?page_number_0=23
Мы предлагаем вам подробное руководство, основанное на проверенных источниках и реальных примерах. Каждая часть публикации направлена на то, чтобы помочь вам разобраться в сложных вопросах и применить знания на практике.
Читать дальше – https://ciofirst.com/effectual-named-a-global-leader-in-cloud-computing-for-three-consecutive-years
Эта статья предлагает живое освещение актуальной темы с множеством интересных фактов. Мы рассмотрим ключевые моменты, которые делают данную тему важной и актуальной. Подготовьтесь к насыщенному путешествию по неизвестным аспектам и узнайте больше о значимых событиях.
Нажми и узнай всё – https://thedrsuzanne.com/speaking_events/locales-comerciales
Эта статья для ознакомления предлагает читателям общее представление об актуальной теме. Мы стремимся представить ключевые факты и идеи, которые помогут читателям получить представление о предмете и решить, стоит ли углубляться в изучение.
Подробная информация доступна по запросу – https://www.senkronfilm.com/?p=2111
Публикация предлагает уникальную подборку информации, которая будет интересна как специалистам, так и широкому кругу читателей. Здесь вы найдете ответы на часто задаваемые вопросы и полезные инсайты для дальнейшего применения.
Ознакомиться с полной информацией – https://231disposal.com/blog/3-ways-to-get-rid-of-a-couch-in-traverse-city-michigan
Публикация приглашает вас исследовать неизведанное — от древних тайн до современных достижений науки. Вы узнаете, как случайные находки превращались в революции, а смелые мысли — в новые эры человеческого прогресса.
Перейти к статье – https://codec-ouaga.com/reunion
В этой статье вы найдете познавательную и занимательную информацию, которая поможет вам лучше понять мир вокруг. Мы собрали интересные данные, которые вдохновляют на размышления и побуждают к действиям. Открывайте новую информацию и получайте удовольствие от чтения!
Лучшее решение — прямо здесь – https://xr-kosmetik.de/2017/09/22/the-heart-of-the-matter
Эта информационная заметка содержит увлекательные сведения, которые могут вас удивить! Мы собрали интересные факты, которые сделают вашу жизнь ярче и полнее. Узнайте нечто новое о привычных аспектах повседневности и откройте для себя удивительный мир информации.
Что ещё? Расскажи всё! – http://www.mm-baitservice-blog.at/2018/03/01/37-2/bild3/?page_number_0=23
В этой статье вы найдете познавательную и занимательную информацию, которая поможет вам лучше понять мир вокруг. Мы собрали интересные данные, которые вдохновляют на размышления и побуждают к действиям. Открывайте новую информацию и получайте удовольствие от чтения!
Читать дальше – https://alquilaconexito.com/maximizar-rentabilidad-vivienda-consejos-propietarios
Предлагаем вашему вниманию интересную справочную статью, в которой собраны ключевые моменты и нюансы по актуальным вопросам. Эта информация будет полезна как для профессионалов, так и для тех, кто только начинает изучать тему. Узнайте ответы на важные вопросы и расширьте свои знания!
Выяснить больше – https://f5fashion.vn/chi-tiet-72-ve-hinh-nen-hd-4k-moi-nhat
Эта статья предлагает живое освещение актуальной темы с множеством интересных фактов. Мы рассмотрим ключевые моменты, которые делают данную тему важной и актуальной. Подготовьтесь к насыщенному путешествию по неизвестным аспектам и узнайте больше о значимых событиях.
Продолжить изучение – https://sparksmontessori.com/unlocking-the-joy-of-learning
Этот информативный текст выделяется своими захватывающими аспектами, которые делают сложные темы доступными и понятными. Мы стремимся предложить читателям глубину знаний вместе с разнообразием интересных фактов. Откройте новые горизонты и развивайте свои способности познавать мир!
Посмотреть подробности – https://mtdcltd.co.in
Мы собрали для вас самые захватывающие факты из мира науки и истории. От малознакомых деталей до грандиозных событий — эта статья расширит ваш кругозор и подарит новое понимание того, как устроен наш мир.
Как достичь результата? – http://bevan-funnell.ru
Публикация приглашает вас исследовать неизведанное — от древних тайн до современных достижений науки. Вы узнаете, как случайные находки превращались в революции, а смелые мысли — в новые эры человеческого прогресса.
Ознакомьтесь с аналитикой – https://vetla.co.uk/product/large-rodent-dental-kit
Публикация приглашает вас исследовать неизведанное — от древних тайн до современных достижений науки. Вы узнаете, как случайные находки превращались в революции, а смелые мысли — в новые эры человеческого прогресса.
Подробная информация доступна по запросу – https://f5fashion.vn/ky-niem-tuoi-vang-chuong-trinh-truyen-hinh-thuc-te-danh-cho-nguoi-cao-tuoi
В этой статье вы найдете познавательную и занимательную информацию, которая поможет вам лучше понять мир вокруг. Мы собрали интересные данные, которые вдохновляют на размышления и побуждают к действиям. Открывайте новую информацию и получайте удовольствие от чтения!
Ознакомьтесь с аналитикой – https://www.mirnafotografie.nl/want-an-easy-fix-for-your-music-read-this-2
В статье представлены ключевые моменты по актуальной теме, дополненные советами экспертов и ссылками на дополнительные ресурсы. Цель материала — дать читателю инструменты для самостоятельного развития и принятия осознанных решений.
Погрузиться в научную дискуссию – http://4kms.ru
С увеличением темпа жизни и нарастающим стрессом, многие люди в Екатеринбурге сталкиваются с зависимостями, особенно с алкогольной. Алкогольная зависимость является одной из наиболее распространённых проблем, требующих немедленного вмешательства специалистов. Важно помнить, что в сложных ситуациях, связанных с зависимостью, помощь не должна откладываться. Вызов нарколога на дом в Екатеринбурге становится идеальным вариантом для тех, кто не может или не хочет покидать свой дом, но нуждается в медицинской помощи.
Разобраться лучше – выезд нарколога на дом екатеринбург
Работа врача начинается с детального сбора анамнеза: выясняются длительность запоя, объёмы употреблённого алкоголя, сопутствующие заболевания и аллергические реакции. Затем специалист измеряет давление, пульс, сатурацию и температуру, после чего подбирает оптимальный протокол детоксикации.
Детальнее – https://vyvod-iz-zapoya-reutov4.ru/vyvod-iz-zapoya-stacionar-v-reutove
Эта информационная заметка содержит увлекательные сведения, которые могут вас удивить! Мы собрали интересные факты, которые сделают вашу жизнь ярче и полнее. Узнайте нечто новое о привычных аспектах повседневности и откройте для себя удивительный мир информации.
Выяснить больше – https://f5fashion.vn/tong-hop-hon-55-ve-ban-tiec-sinh-nhat-don-gian-hay-nhat
Для срочных случаев клиника поддерживает круглосуточный режим приёма заявок. После оформления вызова диспетчер передаёт информацию бригаде, и в течение часа врач прибудет по указанному адресу.
Ознакомиться с деталями – анонимный вывод из запоя в мариуполе
Мультидисциплинарная программа строится на взаимодействии нескольких специалистов — нарколога, психотерапевта, социального работника и, при необходимости, специалиста по физреабилитации. Такой формат позволяет:
Исследовать вопрос подробнее – лечение наркомании диспансер
Самостоятельно выйти из запоя — почти невозможно. В Ростове-На-Дону врачи клиники проводят медикаментозный вывод из запоя с круглосуточным выездом. Доверяйте профессионалам.
Не пропусти важное – вывод из запоя в стационаре в ростове-на-дону
Алкогольный делирий проявляется в виде галлюцинаций, бреда и агрессии. При отсутствии контроля такие пациенты опасны для себя и окружающих, требуя немедленной госпитализации.
Подробнее – http://vivod-iz-zapoya-chelyabinsk13.ru/
Каждый пациент проходит предварительное обследование: экспресс-анализ крови на электролиты, биохимия печени и почек, ЭКГ. На основании результатов врач формирует персональную программу инфузионной терапии.
Разобраться лучше – капельница от запоя анонимно челябинск
Каждый день запоя увеличивает риск для жизни. Не рискуйте — специалисты в Ростове-На-Дону приедут на дом и окажут экстренную помощь. Без боли, стресса и ожидания.
Проверенные методы — узнай сейчас – вывод из запоя в стационаре
Врач назначает комплекс препаратов для нормализации состояния и устранения интоксикации. Применяются детоксикационные средства для очищения организма и облегчения абстинентного синдрома. Важным компонентом терапии являются витаминные комплексы и минералы, восстанавливающие метаболический баланс. При необходимости назначаются седативные препараты для снижения тревожности и нормализации сна. Также используются гепатопротекторы и другие средства для поддержки органов, пострадавших от алкогольной интоксикации.
Получить больше информации – вывод из запоя на дому в красноярске
Медикаментозное лечение — это еще один важный этап. Оно включает использование препаратов, которые помогают пациенту восстановиться как физически, так и психологически. Нарколог контролирует процесс лечения, чтобы исключить побочные эффекты и скорректировать терапию при необходимости.
Подробнее – нарколог на дом вывод из запоя красноярск
Подробности можно найти на официальном сайте Министерства здравоохранения РФ, где описаны стандарты оказания наркологической помощи и рекомендации по лечению зависимости Минздрав РФ — наркологическая помощь.
Получить больше информации – частный нарколог на дом в челябинске
Для устойчивого отказа от вредных привычек применяется кодирование — метод, основанный на психологическом воздействии, а также заместительная терапия, при которой пациент получает контролируемые дозы препаратов, снижающих ломку и тягу.
Получить дополнительную информацию – https://narkologicheskaya-klinika-mariupol13.ru/
Каждый день запоя увеличивает риск для жизни. Не рискуйте — специалисты в Ростове-На-Дону приедут на дом и окажут экстренную помощь. Без боли, стресса и ожидания.
Не пропусти важное – rostov-na-donu
Наркологическая клиника в Челябинске предоставляет полный спектр медицинских услуг по диагностике, лечению и реабилитации пациентов с зависимостями различной этиологии. Современные методы терапии, применяемые в клинике, направлены на безопасное и эффективное избавление от наркотической и алкогольной зависимости, а также сопутствующих психических и соматических осложнений.
Детальнее – https://narkologicheskaya-klinika-chelyabinsk13.ru
Каждый день запоя увеличивает риск для жизни. Не рискуйте — специалисты в Ростове-На-Дону приедут на дом и окажут экстренную помощь. Без боли, стресса и ожидания.
Изучите внимательнее – вывод из запоя на дому круглосуточно город ростов-на-дону
При сильной интоксикации требуется полное очищение организма от токсинов. Детоксикация помогает нормализовать работу внутренних органов, улучшить общее состояние пациента и восстановить баланс жидкостей в организме. Специалист использует современные препараты, включая электролиты, глюкозу и антиоксиданты, для безопасного и эффективного очищения организма.
Изучить вопрос глубже – запой нарколог на дом в красноярске
В Красноярске есть специализированные клиники, где опытные специалисты с применением современных методов помогают выйти из запоя, обеспечивая быстрое и эффективное восстановление
Детальнее – https://vyvod-iz-zapoya-krasnoyarsk66.ru/
С увеличением темпа жизни и нарастающим стрессом, многие люди в Екатеринбурге сталкиваются с зависимостями, особенно с алкогольной. Алкогольная зависимость является одной из наиболее распространённых проблем, требующих немедленного вмешательства специалистов. Важно помнить, что в сложных ситуациях, связанных с зависимостью, помощь не должна откладываться. Вызов нарколога на дом в Екатеринбурге становится идеальным вариантом для тех, кто не может или не хочет покидать свой дом, но нуждается в медицинской помощи.
Детальнее – vyzov-narkologa-na-dom ekaterinburg
Клиника Частный Медик 24 в Балашихе — профессиональный стационарный вывод из запоя, подробности на сайте.
Узнайте всю правду – нарколог вывод из запоя
Экстренная помощь при выводе из запоя в Архангельске организована по четко отлаженной схеме. Специалисты проводят комплексное обследование пациента на месте, разрабатывают индивидуальный план терапии и незамедлительно приступают к детоксикации. Такой подход позволяет максимально быстро нейтрализовать токсическую нагрузку и восстановить жизненно важные функции организма.
Углубиться в тему – vyvod-iz-zapoya-na-domu arhangel’sk
Клиника в Балашихе — Частный Медик 24: стационарный вывод из запоя с комфортом и медицинским сопровождением.
Подробнее можно узнать тут – вывод из запоя московская область
Затяжной запой опасен для жизни. Врачи наркологической клиники в Коломне проводят срочный вывод из запоя — на дому или в стационаре. Анонимно, безопасно, круглосуточно.
Детальнее – врача капельницу от запоя коломна
При глубокой алкогольной интоксикации запой может привести к серьёзным осложнениям — от обезвоживания и электролитного дисбаланса до острого алкогольного психоза. В Мариуполе клиника «Мариуполь без запоя» предлагает оперативную помощь на дому с выездом нарколога в течение 60 минут и круглосуточную поддержку. Пациент получает комплексное лечение без стресса госпитализации и в условиях полной конфиденциальности.
Ознакомиться с деталями – http://
Затяжной запой опасен для жизни. Врачи наркологической клиники в Коломне проводят срочный вывод из запоя — на дому или в стационаре. Анонимно, безопасно, круглосуточно.
Узнать больше – вызвать капельницу от запоя на дому коломна
Близкий человек в запое? Не ждите ухудшения. Обратитесь в клинику — здесь проведут профессиональный вывод из запоя с последующим восстановлением организма.
Подробнее можно узнать тут – капельница от запоя в коломне
В Балашихе клиника Частный Медик 24 предлагает эффективный вывод из запоя в стационаре — подробности на сайте клиники.
Что скрывают от вас? – вывод из запоя капельница
Судороги возникают из-за резкого исчезновения алкоголя как депрессанта при одновременном возбуждении нейрональных цепей. Без быстрого медицинского вмешательства возможен гипоксический инсульт.
Разобраться лучше – https://vivod-iz-zapoya-chelyabinsk13.ru/srochnyj-vyvod-iz-zapoya-chelyabinsk/
В Коломне решение есть — наркологическая клиника. Здесь помогают людям выйти из запоя без страха и осуждения. Всё анонимно, грамотно и с заботой о каждом пациенте.
Подробнее можно узнать тут – врача капельницу от запоя в коломне
Затяжной запой опасен для жизни. Врачи наркологической клиники в Ростове-На-Дону проводят срочный вывод из запоя — на дому или в стационаре. Анонимно, безопасно, круглосуточно.
Изучите внимательнее – https://vyvod-iz-zapoya-rostov17.ru
Самостоятельно выйти из запоя — почти невозможно. В Ростове-На-Дону врачи клиники проводят медикаментозный вывод из запоя с круглосуточным выездом. Доверяйте профессионалам.
Раскрыть тему полностью – в ростове-на-дону
Чтобы обеспечить максимально безопасный и эффективный, а также поэтапный и контролируемый выход из запоя, крайне важно как можно скорее обратиться к квалифицированным специалистам, которые на основе тщательной диагностики определят оптимальный индивидуальный курс лечения, учитывая текущее физическое и психическое состояние пациента, наличие сопутствующих заболеваний и степень алкогольной зависимости
Изучить вопрос глубже – нарколог на дом вывод из запоя архангельск
Наркологическая клиника «ЧелябДоктор» специализируется на экстренной и плановой детоксикации пациентов с алкогольной зависимостью. Наши главные преимущества:
Углубиться в тему – врача капельницу от запоя в челябинске
Комплексный подход включает детоксикацию, психологическую поддержку и восстановление обмена веществ, индивидуальный подход и предотвращение повторных запоев – главные цели
Узнать больше – вывод из запоя в красноярске
Кроме того, анонимность является важной составляющей этой услуги. Лечение дома исключает возможность столкновения с посторонними людьми и помогает пациентам сохранить свою репутацию. Клиника «Гармония и Свет» обеспечивает полную конфиденциальность, предоставляя пациентам возможность получать помощь без лишних вопросов и обсуждений.
Ознакомиться с деталями – врач нарколог на дом екатеринбург.
В клинике применяются комплексные программы, включающие медицинскую детоксикацию, психотерапевтическую поддержку и социальную реабилитацию. Медицинская детоксикация проводится с использованием современных препаратов и методик, что позволяет снизить тяжесть абстинентного синдрома и минимизировать риски для здоровья пациента. Подробнее о методах детоксикации можно узнать на официальном портале Министерства здравоохранения России.
Ознакомиться с деталями – https://narkologicheskaya-klinika-chelyabinsk13.ru/
В современных условиях лечение алкогольной и наркотической зависимости требует комплексного подхода и быстрого реагирования. Нарколог на дом в Челябинске — это услуга, позволяющая получить квалифицированную помощь без необходимости посещения медицинского учреждения. Такая форма оказания медицинской помощи особенно актуальна для пациентов с острыми состояниями, а также тех, кто нуждается в анонимности и комфорте домашней обстановки.
Узнать больше – http://narkolog-na-dom-chelyabinsk13.ru
Медикаментозная детоксикация позволяет быстро и безопасно очистить организм от токсинов и продуктов распада алкоголя или наркотиков, минимизируя риски осложнений. Используются препараты, которые восстанавливают работу печени, почек и других органов, а также нормализуют электролитный баланс.
Изучить вопрос глубже – наркологическая клиника нарколог мариуполь
Стационарный вывод из запоя в Балашихе — лечение в Частном Медике 24, переходите по ссылке на страницу услуги.
Осуществить глубокий анализ – вывод из запоя клиника город балашиха
Каждый день запоя увеличивает риск для жизни. Не рискуйте — специалисты в Ростове-На-Дону приедут на дом и окажут экстренную помощь. Без боли, стресса и ожидания.
Не пропусти важное – narkolog-vyvod-iz-zapoya rostov-na-donu
Когда организм на пределе, важна срочная помощь в Ростове-На-Дону — это команда опытных наркологов, которые помогут быстро и мягко выйти из запоя без вреда для здоровья.
Подробнее – наркология вывод из запоя город ростов-на-дону
Каждый этап лечения тщательно продуман для достижения максимальной безопасности и эффективности:
Получить больше информации – вывод из запоя клиника
Услуга стационарного вывода из запоя от Частного Медика 24 в Балашихе — подробнее на странице предложения.
Расширить кругозор по теме – балашиха
Алкогольный делирий проявляется в виде галлюцинаций, бреда и агрессии. При отсутствии контроля такие пациенты опасны для себя и окружающих, требуя немедленной госпитализации.
Получить дополнительную информацию – нарколог на дом вывод из запоя
Если вы ищете вывод из запоя в стационаре в Балашихе, ознакомьтесь с предложением Частного Медика 24 на сайте.
Что скрывают от вас? – вывод из запоя клиника
Если состояние ухудшается, не ждите, дальнейшее употребление алкоголя опасно, своевременная помощь стабилизирует ваше состояние
Получить больше информации – http://vyvod-iz-zapoya-krasnoyarsk66.ru/vyvod-iz-zapoya-klinika-krasnoyarsk/
Когда пациент решает обратиться за помощью к наркологу на дом, ему предстоит пройти ряд этапов лечения, каждый из которых будет направлен на устранение последствий алкоголизма. Врач проведет первичный осмотр, выслушает жалобы пациента и на основе собранной информации начнёт индивидуальную программу лечения.
Получить дополнительную информацию – нарколог на дом круглосуточно екатеринбург
В зависимости от индивидуальных особенностей и пожеланий пациента, терапия может проводиться разными способами:
Ознакомиться с деталями – вывод из запоя на дому цена красноярск
Самостоятельно выйти из запоя — почти невозможно. В Ростове-На-Дону врачи клиники проводят медикаментозный вывод из запоя с круглосуточным выездом. Доверяйте профессионалам.
Узнать больше – наркология вывод из запоя в ростове-на-дону
Близкий человек в запое? Не ждите ухудшения. Обратитесь в клинику — здесь проведут профессиональный вывод из запоя с последующим восстановлением организма.
Изучите внимательнее – срочный вывод из запоя
В современных условиях лечение алкогольной и наркотической зависимости требует комплексного подхода и быстрого реагирования. Нарколог на дом в Челябинске — это услуга, позволяющая получить квалифицированную помощь без необходимости посещения медицинского учреждения. Такая форма оказания медицинской помощи особенно актуальна для пациентов с острыми состояниями, а также тех, кто нуждается в анонимности и комфорте домашней обстановки.
Углубиться в тему – врач нарколог выезд на дом челябинск
Наркологическая клиника «ЧелябДоктор» специализируется на экстренной и плановой детоксикации пациентов с алкогольной зависимостью. Наши главные преимущества:
Разобраться лучше – https://kapelnica-ot-zapoya-chelyabinsk13.ru/postavit-kapelniczu-ot-zapoya-chelyabinsk/
Детоксикация организма, проводимая на дому, помогает очистить кровь от токсинов, накопившихся из-за длительного употребления алкоголя или наркотических веществ. Она проводится с использованием специально подобранных медикаментов, которые улучшают работу печени, почек и других органов.
Выяснить больше – vyzvat-narkologa-na-dom krasnojarsk
Вид услуги
Подробнее можно узнать тут – наркологическая клиника цены в челябинске
Каждый день запоя увеличивает риск для жизни. Не рискуйте — специалисты в Коломне приедут на дом и окажут экстренную помощь. Без боли, стресса и ожидания.
Углубиться в тему – после капельницы от запоя в коломне
Самостоятельно выйти из запоя — почти невозможно. В Коломне врачи клиники проводят медикаментозный вывод из запоя с круглосуточным выездом. Доверяйте профессионалам.
Подробнее – капельница от запоя на дому город. московская область
Надёжный вывод из запоя в клинике Частный Медик 24 (Балашиха) — полный стационарный курс, смотрите по ссылке.
Детальнее – вывод из запоя на дому цена
Зависимость — это не только физическая, но и психологическая проблема. Врач-нарколог предоставляет первичную психологическую помощь, помогает справиться с тревогой, страхами и чувством вины. Если необходимо, пациенту предлагаются дальнейшие консультации с психологами клиники «Новое Дыхание».
Ознакомиться с деталями – vyzvat-narkologa-na-dom krasnojarsk
Близкий человек в запое? Не ждите ухудшения. Обратитесь в клинику — здесь проведут профессиональный вывод из запоя с последующим восстановлением организма.
Подробнее можно узнать тут – капельница от запоя на дому коломна
Запой – это крайне опасное состояние, когда контроль над употреблением алкоголя утрачивается, а токсичные вещества накапливаются в организме, угрожая жизни. В Архангельске экстренная медицинская помощь становится особенно актуальной, и специализированные службы готовы оперативно вмешаться для стабилизации состояния пациента. В данной статье описываются уникальные методики вывода из запоя, направленные на быстрое и безопасное восстановление здоровья в экстренных случаях.
Подробнее можно узнать тут – https://vyvod-iz-zapoya-arkhangelsk66.ru/vyvod-iz-zapoya-klinika-arkhangelsk
Своевременный вызов специалиста особенно важен при следующих признаках:
Разобраться лучше – вывод из запоя капельница на дому мариуполь
В Коломне решение есть — наркологическая клиника. Здесь помогают людям выйти из запоя без страха и осуждения. Всё анонимно, грамотно и с заботой о каждом пациенте.
Исследовать вопрос подробнее – капельница от запоя выезд
Надёжный вывод из запоя в клинике Частный Медик 24 (Балашиха) — полный стационарный курс, смотрите по ссылке.
Узнайте всю правду – балашиха.
Процесс лечения будет зависеть от состояния пациента и его особенностей. Врач подберёт нужную дозировку и состав препаратов для наиболее эффективного результата.
Выяснить больше – нарколог на дом анонимно
Пациенты могут воспринимать окружающих как врагов, отказываться от помощи. Стресс от изоляции дома усугубляет состояние без профессиональной поддержки.
Подробнее – нарколог на дом вывод из запоя челябинск
Быстрый вывод токсинов – приоритет, современные препараты очищают кровь, восстанавливая нормальный обмен веществ и устраняя последствия длительного употребления
Изучить вопрос глубже – анонимный вывод из запоя красноярск
В Балашихе (будни и выходные): стационарный вывод из запоя в клинике Частный Медик 24 — переход по ссылке.
Детальнее – вывод из запоя анонимно в балашихе
Самостоятельно выйти из запоя — почти невозможно. В Ростове-На-Дону врачи клиники проводят медикаментозный вывод из запоя с круглосуточным выездом. Доверяйте профессионалам.
Узнать больше – http://vyvod-iz-zapoya-rostov18.ru/
Затяжной запой опасен для жизни. Врачи наркологической клиники в Ростове-На-Дону проводят срочный вывод из запоя — на дому или в стационаре. Анонимно, безопасно, круглосуточно.
Переходите по ссылке ниже – срочный вывод из запоя в ростове-на-дону
Современная практика включает комплексное обследование, позволяющее оценить состояние пациента и подобрать оптимальную схему терапии. Нарколог на дом в Челябинске проводит:
Ознакомиться с деталями – нарколог на дом недорого челябинск
Затяжной запой опасен для жизни. Врачи наркологической клиники в Ростове-На-Дону проводят срочный вывод из запоя — на дому или в стационаре. Анонимно, безопасно, круглосуточно.
Переходите по ссылке ниже – вывод из запоя клиника в ростове-на-дону
В клинике применяются комплексные программы, включающие медицинскую детоксикацию, психотерапевтическую поддержку и социальную реабилитацию. Медицинская детоксикация проводится с использованием современных препаратов и методик, что позволяет снизить тяжесть абстинентного синдрома и минимизировать риски для здоровья пациента. Подробнее о методах детоксикации можно узнать на официальном портале Министерства здравоохранения России.
Изучить вопрос глубже – анонимная наркологическая клиника в челябинске
Каждый пациент проходит предварительное обследование: экспресс-анализ крови на электролиты, биохимия печени и почек, ЭКГ. На основании результатов врач формирует персональную программу инфузионной терапии.
Подробнее можно узнать тут – https://kapelnica-ot-zapoya-chelyabinsk13.ru/kapelniczy-ot-zapoya-na-domu-chelyabinsk
Затяжной запой опасен для жизни. Врачи наркологической клиники в Ростове-На-Дону проводят срочный вывод из запоя — на дому или в стационаре. Анонимно, безопасно, круглосуточно.
Подробнее – вывод из запоя круглосуточно
Клиника Частный Медик 24 в Балашихе — профессиональный стационарный вывод из запоя, подробности на сайте.
Хочешь знать всё? – вывод из запоя клиника город балашиха
Кроме того, анонимность является важной составляющей этой услуги. Лечение дома исключает возможность столкновения с посторонними людьми и помогает пациентам сохранить свою репутацию. Клиника «Гармония и Свет» обеспечивает полную конфиденциальность, предоставляя пациентам возможность получать помощь без лишних вопросов и обсуждений.
Изучить вопрос глубже – выезд нарколога на дом екатеринбург
В Балашихе клиника Частный Медик 24 предлагает эффективный вывод из запоя в стационаре — подробности на сайте клиники.
Посмотреть подробности – вывод из запоя цена город балашиха
Если состояние ухудшается, не ждите, дальнейшее употребление алкоголя опасно, своевременная помощь стабилизирует ваше состояние
Получить больше информации – клиника вывод из запоя красноярск
Каждый этап лечения тщательно продуман для достижения максимальной безопасности и эффективности:
Ознакомиться с деталями – http://vyvod-iz-zapoya-mariupol13.ru/vyvod-iz-zapoya-kruglosutochno-mariupol/
Пациенты могут воспринимать окружающих как врагов, отказываться от помощи. Стресс от изоляции дома усугубляет состояние без профессиональной поддержки.
Углубиться в тему – https://vivod-iz-zapoya-chelyabinsk13.ru/
Клиника в Балашихе — Частный Медик 24: стационарный вывод из запоя с комфортом и медицинским сопровождением.
Осуществить глубокий анализ – вывод из запоя капельница город балашиха
Затяжной запой опасен для жизни. Врачи наркологической клиники в Коломне проводят срочный вывод из запоя — на дому или в стационаре. Анонимно, безопасно, круглосуточно.
Подробнее тут – капельница от запоя цена в коломне
Затяжной запой опасен для жизни. Врачи наркологической клиники в Коломне проводят срочный вывод из запоя — на дому или в стационаре. Анонимно, безопасно, круглосуточно.
Разобраться лучше – капельница от запоя наркология
Современная практика включает комплексное обследование, позволяющее оценить состояние пациента и подобрать оптимальную схему терапии. Нарколог на дом в Челябинске проводит:
Изучить вопрос глубже – narkolog-na-dom-chelyabinsk13.ru/
Близкий человек в запое? Не ждите ухудшения. Обратитесь в клинику — здесь проведут профессиональный вывод из запоя с последующим восстановлением организма.
Подробнее тут – врач на дом капельница от запоя в коломне
Для проживающих в Балашихе: услуга стационарного вывода из запоя от Частного Медика 24 — переходите по ссылке.
Хочу знать больше – наркология вывод из запоя
Каждый день запоя увеличивает риск для жизни. Не рискуйте — специалисты в Коломне приедут на дом и окажут экстренную помощь. Без боли, стресса и ожидания.
Выяснить больше – поставить капельницу от запоя
Запой – это крайне опасное состояние, когда контроль над употреблением алкоголя утрачивается, а токсичные вещества накапливаются в организме, угрожая жизни. В Архангельске экстренная медицинская помощь становится особенно актуальной, и специализированные службы готовы оперативно вмешаться для стабилизации состояния пациента. В данной статье описываются уникальные методики вывода из запоя, направленные на быстрое и безопасное восстановление здоровья в экстренных случаях.
Разобраться лучше – вывод из запоя на дому круглосуточно
Без квалифицированного врачебного контроля организм подвергается чрезмерному и опасному стрессу, что может приводить к крайне критическим и непредсказуемым последствиям; при длительном и регулярном употреблении алкоголя происходит адаптация физиологических процессов к постоянному присутствию этанола, и когда эта неестественная поддержка внезапно исчезает, центральная нервная система и внутренние органы реагируют крайне остро, что может вызвать серьезные сбои и осложнения
Узнать больше – вывод. из. запоя. архангельск.
Услуга
Ознакомиться с деталями – http://narkolog-na-dom-ramenskoe4.ru/vyzov-narkologa-na-dom-v-ramenskom/https://narkolog-na-dom-ramenskoe4.ru
Быстрый вывод токсинов – приоритет, современные препараты очищают кровь, восстанавливая нормальный обмен веществ и устраняя последствия длительного употребления
Получить больше информации – клиника вывод из запоя красноярск
В этой статье представлен занимательный и актуальный контент, который заставит вас задуматься. Мы обсуждаем насущные вопросы и проблемы, а также освещаем истории, которые вдохновляют на действия и изменения. Узнайте, что стоит за событиями нашего времени!
Нажмите, чтобы узнать больше – https://coolsamsdigital.com/digital-marketing/why-a-linkedin-page-is-essential-for-new-startups
Эта публикация завернет вас в вихрь увлекательного контента, сбрасывая стереотипы и открывая двери к новым идеям. Каждый абзац станет для вас открытием, полным ярких примеров и впечатляющих достижений. Подготовьтесь быть вовлеченными и удивленными каждый раз, когда продолжите читать.
Секреты успеха внутри – https://webcenter.in/index.php/2023/09/25/solar-power-in-developing-nations-brightening-lives
Узнайте про выведение из запоя в стационаре в Частном Медике 24 (Балашиха) по ссылке.
Хочешь знать всё? – вывод из запоя на дому цена
Мы предлагаем вам подробное руководство, основанное на проверенных источниках и реальных примерах. Каждая часть публикации направлена на то, чтобы помочь вам разобраться в сложных вопросах и применить знания на практике.
Подробнее – https://radarnews.in/tdb_templates/search-template-default-pro
Этот информационный материал собраны данные, которые помогут лучше понять текущие тенденции и процессы в различных сферах жизни. Мы предоставляем четкий анализ, графики и примеры, чтобы информация была не только понятной, но и практичной для принятия решений.
Ссылка на источник – http://vinamgroup.com.vn/nqhdqt-ve-viec-vay-von-tai-ngan-hang-bidv
Мы собрали для вас самые захватывающие факты из мира науки и истории. От малознакомых деталей до грандиозных событий — эта статья расширит ваш кругозор и подарит новое понимание того, как устроен наш мир.
Более того — здесь – https://sonyah.pro/index.php/en/component/k2/item/7-footer/7-footer?start=140710
Мы предлагаем вам подробное руководство, основанное на проверенных источниках и реальных примерах. Каждая часть публикации направлена на то, чтобы помочь вам разобраться в сложных вопросах и применить знания на практике.
Доступ к полной версии – https://adventurecampers.com/tres-apliaciones-para-viajar-en-autocaravana
В этой публикации мы предлагаем подробные объяснения по актуальным вопросам, чтобы помочь читателям глубже понять их. Четкость и структурированность материала сделают его удобным для усвоения и применения в повседневной жизни.
Секреты успеха внутри – https://f5fashion.vn/update-genre-with-folk-and-blues-influences-unveiling-the-soulful-melodies
Мы собрали для вас самые захватывающие факты из мира науки и истории. От малознакомых деталей до грандиозных событий — эта статья расширит ваш кругозор и подарит новое понимание того, как устроен наш мир.
Смотрите также… – https://bdanalytics.com.br/harnessing-the-power-of-social-media-for-business-growth
Наиболее эффективным, безопасным и быстрым способом очищения организма от алкоголя и его токсичных метаболитов является постановка внутривенной капельницы, которая позволяет в кратчайшие сроки стабилизировать состояние пациента, восстановить водно-электролитный баланс и нормализовать работу внутренних органов, снижая тем самым риск развития опасных осложнений и улучшая общее самочувствие
Получить больше информации – https://kapelnica-ot-zapoya-ekb55.ru/kapelnicza-na-domu-ekaterinburg-ot-zapoya
Этот информативный текст отличается привлекательным содержанием и актуальными данными. Мы предлагаем читателям взглянуть на привычные вещи под новым углом, предоставляя интересный и доступный материал. Получите удовольствие от чтения и расширьте кругозор!
Обратитесь за информацией – http://www.float-ekb.ru
Этот увлекательный информационный материал подарит вам массу новых знаний и ярких эмоций. Мы собрали для вас интересные факты и сведения, которые обогатят ваш опыт. Откройте для себя увлекательный мир информации и насладитесь процессом изучения!
Узнать напрямую – https://f5fashion.vn/cap-nhat-hon-39-ve-xe-honda-md-hay-nhat
Мы предлагаем вам подробное руководство, основанное на проверенных источниках и реальных примерах. Каждая часть публикации направлена на то, чтобы помочь вам разобраться в сложных вопросах и применить знания на практике.
Обратиться к источнику – https://www.passived.de/forum/showthread.php?tid=4278
В этой медицинской статье мы погрузимся в актуальные вопросы здравоохранения и лечения заболеваний. Читатели узнают о современных подходах, методах диагностики и новых открытий в научных исследованиях. Наша цель — донести важную информацию и повысить уровень осведомленности о здоровье.
Углубиться в тему – https://kozhica.ru/safehair/psihicheskoe-zdorove-v-kolomne-sovremennye-podhody.html
В статье представлены ключевые моменты по актуальной теме, дополненные советами экспертов и ссылками на дополнительные ресурсы. Цель материала — дать читателю инструменты для самостоятельного развития и принятия осознанных решений.
Секреты успеха внутри – https://f5fashion.vn/cuoc-song-duoi-chan-nui-lua-dang-hoat-dong
Наши специалисты работают круглосуточно, помогая пациентам справиться с абстинентным синдромом, восстановить здоровье и снизить риски осложнений.
Изучить вопрос глубже – наркология вывод из запоя в новокузнецке
Мы собрали для вас самые захватывающие факты из мира науки и истории. От малознакомых деталей до грандиозных событий — эта статья расширит ваш кругозор и подарит новое понимание того, как устроен наш мир.
Узнать из первых рук – https://uniforme-eletricista-nr10.com.br/extraction-2020-download-torrent
Мы предлагаем вам подробное руководство, основанное на проверенных источниках и реальных примерах. Каждая часть публикации направлена на то, чтобы помочь вам разобраться в сложных вопросах и применить знания на практике.
Обратиться к источнику – https://f5fashion.vn/khu-di-tich-le-chi-vien-tuong-nho-nguoi-anh-hung-dan-toc-nguyen-trai
В этой медицинской статье мы погрузимся в актуальные вопросы здравоохранения и лечения заболеваний. Читатели узнают о современных подходах, методах диагностики и новых открытий в научных исследованиях. Наша цель — донести важную информацию и повысить уровень осведомленности о здоровье.
Получить дополнительную информацию – https://idealnaya-ya.ru/narkolog-na-dom-v-klinike-narkolog-ekspress-pomoshh-dostupnaya-ryadom-s-vami.html
Используя современные инфузионные системы, мы постепенно вводим растворы для выведения токсинов, коррекции водно-электролитного баланса и восстановления функции печени. Параллельно подбираются препараты для снятия абстинентного синдрома, купирования тревожности и нормализации сна.
Исследовать вопрос подробнее – http://narkologicheskaya-klinika-dolgoprudnyj3.ru
Затяжной запой опасен для жизни. Врачи наркологической клиники в Ростове-На-Дону проводят срочный вывод из запоя — на дому или в стационаре. Анонимно, безопасно, круглосуточно.
Дополнительно читайте здесь – вывод из запоя в ростове-на-дону
После поступления заявки врач выезжает в течение 30–60 минут и по прибытии проводит диагностику, оценивает состояние пациента, измеряет пульс, давление, уровень кислорода в крови.
Углубиться в тему – платный нарколог на дом
Первый этап лечения направлен на быстрый вывод токсинов, накопившихся в организме вследствие длительного употребления алкоголя. Для этого применяются современные препараты, позволяющие очистить кровь и восстановить нормальный обмен веществ.
Углубиться в тему – срочный вывод из запоя красноярск
Современные методы лечения при выводе из запоя включают как медикаментозную детоксикацию, так и психологическую реабилитацию. В Уфе наркологи используют капельничное введение лекарственных средств, которые помогают быстро вывести токсины, нормализовать обмен веществ и стабилизировать работу внутренних органов. Одновременно с этим проводится психологическая поддержка для снижения эмоционального стресса, связанного с запоем.
Ознакомиться с деталями – нарколог на дом уфа
Наши специалисты используют проверенные медикаменты, которые подбираются индивидуально для каждого пациента:
Узнать больше – http://narcolog-na-dom-voronezh0.ru
Наши специалисты используют проверенные и сертифицированные медикаменты, которые подбираются индивидуально для каждого пациента:
Детальнее – капельница от запоя клиника в нижний новгороде
Затяжной запой опасен для жизни. Врачи наркологической клиники в Ростове-На-Дону проводят срочный вывод из запоя — на дому или в стационаре. Анонимно, безопасно, круглосуточно.
Прочитать подробнее – вывод из запоя в ростове-на-дону
Основные показания для вызова нарколога на дом включают:
Детальнее – запой нарколог на дом в иркутске
Каждый день запоя увеличивает риск для жизни. Не рискуйте — специалисты в Ростове-На-Дону приедут на дом и окажут экстренную помощь. Без боли, стресса и ожидания.
Как это работает — подробно – вывод из запоя клиника в ростове-на-дону
Близкий человек в запое? Не ждите ухудшения. Обратитесь в клинику — здесь проведут профессиональный вывод из запоя с последующим восстановлением организма.
Слушай внимательно — тут важно – вывод из запоя ростовская область
Пациенты, которые обращаются в нашу клинику, получают целый комплекс преимуществ, благодаря которым лечение проходит максимально эффективно и комфортно:
Получить дополнительную информацию – нарколог на дом клиника
Чрезмерное употребление алкоголя приводит к отравлению организма, негативно сказываясь на работе внутренних органов, уровне жидкости и общем самочувствии. Длительные запои сопровождаются тяжёлыми последствиями, включая нарушения сердечной деятельности, сбои в работе печени, скачки давления и психоэмоциональные расстройства.
Подробнее – капельница от запоя круглосуточно в красноярске
Услуга
Изучить вопрос глубже – вызвать капельницу от запоя на дому в нижний новгороде
На основе полученных диагностических данных врач подбирает оптимальные препараты и дозировки, разрабатывая персональный план лечебных мероприятий.
Узнать больше – вызов врача нарколога на дом
Введение препаратов осуществляется внутривенно, что обеспечивает оперативное действие медикаментов. В состав лечебного раствора входят средства для детоксикации организма, нормализации водно-электролитного и кислотно-щелочного баланса. При необходимости врач дополнительно вводит препараты, защищающие печень, стабилизирующие работу сердца и успокаивающие нервную систему. Вся процедура проводится под строгим контролем нарколога, который следит за состоянием пациента и корректирует терапию при необходимости. По завершении процедуры врач дает пациенту и его родственникам подробные рекомендации по дальнейшему восстановлению и профилактике повторных запоев.
Подробнее тут – капельница от запоя наркология
Резкий отказ от алкоголя без врачебной помощи может спровоцировать абстинентный синдром, который сопровождается судорогами, галлюцинациями, аритмией и критическими скачками артериального давления. В тяжёлых случаях состояние может осложниться алкогольным делирием (белая горячка), приступами паники, депрессией и острыми сердечно-сосудистыми расстройствами.
Разобраться лучше – https://vyvod-iz-zapoya-novokuznetsk6.ru/
После завершения процедур пациенту предоставляется подробная консультация с рекомендациями по дальнейшему восстановлению и профилактике повторных случаев зависимости.
Получить дополнительные сведения – запой нарколог на дом
Клиника в Балашихе — Частный Медик 24: стационарный вывод из запоя с комфортом и медицинским сопровождением.
Расширить кругозор по теме – наркология вывод из запоя город балашиха
Стационарный вывод из запоя в Балашихе — лечение в Частном Медике 24, переходите по ссылке на страницу услуги.
Подробнее можно узнать тут – наркология вывод из запоя
Надёжный вывод из запоя в клинике Частный Медик 24 (Балашиха) — полный стационарный курс, смотрите по ссылке.
Хочешь знать всё? – вывод из запоя московская область
После звонка специалист клиники «ВитаЛайн» оперативно отправляется по указанному адресу и обычно прибывает в течение 30–60 минут. На месте врач сразу проводит детальную диагностику, оценивая состояние пациента: проверяет пульс, давление, сатурацию, степень интоксикации и наличие хронических болезней. На основании результатов осмотра нарколог разрабатывает индивидуальную схему терапии.
Ознакомиться с деталями – нарколог на дом недорого в новосибирске
Самостоятельно выйти из запоя — почти невозможно. В Ростове-На-Дону врачи клиники проводят медикаментозный вывод из запоя с круглосуточным выездом. Доверяйте профессионалам.
Слушай внимательно — тут важно – ростов-на-дону.
В Коломне: эффективная стационарная капельница от запоя в клинике Частный Медик?24, подробности переходом по ссылке.
Получить дополнительные сведения – капельница от запоя выезд в коломне
В Коломне клиника Частный Медик?24 предлагает капельницу от запоя в стационаре — подробности на сайте клиники.
Подробнее – капельница от запоя цена город. московская область
В Коломне клиника Частный Медик?24 предлагает капельницу от запоя в стационаре — подробности на сайте клиники.
Узнать больше – капельница от запоя выезд коломна
Наши специалисты работают круглосуточно, помогая пациентам справиться с абстинентным синдромом, восстановить здоровье и снизить риски осложнений.
Углубиться в тему – вывод из запоя вызов
Современные методы лечения при выводе из запоя включают как медикаментозную детоксикацию, так и психологическую реабилитацию. В Уфе наркологи используют капельничное введение лекарственных средств, которые помогают быстро вывести токсины, нормализовать обмен веществ и стабилизировать работу внутренних органов. Одновременно с этим проводится психологическая поддержка для снижения эмоционального стресса, связанного с запоем.
Изучить вопрос глубже – вызов нарколога цена в уфе
В таких случаях своевременное обращение за помощью позволяет быстро стабилизировать состояние и предотвратить развитие серьезных осложнений.
Выяснить больше – http://narcolog-na-dom-voronezh0.ru/zapoj-narkolog-na-dom-voronezh/https://narcolog-na-dom-voronezh0.ru
Процесс вывода из запоя состоит из нескольких последовательных и взаимосвязанных этапов, каждый из которых играет свою ключевую и незаменимую роль в обеспечении стабильного положительного результата и гарантированной безопасности пациента на протяжении всего периода лечения и восстановления
Подробнее тут – вывод. из. запоя. архангельск.
Самостоятельно выйти из запоя — почти невозможно. В Ростове-На-Дону врачи клиники проводят медикаментозный вывод из запоя с круглосуточным выездом. Доверяйте профессионалам.
Как это работает — подробно – вывод из запоя недорого в ростове-на-дону
Когда организм на пределе, важна срочная помощь в Ростове-На-Дону — это команда опытных наркологов, которые помогут быстро и мягко выйти из запоя без вреда для здоровья.
Дополнительно читайте здесь – вывод из запоя капельница город ростов-на-дону
Каждый день запоя увеличивает риск для жизни. Не рискуйте — специалисты в Ростове-На-Дону приедут на дом и окажут экстренную помощь. Без боли, стресса и ожидания.
Как это работает — подробно – вывод из запоя в стационаре в ростове-на-дону
После обращения пациента в клинику «НаркоЩит» наш специалист выезжает на дом в течение 30–60 минут. По прибытии врач проводит подробный осмотр: измеряет артериальное давление, пульс и уровень кислорода в крови, а также собирает анамнез, чтобы оценить степень интоксикации и тяжесть запоя. На основе полученной информации формируется индивидуальный план лечения.
Узнать больше – капельница от запоя цена в нижний новгороде
В Коломне (круглосуточно): стационарная капельница от запоя в клинике Частный Медик?24 — переход по ссылке.
Подробнее – капельница от запоя на дому цена в коломне
Стоимость услуг по установке капельницы определяется индивидуально и зависит от нескольких факторов. В первую очередь, цена обусловлена тяжестью состояния пациента: при более сильной интоксикации и выраженных симптомах абстинентного синдрома может потребоваться расширенная терапия. Кроме того, итоговая сумма зависит от продолжительности запоя, так как длительное употребление спиртного ведет к более серьезному накоплению токсинов, требующему дополнительных лечебных мероприятий.
Разобраться лучше – http://kapelnica-ot-zapoya-nizhniy-novgorod000.ru/kapelnicza-ot-zapoya-na-domu-nizhnij-novgorod/
В Балашихе (будни и выходные): стационарный вывод из запоя в клинике Частный Медик 24 — переход по ссылке.
Что скрывают от вас? – московская область
Введение препаратов осуществляется внутривенно, что обеспечивает оперативное действие медикаментов. В состав лечебного раствора входят средства для детоксикации организма, нормализации водно-электролитного и кислотно-щелочного баланса. При необходимости врач дополнительно вводит препараты, защищающие печень, стабилизирующие работу сердца и успокаивающие нервную систему. Вся процедура проводится под строгим контролем нарколога, который следит за состоянием пациента и корректирует терапию при необходимости. По завершении процедуры врач дает пациенту и его родственникам подробные рекомендации по дальнейшему восстановлению и профилактике повторных запоев.
Исследовать вопрос подробнее – капельница от запоя на дому нижний новгород.
Услуга стационарного вывода из запоя от Частного Медика 24 в Балашихе — подробнее на странице предложения.
Посмотреть подробности – вывод из запоя цена в балашихе
Основной частью лечения является постановка внутривенной капельницы с растворами, которые помогают быстро вывести токсины, нормализовать водно-солевой баланс и восстановить работу внутренних органов. Дополнительно назначаются средства для защиты печени, нормализации работы сердца и снятия тревожности. Врач контролирует состояние пациента на протяжении всей процедуры, а при необходимости корректирует лечебную схему. По окончании манипуляций специалист обязательно дает рекомендации для дальнейшего восстановления организма и предотвращения повторных запоев.
Выяснить больше – нарколог на дом недорого новосибирск
Этап лечения
Изучить вопрос глубже – вывод из запоя вызов
Услуга стационарного вывода из запоя от Частного Медика 24 в Балашихе — подробнее на странице предложения.
Углубиться в тему – вывод из запоя на дому цена город балашиха
После поступления звонка нарколог оперативно выезжает по указанному адресу и прибывает в течение 30–60 минут. Врач незамедлительно приступает к оказанию помощи по четко отработанному алгоритму, состоящему из следующих этапов:
Подробнее – выезд нарколога на дом
Первый этап лечения направлен на быстрый вывод токсинов, накопившихся в организме вследствие длительного употребления алкоголя. Для этого применяются современные препараты, позволяющие очистить кровь и восстановить нормальный обмен веществ.
Получить больше информации – https://vyvod-iz-zapoya-krasnoyarsk66.ru/vyvod-iz-zapoya-klinika-krasnoyarsk/
Современные методы лечения при выводе из запоя включают как медикаментозную детоксикацию, так и психологическую реабилитацию. В Уфе наркологи используют капельничное введение лекарственных средств, которые помогают быстро вывести токсины, нормализовать обмен веществ и стабилизировать работу внутренних органов. Одновременно с этим проводится психологическая поддержка для снижения эмоционального стресса, связанного с запоем.
Ознакомиться с деталями – http://narcolog-na-dom-ufa0.ru/narkolog-na-dom-kruglosutochno-ufa/
Близкий человек в запое? Не ждите ухудшения. Обратитесь в клинику — здесь проведут профессиональный вывод из запоя с последующим восстановлением организма.
Получить профессиональную консультацию – vyvod-iz-zapoya-kruglosutochno rostov-na-donu
Если пациент находится в критическом состоянии, не осознаёт происходящее, проявляет агрессию или, наоборот, впадает в апатию, не стоит ждать — необходимо вызвать нарколога немедленно.
Выяснить больше – частный нарколог на дом
Близкий человек в запое? Не ждите ухудшения. Обратитесь в клинику — здесь проведут профессиональный вывод из запоя с последующим восстановлением организма.
Изучите внимательнее – вывод из запоя капельница в ростове-на-дону
Клиника «НаркологикПлюс» предоставляет квалифицированную помощь нарколога на дому в Воронеже. Если вы или ваши близкие столкнулись с последствиями длительного употребления алкоголя или наркотиков, наши специалисты готовы оперативно выехать и оказать экстренную помощь. Мы проводим детоксикацию организма, снимаем симптомы абстинентного синдрома и стабилизируем состояние пациента, обеспечивая высокий уровень безопасности, строгую анонимность и индивидуальный подход.
Выяснить больше – https://narcolog-na-dom-voronezh0.ru/zapoj-narkolog-na-dom-voronezh/
Самостоятельно выйти из запоя — почти невозможно. В Ростове-На-Дону врачи клиники проводят медикаментозный вывод из запоя с круглосуточным выездом. Доверяйте профессионалам.
Слушай внимательно — тут важно – https://vyvod-iz-zapoya-rostov16.ru
Если вы ищете вывод из запоя в стационаре в Балашихе, ознакомьтесь с предложением Частного Медика 24 на сайте.
Расширить кругозор по теме – вывод из запоя на дому в балашихе
Когда организм на пределе, важна срочная помощь в Ростове-На-Дону — это команда опытных наркологов, которые помогут быстро и мягко выйти из запоя без вреда для здоровья.
Узнать больше – вывод из запоя клиника город ростов-на-дону
Наши специалисты используют проверенные и сертифицированные медикаменты, которые подбираются индивидуально для каждого пациента:
Получить дополнительную информацию – posle-kapelniczy-ot-zapoya nizhnij novgorod
Услуга
Узнать больше – https://kapelnica-ot-zapoya-nizhniy-novgorod000.ru/vyzvat-kapelniczu-ot-zapoya-nizhnij-novgorod
После поступления вызова наш нарколог выезжает к пациенту в кратчайшие сроки, прибывая по адресу в пределах 30–60 минут. Специалист начинает процедуру с подробного осмотра и диагностики, измеряя ключевые показатели организма: артериальное давление, частоту пульса, насыщенность кислородом и собирая подробный анамнез.
Подробнее тут – вызов врача нарколога на дом в новосибирске
Если вовремя не принять меры, состояние может усугубиться, повышая риск серьёзных осложнений. Наиболее эффективным способом очищения организма является постановка капельницы, которая помогает быстро стабилизировать состояние. Клиника «Курс на ясность» оказывает экстренную наркологическую помощь с выездом врачей на дом 24/7.
Выяснить больше – капельница от запоя анонимно красноярск
В Балашихе клиника Частный Медик 24 предлагает эффективный вывод из запоя в стационаре — подробности на сайте клиники.
Расширить кругозор по теме – вывод из запоя на дому город балашиха
Врачи клиники «ВитаЛайн» для снятия интоксикации и облегчения состояния пациента применяют исключительно качественные и проверенные лекарственные препараты, подбирая их в зависимости от особенностей ситуации и состояния здоровья пациента:
Подробнее можно узнать тут – вызов врача нарколога на дом
Клиника Частный Медик?24 в Коломне — профессиональная капельница от запоя в стационаре, смотрите страницу услуги.
Подробнее можно узнать тут – postavit-kapelniczu-ot-zapoya kolomna
20
Исследовать вопрос подробнее – капельница от запоя вызов в коломне
Лечение проводится непосредственно в домашних условиях, что позволяет избежать стресса, связанного с пребыванием в стационаре. Применение современных медикаментов и индивидуальный подход к выбору терапии обеспечивают безопасность и эффективность процедуры.
Ознакомиться с деталями – психиатр нарколог на дом иркутск
Игнорирование этих симптомов или попытки самолечения могут привести к серьезным осложнениям. Своевременная установка капельницы на дому позволяет быстро улучшить состояние пациента и минимизировать последствия запоя.
Исследовать вопрос подробнее – после капельницы от запоя в нижний новгороде
Стационарный вывод из запоя в Балашихе — лечение в Частном Медике 24, переходите по ссылке на страницу услуги.
Хочешь знать всё? – вывод из запоя на дому цена город балашиха
Воспользуйтесь капельницей от запоя в стационаре в Частном Медике?24 (Коломна) — подробнее по ссылке.
Детальнее – капельница от запоя цена в коломне
Ищете капельницу от запоя в стационаре в Коломне? Посмотрите предложение Частного Медика?24 по ссылке.
Ознакомиться с деталями – после капельницы от запоя
Алкогольная зависимость сопровождается не только физическими, но и глубокими психоэмоциональными проблемами. Психотерапевтическая помощь играет важную роль в лечении, помогая пациенту осознать причины зависимости и разработать стратегии для предотвращения рецидивов.
Детальнее – https://narcolog-na-dom-ufa0.ru/narkolog-na-dom-ufa-czeny/
В Ростове-На-Дону решение есть — наркологическая клиника. Здесь помогают людям выйти из запоя без страха и осуждения. Всё анонимно, грамотно и с заботой о каждом пациенте.
Получить профессиональную консультацию – вывод из запоя недорого город ростов-на-дону
В Балашихе (будни и выходные): стационарный вывод из запоя в клинике Частный Медик 24 — переход по ссылке.
Подробнее можно узнать тут – vyvod-iz-zapoya-czena balashiha
Когда организм на пределе, важна срочная помощь в Ростове-На-Дону — это команда опытных наркологов, которые помогут быстро и мягко выйти из запоя без вреда для здоровья.
Изучите внимательнее – срочный вывод из запоя в ростове-на-дону
Когда организм на пределе, важна срочная помощь в Ростове-На-Дону — это команда опытных наркологов, которые помогут быстро и мягко выйти из запоя без вреда для здоровья.
Проверенные методы — узнай сейчас – vyvod-iz-zapoya-kruglosutochno rostov-na-donu
В таких случаях своевременное обращение за помощью позволяет быстро стабилизировать состояние и предотвратить развитие серьезных осложнений.
Получить дополнительную информацию – https://narcolog-na-dom-voronezh0.ru/narkolog-na-dom-anonimno-voronezh/
Затяжной запой опасен для жизни. Врачи наркологической клиники в Ростове-На-Дону проводят срочный вывод из запоя — на дому или в стационаре. Анонимно, безопасно, круглосуточно.
Изучите внимательнее – вывод из запоя на дому город ростов-на-дону
Врачи клиники «ВитаЛайн» для снятия интоксикации и облегчения состояния пациента применяют исключительно качественные и проверенные лекарственные препараты, подбирая их в зависимости от особенностей ситуации и состояния здоровья пациента:
Углубиться в тему – вызов нарколога на дом
Для проживающих в Балашихе: услуга стационарного вывода из запоя от Частного Медика 24 — переходите по ссылке.
Хочу знать больше – vyvod-iz-zapoya-klinika balashiha
Обращаясь за помощью в клинику «НаркоЩит», пациенты получают комплексное лечение, которое отличается следующими преимуществами:
Выяснить больше – kapelnicza-ot-zapoya nizhnij novgorod
Стоимость услуг по установке капельницы определяется индивидуально и зависит от нескольких факторов. В первую очередь, цена обусловлена тяжестью состояния пациента: при более сильной интоксикации и выраженных симптомах абстинентного синдрома может потребоваться расширенная терапия. Кроме того, итоговая сумма зависит от продолжительности запоя, так как длительное употребление спиртного ведет к более серьезному накоплению токсинов, требующему дополнительных лечебных мероприятий.
Подробнее – капельница от запоя вызов в нижний новгороде
Наркологическая клиника «АнтиДот» предлагает срочный вызов нарколога на дом в Воронеже и Воронежской области. Наша служба экстренной наркологической помощи доступна круглосуточно и позволяет быстро справиться с тяжелыми состояниями, вызванными алкогольной и наркотической зависимостью. Опытные врачи проведут детоксикацию организма, помогут снять абстинентный синдром и стабилизировать общее состояние пациента в комфортных домашних условиях.
Выяснить больше – нарколог на дом цена воронеж
В Балашихе клиника Частный Медик 24 предлагает эффективный вывод из запоя в стационаре — подробности на сайте клиники.
Хочу знать больше – вывод из запоя цена город балашиха
Клиника в Балашихе — Частный Медик 24: стационарный вывод из запоя с комфортом и медицинским сопровождением.
Посмотреть подробности – вывод из запоя цена московская область
Врачи клиники «ВитаЛайн» для снятия интоксикации и облегчения состояния пациента применяют исключительно качественные и проверенные лекарственные препараты, подбирая их в зависимости от особенностей ситуации и состояния здоровья пациента:
Подробнее – http://narcolog-na-dom-novosibirsk0.ru/narkolog-na-dom-czena-novosibirsk/
Надёжный вывод из запоя в клинике Частный Медик 24 (Балашиха) — полный стационарный курс, смотрите по ссылке.
Углубиться в тему – в балашихе
Наркологическая клиника «МедЛайн» предоставляет профессиональные услуги врача-нарколога с выездом на дом в Новосибирске и Новосибирской области. Мы оперативно помогаем пациентам справиться с тяжелыми состояниями при алкогольной и наркотической зависимости. Экстренный выезд наших специалистов доступен круглосуточно, а лечение проводится с применением проверенных методик и препаратов, что гарантирует безопасность и конфиденциальность каждому пациенту.
Углубиться в тему – вызов нарколога на дом в новосибирске
Медицинский вывод из запоя включает несколько обязательных этапов:
Подробнее – вывод из запоя на дому недорого
В этом информативном тексте представлены захватывающие события и факты, которые заставят вас задуматься. Мы обращаем внимание на важные моменты, которые часто остаются незамеченными, и предлагаем новые перспективы на привычные вещи. Подготовьтесь к тому, чтобы быть поглощенным увлекательными рассказами!
Осуществить глубокий анализ – https://bloomsbydreams.com/hello-world
Эта статья предлагает живое освещение актуальной темы с множеством интересных фактов. Мы рассмотрим ключевые моменты, которые делают данную тему важной и актуальной. Подготовьтесь к насыщенному путешествию по неизвестным аспектам и узнайте больше о значимых событиях.
Что ещё нужно знать? – https://kunstamedersee.de/?attachment_id=80
Эта публикация завернет вас в вихрь увлекательного контента, сбрасывая стереотипы и открывая двери к новым идеям. Каждый абзац станет для вас открытием, полным ярких примеров и впечатляющих достижений. Подготовьтесь быть вовлеченными и удивленными каждый раз, когда продолжите читать.
Практические советы ждут тебя – https://crossriver.ca/service/guided-rafting-trip-2
Публикация предлагает уникальную подборку информации, которая будет интересна как специалистам, так и широкому кругу читателей. Здесь вы найдете ответы на часто задаваемые вопросы и полезные инсайты для дальнейшего применения.
Почему это важно? – http://okashiyanon.com/2019/12/28/%E5%87%BA%E5%BA%97%E6%83%85%E5%A0%B1-20
В статье представлены ключевые моменты по актуальной теме, дополненные советами экспертов и ссылками на дополнительные ресурсы. Цель материала — дать читателю инструменты для самостоятельного развития и принятия осознанных решений.
Доступ к полной версии – https://orbithsa.com/index.php/2022/05/26/digital-marketing-explained
В этом информативном тексте представлены захватывающие события и факты, которые заставят вас задуматься. Мы обращаем внимание на важные моменты, которые часто остаются незамеченными, и предлагаем новые перспективы на привычные вещи. Подготовьтесь к тому, чтобы быть поглощенным увлекательными рассказами!
Узнай первым! – https://sciencefestiv.com/logo_sciencefestiv-2
В статье представлены ключевые моменты по актуальной теме, дополненные советами экспертов и ссылками на дополнительные ресурсы. Цель материала — дать читателю инструменты для самостоятельного развития и принятия осознанных решений.
Расширить кругозор по теме – https://f5fashion.vn/update-tor-hathaway-death-remembering-a-remarkable-life
Этот информативный текст выделяется своими захватывающими аспектами, которые делают сложные темы доступными и понятными. Мы стремимся предложить читателям глубину знаний вместе с разнообразием интересных фактов. Откройте новые горизонты и развивайте свои способности познавать мир!
Читать дальше – https://f5fashion.vn/update-aina-asif-swimming-pool-videos-and-photos-go-viral-on-twitter-reddit-tiktok-and-instagram
Мы предлагаем вам подробное руководство, основанное на проверенных источниках и реальных примерах. Каждая часть публикации направлена на то, чтобы помочь вам разобраться в сложных вопросах и применить знания на практике.
Смотрите также – https://www.hotel-sugano.com/bbs/sugano.cgi/sosh13.pascal.ru/forum/datasphere.ru/club/user/12/blog/2477/www.tovery.net/www.skitour.su/www.tovery.net/datasphere.ru/club/user/12/blog/2477/sugano.cgi?page40=val
Эта публикация завернет вас в вихрь увлекательного контента, сбрасывая стереотипы и открывая двери к новым идеям. Каждый абзац станет для вас открытием, полным ярких примеров и впечатляющих достижений. Подготовьтесь быть вовлеченными и удивленными каждый раз, когда продолжите читать.
Все материалы собраны здесь – http://www.komsmama.ru
Этот увлекательный информационный материал подарит вам массу новых знаний и ярких эмоций. Мы собрали для вас интересные факты и сведения, которые обогатят ваш опыт. Откройте для себя увлекательный мир информации и насладитесь процессом изучения!
Почему это важно? – https://f5fashion.vn/update-is-annette-goerner-leaving-ctv-news-where-is-she-going-2
Эта обзорная заметка содержит ключевые моменты и факты по актуальным вопросам. Она поможет читателям быстро ориентироваться в теме и узнать о самых важных аспектах сегодня. Получите краткий курс по современной информации и оставайтесь в курсе событий!
Узнай первым! – https://www.sendmecashtoday.ca/2025/03/24/installment-loans-in-halifax
Публикация приглашает вас исследовать неизведанное — от древних тайн до современных достижений науки. Вы узнаете, как случайные находки превращались в революции, а смелые мысли — в новые эры человеческого прогресса.
Осуществить глубокий анализ – https://kunstamedersee.de/?attachment_id=80
Мы собрали для вас самые захватывающие факты из мира науки и истории. От малознакомых деталей до грандиозных событий — эта статья расширит ваш кругозор и подарит новое понимание того, как устроен наш мир.
Это стоит прочитать полностью – http://www.sifd.eu/?p=10437
В рамках детоксикации применяются капельничные инфузии, содержащие необходимые электролиты, витамины и современные препараты, позволяющие эффективно очистить кровь, а постоянный и тщательный контроль жизненных показателей пациента обеспечивает максимальную безопасность проводимой процедуры и позволяет оперативно корректировать дозировку лекарственных средств по мере необходимости, учитывая индивидуальные особенности организма и реакцию на терапию.
Углубиться в тему – http://vyvod-iz-zapoya-novokuznetsk66.ru
Публикация приглашает вас исследовать неизведанное — от древних тайн до современных достижений науки. Вы узнаете, как случайные находки превращались в революции, а смелые мысли — в новые эры человеческого прогресса.
Нажми и узнай всё – https://www.lematriotisme.com/fr/blog-fr2/item/510-le-couronnement-de-l-oeuvre?start=547560
В статье представлены ключевые моменты по актуальной теме, дополненные советами экспертов и ссылками на дополнительные ресурсы. Цель материала — дать читателю инструменты для самостоятельного развития и принятия осознанных решений.
Как достичь результата? – https://saudeenergize.store/hello-world
Эта информационная статья содержит полезные факты, советы и рекомендации, которые помогут вам быть в курсе последних тенденций и изменений в выбранной области. Материал составлен так, чтобы быть полезным и понятным каждому.
Все материалы собраны здесь – https://f5fashion.vn/chia-se-voi-hon-76-ve-hinh-nen-dep-cho-zalo-moi-nhat
Этот увлекательный информационный материал подарит вам массу новых знаний и ярких эмоций. Мы собрали для вас интересные факты и сведения, которые обогатят ваш опыт. Откройте для себя увлекательный мир информации и насладитесь процессом изучения!
Неизвестные факты о… – https://custom-home-builders-sacramento.com/custom-home-builders-in-sacramento-3
В этой публикации мы предлагаем подробные объяснения по актуальным вопросам, чтобы помочь читателям глубже понять их. Четкость и структурированность материала сделают его удобным для усвоения и применения в повседневной жизни.
Обратитесь за информацией – https://cookesrecipes.com/rice-krispie-chocolate-chip-cookies
Публикация предлагает уникальную подборку информации, которая будет интересна как специалистам, так и широкому кругу читателей. Здесь вы найдете ответы на часто задаваемые вопросы и полезные инсайты для дальнейшего применения.
Доступ к полной версии – https://f5fashion.vn/tong-hop-hon-77-ve-hinh-nen-desktop-tot-cho-mat
Для устойчивого отказа от вредных привычек применяется кодирование — метод, основанный на психологическом воздействии, а также заместительная терапия, при которой пациент получает контролируемые дозы препаратов, снижающих ломку и тягу.
Ознакомиться с деталями – https://narkologicheskaya-klinika-mariupol13.ru/platnaya-narkologicheskaya-klinika-mariupol/
Метод лечения
Получить дополнительные сведения – http://narkologicheskaya-klinika-rostov-na-donu13.ru
Во время инфузий врач непрерывно отслеживает артериальное давление, частоту сердечных сокращений и диурез. Это позволяет моментально реагировать на любые изменения и корректировать терапию.
Выяснить больше – http://lechenie-narkomanii-mariupol13.ru/
Клиника «ВолгаМед» в Волгограде обеспечивает круглосуточную анонимную помощь людям, столкнувшимся с алкогольной или наркотической зависимостью. Мы предлагаем как стационарное лечение в комфортных условиях, так и выезд врача на дом в любое время суток. Конфиденциальность, профессионализм и индивидуальный подход — ключевые принципы нашей работы. В этой статье подробно рассмотрим преимущества клиники, спектр услуг, порядок организации домашнего выезда специалистов и дополнительные возможности поддержки в период реабилитации.
Узнать больше – http://narkologicheskaya-klinika-volgograd13.ru/
Самостоятельно выйти из запоя — почти невозможно. В Ростове-На-Дону врачи клиники проводят медикаментозный вывод из запоя с круглосуточным выездом. Доверяйте профессионалам.
Дополнительно читайте здесь – вывод из запоя капельница
Когда запой становится критическим, оперативное вмешательство имеет решающее значение для спасения здоровья и предотвращения необратимых последствий. Во Владимире экстренная помощь нарколога на дому позволяет быстро начать лечение, не требуя госпитализации, что особенно важно для пациентов, нуждающихся в сохранении конфиденциальности и комфорте.
Разобраться лучше – http://
Когда организм на пределе, важна срочная помощь в Ростове-На-Дону — это команда опытных наркологов, которые помогут быстро и мягко выйти из запоя без вреда для здоровья.
Познакомиться с результатами исследований – срочный вывод из запоя в ростове-на-дону
При длительном запое в организме накапливаются вредные токсины, что ведёт к нарушениям работы сердца, печени, почек и других жизненно важных органов. Чем быстрее начинается терапия, тем выше шансы избежать серьёзных осложнений и обеспечить качественное восстановление. Метод капельничного лечения позволяет оперативно начать детоксикацию, что особенно важно для спасения жизни и предупреждения хронических последствий злоупотребления алкоголем.
Получить дополнительные сведения – капельница от запоя тюмень
Близкий человек в запое? Не ждите ухудшения. Обратитесь в клинику — здесь проведут профессиональный вывод из запоя с последующим восстановлением организма.
Изучите внимательнее – vyvod-iz-zapoya-kruglosutochno rostov-na-donu
В обычных условиях цена услуги составляет от 1500 до 2500 рублей. Эта сумма включает выезд специалиста, первичный осмотр и базовую детоксикационную терапию.
Получить дополнительные сведения – https://vyvod-iz-zapoya-vladimir00.ru/vyvod-iz-zapoya-anonimno-vladimir/
Комплексное лечение на дому организовано по четкой схеме, состоящей из последовательных этапов. Каждый из них направлен на быстрое восстановление нормального функционирования организма.
Подробнее можно узнать тут – https://vyvod-iz-zapoya-vladimir0.ru/vyvod-iz-zapoya-anonimno-vladimir/
В Ростове-На-Дону решение есть — наркологическая клиника. Здесь помогают людям выйти из запоя без страха и осуждения. Всё анонимно, грамотно и с заботой о каждом пациенте.
Не пропусти важное – вывод из запоя в стационаре
Клиника «РостовМед» предлагает профессиональную наркологическую помощь в Ростове и области в режиме 24/7. Наша команда готова выехать на дом к пациенту в любое время суток, обеспечивая анонимность и высокие медицинские стандарты. В основе работы — индивидуальный подход, современное оборудование и чётко отлаженные протоколы детоксикации, что позволяет безопасно вывести пациента из запоя и начать этап реабилитации без стресса госпитализации.
Узнать больше – https://narkologicheskaya-klinika-rostov13.ru/psikhiatricheskaya-narkologicheskaya-klinika-v-rostove/
Когда запой приводит к критическому ухудшению состояния, оперативное лечение становится жизненно необходимым. В Тюмени доступна услуга капельничного вывода из запоя на дому, которая позволяет начать детоксикацию организма незамедлительно и в комфортной для пациента обстановке. Такой формат терапии помогает не только вывести токсины, но и значительно снизить риск осложнений, сохраняя при этом полную конфиденциальность.
Подробнее тут – https://kapelnica-ot-zapoya-tyumen0.ru/kapelnicza-ot-zapoya-na-domu-czena-tyumen
Этот увлекательный информационный материал подарит вам массу новых знаний и ярких эмоций. Мы собрали для вас интересные факты и сведения, которые обогатят ваш опыт. Откройте для себя увлекательный мир информации и насладитесь процессом изучения!
Ознакомьтесь с аналитикой – https://f5fashion.vn/co-be-ma-hong-mirai-chan-den-ha-noi
Капельницы с растворами электролитов, витаминов, глюкозы и гепатопротекторов обеспечивают быстрое восстановление водно-солевого баланса, детоксикацию и поддержку печени. Инфузионное лечение позволяет нормализовать артериальное давление и сердечный ритм.
Подробнее – вывод из запоя капельница в ростове-на-дону
Нарколог прибывает в течение 30 минут, оснащённый переносным оборудованием: портативным электрокардиографом, спирометром, прибором для измерения сатурации, набором необходимых медикаментов и расходных материалов. На первом этапе проводится замер давления, пульса, температуры и сатурации, берётся капиллярная проба крови для экспресс-анализа глюкозы и электролитов.
Подробнее – http://
Стационарный вывод из запоя в Балашихе — лечение в Частном Медике 24, переходите по ссылке на страницу услуги.
Хочешь знать всё? – наркология вывод из запоя
Подробнее о методах лечения и поддержке можно узнать на портале Минздрава РФ, где представлены стандарты оказания медицинской помощи зависимым пациентам.
Детальнее – https://narkolog-na-dom-volgograd13.ru/narkolog-na-dom-czeny-volgograd
Услуга стационарного вывода из запоя от Частного Медика 24 в Балашихе — подробнее на странице предложения.
Изучить материалы по теме – вывод из запоя на дому
Без квалифицированного врачебного контроля организм подвергается чрезмерному и опасному стрессу, что может приводить к крайне критическим и непредсказуемым последствиям; при длительном и регулярном употреблении алкоголя происходит адаптация физиологических процессов к постоянному присутствию этанола, и когда эта неестественная поддержка внезапно исчезает, центральная нервная система и внутренние органы реагируют крайне остро, что может вызвать серьезные сбои и осложнения
Детальнее – vivod iz zapoya arhangelsk
Метод лечения
Подробнее тут – https://narkologicheskaya-klinika-rostov-na-donu13.ru/psikhiatricheskaya-narkologicheskaya-klinika-v-rostove
Надёжная капельница от запоя в стационаре в клинике Частный Медик?24 (Коломна) — полный курс лечения, узнайте больше.
Подробнее – капельница от запоя выезд коломна
Воспользуйтесь капельницей от запоя в стационаре в Частном Медике?24 (Коломна) — подробнее по ссылке.
Углубиться в тему – после капельницы от запоя коломна
Основные методы, используемые в клинике, включают медикаментозную детоксикацию, психотерапевтические программы и реабилитационные мероприятия. Медикаментозное выведение токсинов из организма проводится с применением сертифицированных препаратов под строгим контролем врачей. Подробности о методах медикаментозной детоксикации представлены на сайте Министерства здравоохранения РФ.
Подробнее можно узнать тут – наркологическая клиника наркологический центр ростов-на-дону
Когда состояние пациента критическое и невозможно транспортировать его в стационар, мы оказываем помощь на дому:
Подробнее – частная наркологическая клиника волгоград
В Коломне клиника Частный Медик?24 предлагает капельницу от запоя в стационаре — подробности на сайте клиники.
Исследовать вопрос подробнее – вызвать капельницу от запоя в коломне
В Коломне клиника Частный Медик?24 предлагает капельницу от запоя в стационаре — подробности на сайте клиники.
Выяснить больше – врач на дом капельница от запоя коломна
Когда запой становится критическим, оперативное вмешательство имеет решающее значение для спасения здоровья и предотвращения необратимых последствий. Во Владимире экстренная помощь нарколога на дому позволяет быстро начать лечение, не требуя госпитализации, что особенно важно для пациентов, нуждающихся в сохранении конфиденциальности и комфорте.
Получить дополнительную информацию – вывод из запоя дешево владимир
На этом этапе основной целью является быстрое выведение токсинов и стабилизация обменных процессов в организме. Используются современные препараты, которые помогают снизить концентрацию алкоголя в крови и восстановить работу внутренних органов.
Подробнее – вывод из запоя в архангельске
Затяжной запой опасен для жизни. Врачи наркологической клиники в Ростове-На-Дону проводят срочный вывод из запоя — на дому или в стационаре. Анонимно, безопасно, круглосуточно.
Не пропусти важное – наркологический вывод из запоя в ростове-на-дону
Затяжной запой опасен для жизни. Врачи наркологической клиники в Ростове-На-Дону проводят срочный вывод из запоя — на дому или в стационаре. Анонимно, безопасно, круглосуточно.
Дополнительно читайте здесь – http://vyvod-iz-zapoya-rostov16.ru
Комплексное лечение на дому организовано по строго отлаженной схеме, позволяющей оперативно стабилизировать состояние пациента и провести качественную детоксикацию.
Ознакомиться с деталями – https://vyvod-iz-zapoya-vladimir00.ru
Комплексное лечение на дому организовано по четкой схеме, состоящей из последовательных этапов. Каждый из них направлен на быстрое восстановление нормального функционирования организма.
Подробнее тут – нарколог на дом вывод из запоя на дому
Когда запой превращается в угрозу для жизни, оперативное вмешательство становится критически важным. В Тюмени, Тюменская область, опытные наркологи предлагают услугу установки капельницы от запоя прямо на дому. Такой метод позволяет начать детоксикацию с использованием современных медикаментов, что способствует быстрому выведению токсинов, восстановлению обменных процессов и нормализации работы внутренних органов. Лечение на дому обеспечивает комфортную обстановку, полную конфиденциальность и индивидуальный подход к каждому пациенту.
Детальнее – капельница от запоя стоимость в тюмени
Врач уточняет, как долго продолжается запой, какие симптомы наблюдаются и присутствуют ли сопутствующие заболевания. Тщательный сбор информации позволяет оперативно подобрать необходимые медикаменты и начать детоксикацию.
Узнать больше – после капельницы от запоя на дому в тюмени
Узнайте про выведение из запоя в стационаре в Частном Медике 24 (Балашиха) по ссылке.
Детальнее – http://vyvod-iz-zapoya-v-stacionare-balashiha11.ru
Стационарный вывод из запоя в Балашихе — лечение в Частном Медике 24, переходите по ссылке на страницу услуги.
Узнайте всю правду – вывод из запоя город балашиха
Самостоятельные попытки внезапного отказа от алкоголя в состоянии запоя, без надлежащего медицинского наблюдения и поддержки, чреваты развитием опасных осложнений, таких как мучительные судороги, угрожающие гипертонические кризы, неконтролируемые панические атаки и даже тяжелый алкогольный психоз, требующий немедленной госпитализации
Ознакомиться с деталями – анонимный вывод из запоя архангельск
Обращаясь в «ВолгаМед», вы получаете:
Разобраться лучше – наркологические клиники алкоголизм в волгограде
Психотерапия применяется для коррекции поведенческих расстройств и укрепления мотивации к трезвости. Среди эффективных методик — когнитивно-поведенческая терапия и групповая психотерапия. Современные подходы к психотерапии зависимости можно изучить в публикациях Психологического института РАН.
Получить больше информации – http://narkologicheskaya-klinika-rostov-na-donu13.ru
Затяжной запой опасен для жизни. Врачи наркологической клиники в Ростове-На-Дону проводят срочный вывод из запоя — на дому или в стационаре. Анонимно, безопасно, круглосуточно.
Узнать больше – ростов-на-дону.
После первичного осмотра начинается активная фаза детоксикации. Современные препараты вводятся капельничным методом для быстрого снижения уровня токсинов в крови и восстановления обменных процессов. Этот этап критически важен для нормализации работы печени, почек и сердечно-сосудистой системы.
Разобраться лучше – http://vyvod-iz-zapoya-vladimir000.ru/srochnyj-vyvod-iz-zapoya-vladimir/
Самостоятельно выйти из запоя — почти невозможно. В Ростове-На-Дону врачи клиники проводят медикаментозный вывод из запоя с круглосуточным выездом. Доверяйте профессионалам.
Углубиться в тему – вывод из запоя на дому город ростов-на-дону
Когда организм на пределе, важна срочная помощь в Ростове-На-Дону — это команда опытных наркологов, которые помогут быстро и мягко выйти из запоя без вреда для здоровья.
Узнать больше – вывод из запоя цена
Системы автоматизированного дозирования обеспечивают точное введение медикаментов, что минимизирует риск побочных эффектов. Постоянный мониторинг жизненно важных показателей позволяет врачу корректировать терапию в режиме реального времени, гарантируя безопасность процедуры.
Получить больше информации – вывод из запоя дешево владимир
В Балашихе клиника Частный Медик 24 предлагает эффективный вывод из запоя в стационаре — подробности на сайте клиники.
Осуществить глубокий анализ – вывод из запоя капельница в балашихе
В обычных условиях цена услуги составляет от 1500 до 2500 рублей. Эта сумма включает выезд специалиста, первичный осмотр и базовую детоксикационную терапию.
Получить дополнительную информацию – https://vyvod-iz-zapoya-vladimir00.ru
Наркологическая клиника «Код здоровья» в Архангельске предлагает круглосуточную, оперативную и высококвалифицированную помощь, обеспечивая как лечение на дому, в привычной для пациента обстановке, так и в условиях комфортабельного стационара для пациентов с особенно тяжёлыми формами алкогольной интоксикации, требующими постоянного медицинского контроля и интенсивной терапии
Подробнее – нарколог вывод из запоя архангельск
Врач уточняет продолжительность запоя, характер употребляемого алкоголя и наличие сопутствующих заболеваний. Детальное обследование позволяет оперативно подобрать необходимые медикаменты и минимизировать риск осложнений.
Подробнее можно узнать тут – https://kapelnica-ot-zapoya-tyumen00.ru/kapelnicza-ot-zapoya-na-domu-tyumen/
Услуга стационарного вывода из запоя от Частного Медика 24 в Балашихе — подробнее на странице предложения.
Изучить материалы по теме – балашиха
Лечение начинается с капельниц для вывода продуктов распада алкоголя, восстановления водно-электролитного баланса и поддержки работы органов под наблюдением врачей
Получить больше информации – https://vyvod-iz-zapoya-krasnoyarsk66.ru/vyvod-iz-zapoya-na-domu-krasnoyarsk
После первичной диагностики начинается активная фаза детоксикации. Современные препараты вводятся капельничным методом, что позволяет быстро вывести токсины и восстановить нормальные обменные процессы. Этот этап критически важен для стабилизации работы печени, почек и сердечно-сосудистой системы.
Получить больше информации – стоимость капельницы от запоя тюмень
Выездная бригада «РостовМед» оснащена всем необходимым для оказания экстренной помощи и проведения полного курса детоксикации на дому. Процесс состоит из нескольких этапов:
Выяснить больше – http://narkologicheskaya-klinika-rostov13.ru/chastnaya-narkologicheskaya-klinika-v-rostove/
Ищете капельницу от запоя в стационаре в Коломне? Посмотрите предложение Частного Медика?24 по ссылке.
Получить дополнительную информацию – капельница от запоя на дому московская область
В Коломне Частный Медик?24: стационарная капельница от запоя с медицинским сопровождением — переходите на страницу.
Углубиться в тему – postavit-kapelniczu-ot-zapoya kolomna
В Коломне клиника Частный Медик?24 предлагает капельницу от запоя в стационаре — подробности на сайте клиники.
Подробнее тут – капельница от запоя наркология в коломне
Психотерапия применяется для коррекции поведенческих расстройств и укрепления мотивации к трезвости. Среди эффективных методик — когнитивно-поведенческая терапия и групповая психотерапия. Современные подходы к психотерапии зависимости можно изучить в публикациях Психологического института РАН.
Разобраться лучше – http://narkologicheskaya-klinika-rostov-na-donu13.ru/narkologicheskaya-klinika-v-rostove/
В Коломне Частный Медик?24: стационарная капельница от запоя с медицинским сопровождением — переходите на страницу.
Ознакомиться с деталями – капельница от запоя в коломне
На этом этапе основной целью является быстрое выведение токсинов и стабилизация обменных процессов в организме. Используются современные препараты, которые помогают снизить концентрацию алкоголя в крови и восстановить работу внутренних органов.
Углубиться в тему – вывод из запоя недорого в архангельске
Незамедлительно после вызова нарколог прибывает на дом для проведения тщательного осмотра. На данном этапе специалист собирает анамнез, измеряет жизненно важные показатели — пульс, артериальное давление, температуру — и оценивает степень интоксикации. Эти данные являются основой для составления индивидуального плана лечения.
Исследовать вопрос подробнее – http://vyvod-iz-zapoya-vladimir000.ru
Домашний формат подходит при: длительном запое (более 48 часов), выраженной интоксикации без судорог и психотических симптомов, невозможности или нежелании пациента ехать в стационар, необходимости срочной психологической стабилизации. Также вызов на дом показан тем, кто желает анонимности и минимального вмешательства в рабочий и семейный график.
Получить дополнительную информацию – http://narkolog-na-dom-rostov-na-donu13.ru/narkolog-na-dom-kruglosutochno-rostov/
Алкогольный запой — это не просто следствие длительного употребления спиртного, а критическое состояние, которое, если оставить его без своевременного квалифицированного медицинского вмешательства, может привести к крайне серьезным и даже необратимым последствиям для здоровья и жизни человека, затрагивая практически все системы организма
Детальнее – клиника вывод из запоя архангельск
В Ростове-На-Дону решение есть — наркологическая клиника. Здесь помогают людям выйти из запоя без страха и осуждения. Всё анонимно, грамотно и с заботой о каждом пациенте.
Проверенные методы — узнай сейчас – вывод из запоя на дому город ростов-на-дону
Для проживающих в Балашихе: услуга стационарного вывода из запоя от Частного Медика 24 — переходите по ссылке.
Подробнее можно узнать тут – вывод из запоя клиника в балашихе
Подробнее о методах лечения и поддержке можно узнать на портале Минздрава РФ, где представлены стандарты оказания медицинской помощи зависимым пациентам.
Получить дополнительные сведения – https://narkolog-na-dom-volgograd13.ru/narkolog-na-dom-kruglosutochno-volgograd/
В Балашихе клиника Частный Медик 24 предлагает эффективный вывод из запоя в стационаре — подробности на сайте клиники.
Детальнее – вывод из запоя анонимно
Системы автоматизированного дозирования обеспечивают точное введение медикаментов, что минимизирует риск побочных эффектов. Постоянный мониторинг жизненно важных показателей позволяет врачу корректировать терапию в режиме реального времени, гарантируя безопасность процедуры.
Получить больше информации – вывод из запоя в владимире
Самостоятельно выйти из запоя — почти невозможно. В Ростове-На-Дону врачи клиники проводят медикаментозный вывод из запоя с круглосуточным выездом. Доверяйте профессионалам.
Раскрыть тему полностью – вывод из запоя капельница
Формирование цены на вызов нарколога с проведением капельничного вывода из запоя зависит от нескольких ключевых параметров:
Получить больше информации – vyvod-iz-zapoya-vladimir00.ru/
Когда запой превращается в угрозу для жизни, оперативное вмешательство становится критически важным. В Тюмени, Тюменская область, опытные наркологи предлагают услугу установки капельницы от запоя прямо на дому. Такой метод позволяет начать детоксикацию с использованием современных медикаментов, что способствует быстрому выведению токсинов, восстановлению обменных процессов и нормализации работы внутренних органов. Лечение на дому обеспечивает комфортную обстановку, полную конфиденциальность и индивидуальный подход к каждому пациенту.
Углубиться в тему – http://kapelnica-ot-zapoya-tyumen00.ru/
Капельницы с растворами электролитов, витаминов, глюкозы и гепатопротекторов обеспечивают быстрое восстановление водно-солевого баланса, детоксикацию и поддержку печени. Инфузионное лечение позволяет нормализовать артериальное давление и сердечный ритм.
Получить дополнительные сведения – нарколог вывод из запоя
Самостоятельно выйти из запоя — почти невозможно. В Ростове-На-Дону врачи клиники проводят медикаментозный вывод из запоя с круглосуточным выездом. Доверяйте профессионалам.
Слушай внимательно — тут важно – rostov-na-donu
Процесс вывода из запоя капельничным методом организован по строгой схеме, позволяющей обеспечить максимальную эффективность терапии. Каждая стадия направлена на комплексное восстановление организма и минимизацию риска осложнений.
Получить дополнительные сведения – капельница от запоя тюменская область
Метод лечения
Детальнее – https://narkologicheskaya-klinika-rostov-na-donu13.ru/narkologicheskaya-klinika-v-rostove
Чтобы обеспечить максимально безопасный и эффективный, а также поэтапный и контролируемый выход из запоя, крайне важно как можно скорее обратиться к квалифицированным специалистам, которые на основе тщательной диагностики определят оптимальный индивидуальный курс лечения, учитывая текущее физическое и психическое состояние пациента, наличие сопутствующих заболеваний и степень алкогольной зависимости
Узнать больше – http://vyvod-iz-zapoya-arkhangelsk6.ru/vyvod-iz-zapoya-klinika-arkhangelsk/
Клиника в Балашихе — Частный Медик 24: стационарный вывод из запоя с комфортом и медицинским сопровождением.
Осуществить глубокий анализ – https://vyvod-iz-zapoya-v-stacionare-balashiha11.ru
Клиника Частный Медик 24 в Балашихе — профессиональный стационарный вывод из запоя, подробности на сайте.
Расширить кругозор по теме – в балашихе
Использование автоматизированных систем дозирования обеспечивает точное введение лекарственных средств, что минимизирует риск передозировки и побочных эффектов. Постоянный мониторинг жизненно важных показателей позволяет врачу оперативно корректировать дозировки и адаптировать терапию под динамику состояния пациента.
Разобраться лучше – https://vyvod-iz-zapoya-vladimir000.ru/vyvod-iz-zapoya-anonimno-vladimir
В Ростове-На-Дону решение есть — наркологическая клиника. Здесь помогают людям выйти из запоя без страха и осуждения. Всё анонимно, грамотно и с заботой о каждом пациенте.
Углубиться в тему – vyvod-iz-zapoya-na-domu rostov-na-donu
Самостоятельно выйти из запоя — почти невозможно. В Ростове-На-Дону врачи клиники проводят медикаментозный вывод из запоя с круглосуточным выездом. Доверяйте профессионалам.
Переходите по ссылке ниже – наркология вывод из запоя город ростов-на-дону
Ищете капельницу от запоя в стационаре в Коломне? Посмотрите предложение Частного Медика?24 по ссылке.
Углубиться в тему – капельница от запоя анонимно коломна
Надёжная капельница от запоя в стационаре в клинике Частный Медик?24 (Коломна) — полный курс лечения, узнайте больше.
Получить дополнительные сведения – капельница от запоя цена коломна
Публикация приглашает вас исследовать неизведанное — от древних тайн до современных достижений науки. Вы узнаете, как случайные находки превращались в революции, а смелые мысли — в новые эры человеческого прогресса.
Смотри, что ещё есть – https://www.icnhindi.com/2017/12/01/%E0%A4%B2%E0%A4%96%E0%A4%A8%E0%A4%8A-%E0%A4%95%E0%A5%8B-%E0%A4%AA%E0%A4%B9%E0%A4%B2%E0%A5%80-%E0%A4%AC%E0%A4%BE%E0%A4%B0-%E0%A4%AE%E0%A4%BF%E0%A4%B2%E0%A5%80-%E0%A4%AE%E0%A4%B9%E0%A4%BF%E0%A4%B2
В этой статье вы найдете познавательную и занимательную информацию, которая поможет вам лучше понять мир вокруг. Мы собрали интересные данные, которые вдохновляют на размышления и побуждают к действиям. Открывайте новую информацию и получайте удовольствие от чтения!
Лучшее решение — прямо здесь – https://f5fashion.vn/trai-binh-bat-day-ap-tuoi-tho-cua-nguoi-mien-tay
Эта информационная заметка содержит увлекательные сведения, которые могут вас удивить! Мы собрали интересные факты, которые сделают вашу жизнь ярче и полнее. Узнайте нечто новое о привычных аспектах повседневности и откройте для себя удивительный мир информации.
Погрузиться в детали – https://yoursurprises.com.au/product/wall-flower-silver-small
В этом информативном тексте представлены захватывающие события и факты, которые заставят вас задуматься. Мы обращаем внимание на важные моменты, которые часто остаются незамеченными, и предлагаем новые перспективы на привычные вещи. Подготовьтесь к тому, чтобы быть поглощенным увлекательными рассказами!
Расширить кругозор по теме – https://starseniorcenter.org/star-banner100h
В статье представлены ключевые моменты по актуальной теме, дополненные советами экспертов и ссылками на дополнительные ресурсы. Цель материала — дать читателю инструменты для самостоятельного развития и принятия осознанных решений.
Все материалы собраны здесь – https://f5fashion.vn/chi-tiet-61-ve-hinh-nen-hoa-bi-ngan-dep-nhat
Эта статья предлагает уникальную подборку занимательных фактов и необычных историй, которые вы, возможно, не знали. Мы постараемся вдохновить ваше воображение и разнообразить ваш кругозор, погружая вас в мир, полный интересных открытий. Читайте и открывайте для себя новое!
Подробнее можно узнать тут – https://f5fashion.vn/top-61-ve-anh-dep-thien-nhien-buon
1. Приём заявки и уточнение состояния пациента по телефону. 2. Сбор анамнеза, адреса и времени для выезда. 3. Формирование медицинской бригады с необходимыми препаратами. 4. Прибытие на дом и проведение первичного осмотра. 5. Проведение инфузионной терапии и наблюдение.
Изучить вопрос глубже – вывод из запоя на дому круглосуточно мариуполь
Эта информационная заметка содержит увлекательные сведения, которые могут вас удивить! Мы собрали интересные факты, которые сделают вашу жизнь ярче и полнее. Узнайте нечто новое о привычных аспектах повседневности и откройте для себя удивительный мир информации.
Разобраться лучше – http://us.angile-led.com/%E5%85%AC%E5%8F%B8%E6%8C%AA%E5%A8%81as%E5%85%AC%E5%8F%B8%E4%B8%8E%E9%99%95%E8%A5%BF%E5%AE%89%E6%8D%B7%E4%B8%BE%E8%A1%8C%E7%8B%AC%E5%AE%B6%E9%94%80%E5%94%AE%E4%BB%A3%E7%90%86%E5%8D%8F%E8%AE%AE
В этом информативном тексте представлены захватывающие события и факты, которые заставят вас задуматься. Мы обращаем внимание на важные моменты, которые часто остаются незамеченными, и предлагаем новые перспективы на привычные вещи. Подготовьтесь к тому, чтобы быть поглощенным увлекательными рассказами!
Детальнее – https://www.kerrywills.ie/what-is-the-purpose-of-an-executor
Эта публикация дает возможность задействовать различные источники информации и представить их в удобной форме. Читатели смогут быстро найти нужные данные и получить ответы на интересующие их вопросы. Мы стремимся к четкости и доступности материала для всех!
Посмотреть подробности – https://f5fashion.vn/top-52-ve-hinh-nen-dep-cho-nam-gioi-moi-nhat
Этот информативный текст выделяется своими захватывающими аспектами, которые делают сложные темы доступными и понятными. Мы стремимся предложить читателям глубину знаний вместе с разнообразием интересных фактов. Откройте новые горизонты и развивайте свои способности познавать мир!
Ознакомьтесь с аналитикой – https://footcare-tajima.com/2021/03/29/hello-world
Публикация приглашает вас исследовать неизведанное — от древних тайн до современных достижений науки. Вы узнаете, как случайные находки превращались в революции, а смелые мысли — в новые эры человеческого прогресса.
Ознакомиться с деталями – http://isuzu-kuban.ru
Этот информативный текст отличается привлекательным содержанием и актуальными данными. Мы предлагаем читателям взглянуть на привычные вещи под новым углом, предоставляя интересный и доступный материал. Получите удовольствие от чтения и расширьте кругозор!
Выяснить больше – https://f5fashion.vn/den-hoa-da-trach-ngoi-den-tho-chu-dong-tu-mot-trong-tu-bat-tu
В этой статье представлен занимательный и актуальный контент, который заставит вас задуматься. Мы обсуждаем насущные вопросы и проблемы, а также освещаем истории, которые вдохновляют на действия и изменения. Узнайте, что стоит за событиями нашего времени!
Изучить вопрос глубже – https://www.hotel-sugano.com/bbs/sugano.cgi/www.skitour.su/datasphere.ru/club/user/12/blog/2477/www.skitour.su/www.tovery.net/sinopipefittings.com/sugano.cgi?page10=val
Эта публикация дает возможность задействовать различные источники информации и представить их в удобной форме. Читатели смогут быстро найти нужные данные и получить ответы на интересующие их вопросы. Мы стремимся к четкости и доступности материала для всех!
Неизвестные факты о… – https://f5fashion.vn/top-voi-hon-55-ve-hinh-nen-iphone-bi-vo-hieu-hoa-moi-nhat
Эта информационная заметка содержит увлекательные сведения, которые могут вас удивить! Мы собрали интересные факты, которые сделают вашу жизнь ярче и полнее. Узнайте нечто новое о привычных аспектах повседневности и откройте для себя удивительный мир информации.
Не пропусти важное – https://cruisecontrolcruises.co.uk/page/32
Эта обзорная заметка содержит ключевые моменты и факты по актуальным вопросам. Она поможет читателям быстро ориентироваться в теме и узнать о самых важных аспектах сегодня. Получите краткий курс по современной информации и оставайтесь в курсе событий!
Что ещё нужно знать? – https://hopsentertainment.id/10-key-steps-to-launching-a-successful-startup
В этой статье-обзоре мы соберем актуальную информацию и интересные факты, которые освещают важные темы. Читатели смогут ознакомиться с различными мнениями и подходами, что позволит им расширить кругозор и глубже понять обсуждаемые вопросы.
Подробнее можно узнать тут – https://f5fashion.vn/tong-hop-54-ve-ao-khoac-vest-blazer-nu
В этой информационной статье вы найдете интересное содержание, которое поможет вам расширить свои знания. Мы предлагаем увлекательный подход и уникальные взгляды на обсуждаемые темы, побуждая пользователей к активному мышлению и критическому анализу.
Нажми и узнай всё – https://ascensomonarca.com/index.php/2023/08/21/connecting-with-natures-tranquil-essence
Мы предлагаем вам подробное руководство, основанное на проверенных источниках и реальных примерах. Каждая часть публикации направлена на то, чтобы помочь вам разобраться в сложных вопросах и применить знания на практике.
Читать дальше – https://f5fashion.vn/ban-gai-quang-hai-chuong-mac-goi-cam-ton-nui-doi-muon-dang-tran
Публикация приглашает вас исследовать неизведанное — от древних тайн до современных достижений науки. Вы узнаете, как случайные находки превращались в революции, а смелые мысли — в новые эры человеческого прогресса.
Что ещё нужно знать? – https://p-estate.ru
Эта информационная статья содержит полезные факты, советы и рекомендации, которые помогут вам быть в курсе последних тенденций и изменений в выбранной области. Материал составлен так, чтобы быть полезным и понятным каждому.
Секреты успеха внутри – https://ho.gctu.edu.gh/2021/03/04/hello-world
Для срочных случаев клиника поддерживает круглосуточный режим приёма заявок. После оформления вызова диспетчер передаёт информацию бригаде, и в течение часа врач прибудет по указанному адресу.
Исследовать вопрос подробнее – вывод из запоя вызов в мариуполе
При поступлении вызова нарколог незамедлительно приезжает на дом для проведения детального первичного осмотра. Врач собирает краткий анамнез, измеряет жизненно важные показатели — пульс, артериальное давление, температуру — и оценивает степень алкогольной интоксикации. Эти данные являются основой для разработки индивидуального плана лечения, позволяющего подобрать наиболее эффективные методы детоксикации.
Подробнее тут – вывод из запоя на дому тула.
В клинике применяются комплексные программы, включающие медицинскую детоксикацию, психотерапевтическую поддержку и социальную реабилитацию. Медицинская детоксикация проводится с использованием современных препаратов и методик, что позволяет снизить тяжесть абстинентного синдрома и минимизировать риски для здоровья пациента. Подробнее о методах детоксикации можно узнать на официальном портале Министерства здравоохранения России.
Получить дополнительные сведения – https://narkologicheskaya-klinika-chelyabinsk13.ru/
В современных условиях лечение алкогольной и наркотической зависимости требует комплексного подхода и быстрого реагирования. Нарколог на дом в Челябинске — это услуга, позволяющая получить квалифицированную помощь без необходимости посещения медицинского учреждения. Такая форма оказания медицинской помощи особенно актуальна для пациентов с острыми состояниями, а также тех, кто нуждается в анонимности и комфорте домашней обстановки.
Изучить вопрос глубже – вызов нарколога на дом в челябинске
Квалифицированный нарколог при вызове на дом в Волгограде выполняет следующие задачи:
Выяснить больше – narkolog-na-dom-volgograd13.ru/
Сильная тошнота, рвота, дезориентация и судорожные сокращения мышц свидетельствуют о критическом уровне алкоголя в крови. В этих ситуациях промедление повышает риск острого панкреатита, комы и сердечных аритмий.
Исследовать вопрос подробнее – http://vivod-iz-zapoya-chelyabinsk13.ru
В «ЧелябДокторе» применяются комбинированные схемы, основанные на доказательной медицине и новейших разработках:
Ознакомиться с деталями – https://kapelnica-ot-zapoya-chelyabinsk13.ru
Наша клиника работает по стандартам международного уровня, сочетая научно обоснованные методики с внимательным отношением к каждому пациенту. В «ВолгаМед» вы не столкнётесь с бюрократией или очередями — помощь оказывается сразу после обращения, а все процедуры проводятся в строгом соответствии с медицинскими протоколами и этическими нормами.
Выяснить больше – наркологическая клиника лечение алкоголизма волгоград
Сразу после поступления вызова нарколог прибывает на дом для проведения детального первичного осмотра. Врач собирает краткий анамнез, измеряет жизненно важные показатели, такие как пульс, артериальное давление и температура, и оценивает степень интоксикации. Эта информация является фундаментом для разработки индивидуального плана терапии, который учитывает особенности состояния пациента.
Ознакомиться с деталями – https://vyvod-iz-zapoya-tula000.ru/vyvod-iz-zapoya-anonimno-tula/
Работа врача начинается с детального сбора анамнеза: выясняются длительность запоя, объёмы употреблённого алкоголя, сопутствующие заболевания и аллергические реакции. Затем специалист измеряет давление, пульс, сатурацию и температуру, после чего подбирает оптимальный протокол детоксикации.
Узнать больше – вывод из запоя реутов стационар
Существуют определённые признаки, свидетельствующие о необходимости срочного обращения за профессиональной помощью:
Получить больше информации – вызвать вывод из запоя
Первый шаг в лечении — это тщательный осмотр специалиста. Наряду с измерением жизненно важных показателей (пульс, артериальное давление, температура) врач проводит сбор анамнеза, выясняя длительность запоя, тип употребляемого алкоголя и наличие сопутствующих заболеваний. Эти данные помогают оценить степень интоксикации и подобрать индивидуальный план терапии, что является ключевым для дальнейшей эффективной детоксикации.
Разобраться лучше – https://vyvod-iz-zapoya-yaroslavl0.ru/vyvod-iz-zapoya-czena-yaroslavl/
Своевременный выезд нарколога снижает риск осложнений и ускоряет вывод из запоя, а под контролем профессионала каждая процедура проходит максимально безопасно.
Исследовать вопрос подробнее – vyvod iz zapoya kruglosutochno
Услуга вывода из запоя на дому в Туле представляет собой комплекс мер, направленных на экстренную детоксикацию организма при алкогольной интоксикации. При вызове нарколога специалист прибывает в течение короткого времени, проводит первичный осмотр, собирает анамнез и определяет степень интоксикации. На основе полученной информации разрабатывается индивидуальный план лечения, который может включать медикаментозную детоксикацию, капельничное введение препаратов и психотерапевтическую поддержку.
Подробнее тут – vyvod-iz-zapoya-klinika tula
Алкогольная зависимость — хроническое заболевание, требующее комплексного подхода. В клинике «КубаньМед» в Краснодаре разработаны авторские методики, направленные на полное преодоление зависимости и возвращение пациента к полноценной жизни. Мы предлагаем индивидуальные программы лечения, сочетающие медикаментозную детоксикацию, специализированные реабилитационные процедуры и профессиональные психологические консультации. Всё это в условиях полного комфорта и абсолютной конфиденциальности.
Выяснить больше – klinika lecheniya alkogolizma krasnodar
После оформления заявки по телефону или на сайте оператор уточняет адрес и текущее состояние пациента. В критических ситуациях врач может прибыть в течение 60 минут, в стандартном режиме — за 1–2 часа. На месте проводится сбор анамнеза и оценка жизненных показателей: артериального давления, пульса, сатурации и температуры тела. Затем выбирается оптимальный протокол детоксикации — «мягкий» метод для постепенного выведения токсинов или экспресс-методика при острой интоксикации. Процедура капельного введения комбинированного раствора длится от двух до четырёх часов: специалист контролирует состояние пациента, корректирует дозировки и при необходимости вводит корригирующие препараты. По окончании врач оставляет детальный план поддерживающей терапии, включающий рекомендации по питанию, приёму сорбентов и витаминов, а также график повторных осмотров.
Разобраться лучше – http://narkolog-na-dom-ramenskoe4.ru
Наркологическая клиника в Екатеринбурге уделяет большое внимание психотерапевтическим методам. Индивидуальный подход к пациенту позволяет выявить причины и особенности зависимости, сформировать устойчивую мотивацию на лечение и отказ от вредных привычек.
Получить дополнительные сведения – chastnaya narkologicheskaya klinika ekaterinburg
Длительное употребление алкоголя негативно сказывается на состоянии организма, приводя к тяжелой интоксикации, обезвоживанию и нарушениям работы внутренних органов. Самостоятельный выход из запоя часто сопровождается сильным похмельем, скачками давления, головной болью, тошнотой и тревожностью.
Ознакомиться с деталями – http://kapelnica-ot-zapoya-moskva0.ru/kapelnicza-ot-zapoya-czena-msk/
Чем раньше начинается профессиональная детоксикация, тем меньше вероятность развития тяжёлых осложнений, таких как судорожный синдром, отёк мозга, острый панкреатит или некроз печени.
Узнать больше – платная наркологическая клиника
После обращения в клинику пациент получает первую подробную консультацию — это может быть очный визит, звонок или заявка через сайт. При необходимости организуется экстренное поступление или выезд нарколога на дом: врач приезжает с полным набором оборудования и медикаментов для оказания неотложной помощи. На первом этапе проводится диагностика: анализы крови, ЭКГ, осмотр профильных специалистов, дополнительное обследование по показаниям. Это позволяет точно определить степень зависимости, выявить осложнения и подобрать эффективную тактику лечения.
Изучить вопрос глубже – наркологическая клиника клиника помощь
На данном этапе специалист уточняет, как долго продолжается запой, какой вид алкоголя употребляется и имеются ли сопутствующие заболевания. Тщательный анализ информации позволяет оперативно определить степень интоксикации и выбрать оптимальные методы терапии для быстрого и безопасного вывода из запоя.
Получить больше информации – вывод из запоя в стационаре в туле
Когда запой угрожает здоровью, каждая минута имеет решающее значение. В Ярославле квалифицированные специалисты по наркологии оказывают помощь на дому, позволяя оперативно начать лечение алкогольной интоксикации и вывести токсины из организма. Такой формат терапии обеспечивает комфортные условия для пациента, максимальную конфиденциальность и индивидуальный подход, что особенно важно для быстрого и безопасного восстановления здоровья.
Подробнее можно узнать тут – vyvod-iz-zapoya-klinika jaroslavl’
Лечение алкоголизма в Краснодаре представляет собой комплекс мероприятий, направленных на полное восстановление физического и психологического состояния пациента. Этот процесс требует профессионального подхода, включающего диагностику, детоксикацию, терапию зависимости и реабилитацию. Информация о современных методах терапии доступна на официальном портале Минздрава РФ.
Детальнее – http://
Своевременный вызов специалиста особенно важен при следующих признаках:
Подробнее можно узнать тут – https://vyvod-iz-zapoya-mariupol13.ru/vyvod-iz-zapoya-kruglosutochno-mariupol
В течение процедуры пациент находится под непрерывным наблюдением: внутривенные капельницы с регидратационными растворами, витаминно-минеральными комплексами и гепатопротекторами обеспечивают восстановление функций печени, нормализацию обменных процессов и поддержку работы сердечно-сосудистой системы. При необходимости к лечению привлекаются узкопрофильные врачи — кардиолог, невролог или терапевт — что делает процесс максимально комплексным. По завершении выведения из запоя врач предоставляет подробный план поддерживающей терапии с рекомендациями по питанию, питьевому режиму и графику повторных консультаций.
Получить дополнительную информацию – https://vyvod-iz-zapoya-reutov4.ru/
Наркологическая клиника в Челябинске предоставляет полный спектр медицинских услуг по диагностике, лечению и реабилитации пациентов с зависимостями различной этиологии. Современные методы терапии, применяемые в клинике, направлены на безопасное и эффективное избавление от наркотической и алкогольной зависимости, а также сопутствующих психических и соматических осложнений.
Ознакомиться с деталями – http://narkologicheskaya-klinika-chelyabinsk13.ru/platnaya-narkologicheskaya-klinika-chelyabinsk/
Вывод из запоя в Орехово-Зуево — это профессиональная экстренная помощь, предоставляемая наркологической клиникой «Гармония-Мед» на дому или в условиях современного стационара. Запой — тяжёлое состояние, при котором организм подвергается многодневному отравлению этанолом и продуктами его распада. Это критический момент в развитии алкогольной зависимости, опасный как для физического, так и для психического здоровья. Только своевременное и квалифицированное вмешательство позволяет предотвратить тяжёлые осложнения и вернуть пациента к полноценной жизни.
Выяснить больше – вывода из запоя орехово
Вызов нарколога на дом в Челябинске обеспечивает возможность проведения полного обследования и первичной терапии в условиях, привычных для пациента. Специалисты оказывают услуги круглосуточно, что позволяет своевременно купировать острые состояния, связанные с алкогольной интоксикацией, абстинентным синдромом или осложнениями наркозависимости.
Изучить вопрос глубже – нарколог на дом круглосуточно цены в челябинске
Нарколог на дом в Волгограде — это специализированная медицинская услуга, направленная на оказание квалифицированной помощи пациентам с зависимостями в привычной домашней обстановке. Такая форма лечения позволяет снизить стресс, связанный с госпитализацией, и обеспечивает более комфортное проведение медицинских процедур. Вызов нарколога на дом пользуется высокой востребованностью как среди пациентов с алкоголизмом, так и среди людей, страдающих от наркотической зависимости, а также при острых состояниях, требующих неотложного вмешательства.
Изучить вопрос глубже – narkolog-na-dom-volgograd13.ru/
Запой — это длительный приступ непрерывного употребления алкоголя, когда человек теряет контроль над количеством выпиваемого, что приводит к серьёзному отравлению организма. Нарушение водно-солевого баланса, угнетение центральной нервной системы и риск сердечно-сосудистых осложнений требуют немедленного вмешательства. В Челябинске клиника «ЧелябМед» предлагает круглосуточную неотложную помощь на дому и в условиях стационара, гарантируя полную анонимность и комфорт пациенту.
Получить больше информации – https://vivod-iz-zapoya-chelyabinsk13.ru/vyvod-iz-zapoya-czena-chelyabinsk
Каждый пациент уникален — именно поэтому мы не применяем «типовых» решений. После первичной консультации и диагностики специалисты «КубаньМед» разрабатывают персональную программу, учитывающую состояние здоровья, психологические особенности и социальные обстоятельства пациента.
Исследовать вопрос подробнее – https://lechenie-alkogolizma-krasnodar0.ru/klinika-lecheniya-alkogolizma-krasnodar/
Мы предлагаем полный цикл наркологической помощи — от экстренного вывода из запоя до длительной реабилитации. Ниже перечислены основные направления работы клиники.
Углубиться в тему – наркологическая клиника стационар в волгограде
В «ЧелябДокторе» применяются комбинированные схемы, основанные на доказательной медицине и новейших разработках:
Детальнее – врач на дом капельница от запоя челябинск
На данном этапе специалист уточняет, как долго продолжается запой, какой вид алкоголя употребляется и имеются ли сопутствующие заболевания. Тщательный анализ информации позволяет оперативно определить степень интоксикации и выбрать оптимальные методы терапии для быстрого и безопасного вывода из запоя.
Получить дополнительные сведения – вывод из запоя на дому круглосуточно в туле
Подробности о методах детоксикации и профилактике абстиненции можно найти на сайте Национального института по борьбе с зависимостями США (NIDA). В ходе детоксикации применяется мониторинг жизненных показателей, что обеспечивает безопасность пациента. Своевременная медицинская помощь при абстинентном синдроме предотвращает развитие тяжелых осложнений, включая судороги и сердечно-сосудистые кризы.
Получить дополнительные сведения – бесплатная наркологическая клиника
Выбирая лечение в «Наркосфере», пациенты Балашихи и Балашихинского района могут быть уверены в высоком качестве услуг и современном подходе. Здесь применяют только сертифицированные препараты, используются новейшие методы терапии и реабилитации. Клиника работает круглосуточно, принимает пациентов в любой день недели и всегда готова к экстренному реагированию. Индивидуальный подход проявляется не только в подборе схемы лечения, но и в поддержке семьи на каждом этапе выздоровления. Весь процесс проходит в обстановке полной конфиденциальности: сведения о пациентах не передаются в сторонние организации, не оформляется наркологический учёт.
Получить дополнительную информацию – частная наркологическая клиника
Нельзя игнорировать первые признаки серьёзного алкогольного отравления: промедление повышает риск судорожных припадков, остановки дыхания и комы. Нарколог на дом в Реутове рекомендован при следующих симптомах:
Детальнее – vyvod iz zapoya reutov
Вывод из запоя в Реутове — это экстренная комплексная помощь при алкогольной интоксикации, направленная на быстрое и безопасное выведение токсинов из организма, восстановление водно-электролитного баланса и купирование опасных симптомов абстинентного синдрома. В наркологической клинике «Феникс-Мед» вы можете заказать выезд квалифицированного врача на дом или пройти лечение в стационаре, доверив своё здоровье команде опытных специалистов.
Подробнее можно узнать тут – narkologiya vyvod iz zapoya
В таких случаях медлить нельзя — своевременный вызов нарколога может спасти жизнь и предотвратить тяжёлую инвалидизацию.
Подробнее можно узнать тут – вывод из запоя на дому цена
Наркологическая клиника в Жуковском — это круглосуточная служба экстренной и плановой помощи при алкогольной, наркотической и лекарственной зависимости. Наркологическая клиника «Север-Мед» сочетает современные методики детоксикации, медикаментозного и психологического кодирования, а также комплексный подход к последующей реабилитации. Мы работаем без выходных и праздников, чтобы вы могли получить профессиональную помощь в любое время суток.
Углубиться в тему – частная наркологическая клиника
Наши специалисты выезжают в любой район Москвы и ближайшего Подмосковья, чтобы помочь пациентам избежать осложнений и быстро прийти в норму после длительного запоя.
Подробнее тут – https://kapelnica-ot-zapoya-moskva0.ru/kapelnicza-ot-zapoya-na-domu-msk
В зависимости от степени выраженности абстинентного синдрома и наличия сопутствующих осложнений клиника «Азимут Здоровья» предлагает два основных формата оказания помощи, позволяющих оптимально сочетать эффективность лечения и комфорт пациента. Каждый вариант тщательно продуман: мы учитываем не только медицинские показания, но и личные предпочтения, чтобы вы или ваш близкий чувствовали себя максимально защищённо и спокойно. Оба формата подразумевают строгий контроль жизненных показателей и сопровождение на всех этапах — от первой капельницы до завершения курса поддерживающей терапии.
Разобраться лучше – нарколог на дом круглосуточно
Мы стремимся обеспечить пациентам максимальный уровень доверия и результативности лечения, сочетая передовые технологии и многолетний опыт специалистов:
Подробнее можно узнать тут – http://lechenie-alkogolizma-krasnodar0.ru
Важным этапом работы клиники является всесторонняя диагностика состояния пациента. Используются лабораторные и инструментальные методы обследования для оценки влияния токсических веществ на организм. Такой подход позволяет составить индивидуальный план лечения, максимально учитывающий особенности пациента и стадию зависимости. Подробные рекомендации по диагностике зависимости опубликованы на сайте ФГБУ «НМИЦ Психиатрии и наркологии» Минздрава России.
Детальнее – платная наркологическая клиника в челябинске
Среди преимуществ услуги:
Получить дополнительные сведения – вызов врача нарколога на дом в челябинске
Клиника специализируется на домашней детоксикации и стационарном лечении алкогольной зависимости. Основные направления работы:
Изучить вопрос глубже – вывод из запоя круглосуточно
Услуга вывода из запоя на дому в Туле разработана для тех, кто столкнулся с тяжелыми последствиями злоупотребления алкоголем. Основная цель – оперативная детоксикация организма, восстановление нормального обмена веществ и предотвращение дальнейших осложнений. Врач нарколог проводит полный комплекс обследований и назначает персонализированный план лечения, включающий медикаментозную терапию и психологическую поддержку, что позволяет обеспечить стабильное восстановление организма.
Исследовать вопрос подробнее – вывод из запоя на дому тула.
Ключевым этапом является снятие интоксикации и устранение абстинентного синдрома. Применяются препараты, направленные на нормализацию работы внутренних органов и поддержание общего состояния здоровья. Медикаментозная терапия включает назначение антидепрессантов, препаратов, блокирующих тягу к алкоголю, что подтверждается исследованиями, опубликованными на научном портале PubMed. Актуальные рекомендации по медикаментозному лечению алкоголизма доступны на Национальном центре здоровья.
Углубиться в тему – http://lechenie-alkogolizma-krasnodar00.ru
На данном этапе специалист уточняет, как долго продолжается запой, какой вид алкоголя употребляется и имеются ли сопутствующие заболевания. Тщательный анализ информации позволяет оперативно определить степень интоксикации и выбрать оптимальные методы терапии для быстрого и безопасного вывода из запоя.
Узнать больше – вывод из запоя капельница
Вывод из запоя на дому является необходимым мероприятием при возникновении тяжелых форм алкогольной интоксикации, когда самостоятельное прекращение употребления алкоголя становится невозможным. Если наблюдаются такие симптомы, как спутанность сознания, учащенный пульс, гипертония или снижение артериального давления, срочная помощь нарколога необходима для предотвращения серьезных осложнений. При раннем вмешательстве можно не только вывести токсины, но и стабилизировать работу жизненно важных органов, что существенно повышает шансы на полное восстановление.
Узнать больше – https://vyvod-iz-zapoya-yaroslavl0.ru/vyvod-iz-zapoya-czena-yaroslavl/
Судороги возникают из-за резкого исчезновения алкоголя как депрессанта при одновременном возбуждении нейрональных цепей. Без быстрого медицинского вмешательства возможен гипоксический инсульт.
Детальнее – https://vivod-iz-zapoya-chelyabinsk13.ru/vyvod-iz-zapoya-czena-chelyabinsk
Оказание наркологической помощи в домашних условиях имеет ряд нюансов. Пациент находится в знакомой среде, что снижает уровень тревоги и позволяет легче переносить лечебные процедуры. При этом специалист оснащён необходимым оборудованием для экстренной помощи, что важно при рисках осложнений. Поддержка близких дополнительно повышает эффективность терапии.
Ознакомиться с деталями – вызов врача нарколога на дом
Наши врачи имеют сертификаты Министерства здравоохранения РФ и европейские дипломы о дополнительном образовании. Это гарантирует, что вы получите помощь, основанную на последних исследованиях и передовых практиках наркологии.
Узнать больше – наркологическая клиника цены
Безопасный вывод токсинов из организма — первый и важнейший этап лечения в любой наркологической клинике. В Екатеринбурге процедура детоксикации проводится под круглосуточным контролем врачей, что минимизирует риски осложнений. Использование современных методов позволяет быстро нормализовать работу внутренних органов и систем, снизить выраженность синдрома отмены.
Углубиться в тему – наркологическая клиника цены екатеринбург
Каждый пациент проходит предварительное обследование: экспресс-анализ крови на электролиты, биохимия печени и почек, ЭКГ. На основании результатов врач формирует персональную программу инфузионной терапии.
Выяснить больше – https://kapelnica-ot-zapoya-chelyabinsk13.ru/postavit-kapelniczu-ot-zapoya-chelyabinsk
Услуга вывода из запоя на дому в Туле представляет собой комплекс мер, направленных на экстренную детоксикацию организма при алкогольной интоксикации. При вызове нарколога специалист прибывает в течение короткого времени, проводит первичный осмотр, собирает анамнез и определяет степень интоксикации. На основе полученной информации разрабатывается индивидуальный план лечения, который может включать медикаментозную детоксикацию, капельничное введение препаратов и психотерапевтическую поддержку.
Исследовать вопрос подробнее – вывод из запоя недорого
Своевременный выезд нарколога снижает риск осложнений и ускоряет вывод из запоя, а под контролем профессионала каждая процедура проходит максимально безопасно.
Разобраться лучше – http://vyvod-iz-zapoya-reutov4.ru
Первичный осмотр включает измерение давления, температуры, уровня глюкозы и сатурации, анализ неврологического статуса, оценку степени обезвоживания и интоксикации. Далее формируется индивидуальный план инфузионной терапии: капельницы с солевыми, глюкозными, витаминными, гепатопротекторными и седативными препаратами. При необходимости применяются современные противосудорожные и нейропротекторные средства, кислородная поддержка.
Углубиться в тему – вывод из запоя на дому недорого
В малых группах пациенты учатся взаимодействию и поддержке друг друга, что укрепляет мотивацию. Арт-терапевтические занятия помогают выразить эмоции через творчество и снизить уровень внутреннего напряжения.
Изучить вопрос глубже – клиника лечения алкоголизма краснодар.
Вывод из запоя на дому в Туле осуществляется по строго отлаженной схеме, которая включает несколько последовательных этапов. Такой комплексный подход позволяет не только быстро вывести токсины из организма, но и обеспечить всестороннюю поддержку пациента, включая психологическую реабилитацию.
Получить больше информации – http://vyvod-iz-zapoya-tula00.ru
Своевременный вызов нарколога позволяет снизить риски осложнений, таких как судорожный синдром, панкреатит или сердечная недостаточность, часто сопровождающие тяжелое алкогольное или наркотическое отравление. По данным исследований, раннее вмешательство сокращает сроки госпитализации и улучшает прогнозы выздоровления.
Узнать больше – http://
Вид услуги
Углубиться в тему – наркологическая клиника нарколог в челябинске
Для срочных случаев клиника поддерживает круглосуточный режим приёма заявок. После оформления вызова диспетчер передаёт информацию бригаде, и в течение часа врач прибудет по указанному адресу.
Подробнее можно узнать тут – https://vyvod-iz-zapoya-mariupol13.ru/vyvod-iz-zapoya-kapelnicza-mariupol
Процесс вывода из запоя на дому в Ярославле строится по четко отлаженной схеме, включающей несколько последовательных этапов, направленных на максимально быстрое и безопасное восстановление здоровья пациента.
Получить больше информации – вывод из запоя недорого в ярославле
Пациенты могут воспринимать окружающих как врагов, отказываться от помощи. Стресс от изоляции дома усугубляет состояние без профессиональной поддержки.
Углубиться в тему – https://vivod-iz-zapoya-chelyabinsk13.ru/narkolog-vyvod-iz-zapoya-chelyabinsk/
Нельзя игнорировать первые признаки серьёзного алкогольного отравления: промедление повышает риск судорожных припадков, остановки дыхания и комы. Нарколог на дом в Реутове рекомендован при следующих симптомах:
Детальнее – vyvod-iz-zapoya-reutov4.ru/
Чтобы вызвать нарколога на дом, достаточно позвонить по специализированным горячим телефонам или оформить заявку на сайте. Специалисты быстро реагируют на обращения, проводят первичную оценку и выезжают в течение часа. Важным аспектом является наличие лицензии и квалификации у медицинского персонала, что гарантирует безопасность и эффективность лечения.
Выяснить больше – нарколог на дом цены волгоград
Наркологическая клиника в Екатеринбурге занимается широким спектром услуг, включающих как экстренную помощь, так и длительную реабилитацию пациентов с зависимостью. Ключевыми направлениями являются:
Узнать больше – https://narcologicheskaya-klinika-ekaterinburg00.ru/
Нельзя игнорировать первые признаки серьёзного алкогольного отравления: промедление повышает риск судорожных припадков, остановки дыхания и комы. Нарколог на дом в Реутове рекомендован при следующих симптомах:
Получить больше информации – vyvod iz zapoya v reutovo
Наши врачи имеют сертификаты Министерства здравоохранения РФ и европейские дипломы о дополнительном образовании. Это гарантирует, что вы получите помощь, основанную на последних исследованиях и передовых практиках наркологии.
Получить дополнительную информацию – запой наркологическая клиника
Каждый пациент проходит предварительное обследование: экспресс-анализ крови на электролиты, биохимия печени и почек, ЭКГ. На основании результатов врач формирует персональную программу инфузионной терапии.
Подробнее можно узнать тут – http://kapelnica-ot-zapoya-chelyabinsk13.ru
Использование автоматизированных систем дозирования обеспечивает точное введение медикаментов, минимизируя риск передозировки и побочных эффектов. Постоянный мониторинг жизненно важных показателей позволяет врачу оперативно корректировать терапевтическую схему, адаптируя её к изменяющемуся состоянию пациента и обеспечивая максимальную безопасность лечения.
Детальнее – наркологический вывод из запоя тула
Основной этап, направленный на очищение организма от продуктов распада алкоголя и нормализацию функций внутренних органов. Применяются современные препараты с антиоксидантным и гепатопротекторным эффектом.
Изучить вопрос глубже – https://lechenie-alkogolizma-krasnodar0.ru/lechenie-khronicheskogo-alkogolizma-krasnodar/
Не откладывайте обращение к специалисту, если вы или ваши близкие столкнулись с:
Выяснить больше – платная наркологическая клиника
Капельница от запоя — это быстрый и безопасный способ вывести токсины, восстановить водно-солевой баланс и улучшить общее самочувствие. Наркологи клиники «ТрезвоКлиник» оказывают круглосуточную медицинскую помощь на дому, используя только сертифицированные препараты и проверенные методики детоксикации.
Ознакомиться с деталями – https://kapelnica-ot-zapoya-moskva0.ru/kapelnicza-ot-zapoya-czena-msk/
Вывод из запоя в Орехово-Зуево — это профессиональная экстренная помощь, предоставляемая наркологической клиникой «Гармония-Мед» на дому или в условиях современного стационара. Запой — тяжёлое состояние, при котором организм подвергается многодневному отравлению этанолом и продуктами его распада. Это критический момент в развитии алкогольной зависимости, опасный как для физического, так и для психического здоровья. Только своевременное и квалифицированное вмешательство позволяет предотвратить тяжёлые осложнения и вернуть пациента к полноценной жизни.
Изучить вопрос глубже – https://vyvod-iz-zapoya-orekhovo-zuevo4.ru/vyvod-iz-zapoya-stacionar-v-orekhovo-zuevo/
Лечение алкоголизма в Краснодаре представляет собой комплекс мероприятий, направленных на полное восстановление физического и психологического состояния пациента. Этот процесс требует профессионального подхода, включающего диагностику, детоксикацию, терапию зависимости и реабилитацию. Информация о современных методах терапии доступна на официальном портале Минздрава РФ.
Получить больше информации – https://lechenie-alkogolizma-krasnodar00.ru/klinika-lecheniya-alkogolizma-krasnodar
В зависимости от степени выраженности абстинентного синдрома и наличия сопутствующих осложнений клиника «Азимут Здоровья» предлагает два основных формата оказания помощи, позволяющих оптимально сочетать эффективность лечения и комфорт пациента. Каждый вариант тщательно продуман: мы учитываем не только медицинские показания, но и личные предпочтения, чтобы вы или ваш близкий чувствовали себя максимально защищённо и спокойно. Оба формата подразумевают строгий контроль жизненных показателей и сопровождение на всех этапах — от первой капельницы до завершения курса поддерживающей терапии.
Подробнее тут – narkolog na dom nedorogo
Вызов нарколога на дом в Челябинске обеспечивает возможность проведения полного обследования и первичной терапии в условиях, привычных для пациента. Специалисты оказывают услуги круглосуточно, что позволяет своевременно купировать острые состояния, связанные с алкогольной интоксикацией, абстинентным синдромом или осложнениями наркозависимости.
Разобраться лучше – нарколог на дом вывод из запоя челябинск
Вид услуги
Подробнее – наркологическая клиника лечение алкоголизма
Доступность услуги и оперативность реагирования гарантируют, что помощь будет оказана в течение 30–60 минут после вызова. Это позволяет не только быстро начать детоксикацию, но и минимизировать риск развития осложнений, таких как повреждение печени, почек и сердечно-сосудистой системы.
Получить больше информации – вывод из запоя клиника
Нельзя игнорировать первые признаки серьёзного алкогольного отравления: промедление повышает риск судорожных припадков, остановки дыхания и комы. Нарколог на дом в Реутове рекомендован при следующих симптомах:
Подробнее – http://vyvod-iz-zapoya-reutov4.ru/anonimnyj-vyvod-iz-zapoya-v-reutove/
При глубокой алкогольной интоксикации запой может привести к серьёзным осложнениям — от обезвоживания и электролитного дисбаланса до острого алкогольного психоза. В Мариуполе клиника «Мариуполь без запоя» предлагает оперативную помощь на дому с выездом нарколога в течение 60 минут и круглосуточную поддержку. Пациент получает комплексное лечение без стресса госпитализации и в условиях полной конфиденциальности.
Изучить вопрос глубже – вывод из запоя капельница на дому
Длительный запой может привести к серьезным осложнениям, таким как повреждение печени, почек, сердечно-сосудистые нарушения и нервные расстройства. Чем быстрее начинается вывод из запоя, тем ниже риск развития хронических заболеваний. Срочный вызов нарколога на дом позволяет в первые часы кризиса начать детоксикацию, что существенно повышает шансы на полное восстановление организма. В условиях экстренной ситуации каждая минута имеет решающее значение, и своевременная помощь становится ключом к сохранению здоровья и жизни.
Получить дополнительные сведения – http://vyvod-iz-zapoya-tula00.ru/vyvod-iz-zapoya-na-domu-tula/
Мы стремимся обеспечить пациентам максимальный уровень доверия и результативности лечения, сочетая передовые технологии и многолетний опыт специалистов:
Получить больше информации – центр лечения алкоголизма
Использование автоматизированных систем дозирования позволяет точно подобрать необходимое количество медикаментов, минимизируя риск передозировки и побочных эффектов. Постоянный мониторинг жизненно важных показателей дает возможность врачу корректировать схему лечения в режиме реального времени, что повышает безопасность и эффективность процедуры.
Подробнее можно узнать тут – вывод из запоя на дому ярославская область
Пациенты могут воспринимать окружающих как врагов, отказываться от помощи. Стресс от изоляции дома усугубляет состояние без профессиональной поддержки.
Подробнее тут – http://vivod-iz-zapoya-chelyabinsk13.ru
Подробности о методах детоксикации и профилактике абстиненции можно найти на сайте Национального института по борьбе с зависимостями США (NIDA). В ходе детоксикации применяется мониторинг жизненных показателей, что обеспечивает безопасность пациента. Своевременная медицинская помощь при абстинентном синдроме предотвращает развитие тяжелых осложнений, включая судороги и сердечно-сосудистые кризы.
Исследовать вопрос подробнее – частная наркологическая клиника екатеринбург
Вывод из запоя в Орехово-Зуево — это профессиональная экстренная помощь, предоставляемая наркологической клиникой «Гармония-Мед» на дому или в условиях современного стационара. Запой — тяжёлое состояние, при котором организм подвергается многодневному отравлению этанолом и продуктами его распада. Это критический момент в развитии алкогольной зависимости, опасный как для физического, так и для психического здоровья. Только своевременное и квалифицированное вмешательство позволяет предотвратить тяжёлые осложнения и вернуть пациента к полноценной жизни.
Исследовать вопрос подробнее – https://vyvod-iz-zapoya-orekhovo-zuevo4.ru/anonimnyj-vyvod-iz-zapoya-v-orekhovo-zuevo
Чтобы вызвать нарколога на дом, достаточно позвонить по специализированным горячим телефонам или оформить заявку на сайте. Специалисты быстро реагируют на обращения, проводят первичную оценку и выезжают в течение часа. Важным аспектом является наличие лицензии и квалификации у медицинского персонала, что гарантирует безопасность и эффективность лечения.
Выяснить больше – http://narkolog-na-dom-volgograd13.ru
Каждый пациент проходит предварительное обследование: экспресс-анализ крови на электролиты, биохимия печени и почек, ЭКГ. На основании результатов врач формирует персональную программу инфузионной терапии.
Подробнее можно узнать тут – капельница от запоя недорого
Мы предлагаем полный цикл наркологической помощи — от экстренного вывода из запоя до длительной реабилитации. Ниже перечислены основные направления работы клиники.
Углубиться в тему – http://www.domen.ru
Врач уточняет, как долго продолжается запой, какой алкоголь употребляется, а также наличие сопутствующих заболеваний. Этот тщательный анализ позволяет оперативно подобрать оптимальные методы детоксикации и снизить риск осложнений.
Подробнее тут – http://vyvod-iz-zapoya-tula0.ru/vyvod-iz-zapoya-czena-tula/
Нельзя игнорировать первые признаки серьёзного алкогольного отравления: промедление повышает риск судорожных припадков, остановки дыхания и комы. Нарколог на дом в Реутове рекомендован при следующих симптомах:
Разобраться лучше – срочный вывод из запоя
В «Север-Мед» вы найдёте не только медицинскую, но и социальную поддержку: наши специалисты помогают восстановить утраченные навыки общения и трудоспособности. Родственники могут пройти семейное консультирование, где профессионалы подскажут, как построить эффективный диалог с зависимым и создать благоприятную среду для выздоровления.
Исследовать вопрос подробнее – narkologicheskaya klinika na dom
Обращение к врачу требуется в тех случаях, когда человек не может самостоятельно справиться с последствиями запоя, а отказ от медицинской помощи может привести к серьезным осложнениям.
Углубиться в тему – https://kapelnica-ot-zapoya-moskva0.ru/kapelnicza-ot-zapoya-anonimno-msk
Нельзя игнорировать первые признаки серьёзного алкогольного отравления: промедление повышает риск судорожных припадков, остановки дыхания и комы. Нарколог на дом в Реутове рекомендован при следующих симптомах:
Получить дополнительную информацию – срочный вывод из запоя
Основные задачи
Выяснить больше – https://lechenie-alkogolizma-krasnodar00.ru/lechenie-khronicheskogo-alkogolizma-krasnodar/
Основной этап, направленный на очищение организма от продуктов распада алкоголя и нормализацию функций внутренних органов. Применяются современные препараты с антиоксидантным и гепатопротекторным эффектом.
Углубиться в тему – принудительное лечение от алкоголизма
Наркологическая клиника в Екатеринбурге уделяет большое внимание психотерапевтическим методам. Индивидуальный подход к пациенту позволяет выявить причины и особенности зависимости, сформировать устойчивую мотивацию на лечение и отказ от вредных привычек.
Изучить вопрос глубже – бесплатная наркологическая клиника екатеринбург
Подробности можно найти на официальном сайте Министерства здравоохранения РФ, где описаны стандарты оказания наркологической помощи и рекомендации по лечению зависимости Минздрав РФ — наркологическая помощь.
Подробнее – нарколог на дом срочно
Вывод из запоя в Орехово-Зуево — это профессиональная экстренная помощь, предоставляемая наркологической клиникой «Гармония-Мед» на дому или в условиях современного стационара. Запой — тяжёлое состояние, при котором организм подвергается многодневному отравлению этанолом и продуктами его распада. Это критический момент в развитии алкогольной зависимости, опасный как для физического, так и для психического здоровья. Только своевременное и квалифицированное вмешательство позволяет предотвратить тяжёлые осложнения и вернуть пациента к полноценной жизни.
Получить дополнительные сведения – вывод из запоя цена
В клинике применяются комплексные программы, включающие медицинскую детоксикацию, психотерапевтическую поддержку и социальную реабилитацию. Медицинская детоксикация проводится с использованием современных препаратов и методик, что позволяет снизить тяжесть абстинентного синдрома и минимизировать риски для здоровья пациента. Подробнее о методах детоксикации можно узнать на официальном портале Министерства здравоохранения России.
Подробнее тут – наркологические клиники алкоголизм челябинск
Сразу после вызова нарколог прибывает на дом для проведения тщательного первичного осмотра. На этом этапе специалист собирает краткий анамнез, измеряет жизненно важные показатели – пульс, артериальное давление, температуру – и оценивает степень алкогольной интоксикации. Полученные данные служат основой для составления индивидуального плана лечения, позволяющего подобрать оптимальные методы детоксикации.
Детальнее – вывод из запоя цена в ярославле
Своевременный вызов специалиста особенно важен при следующих признаках:
Углубиться в тему – https://vyvod-iz-zapoya-mariupol13.ru/vyvod-iz-zapoya-kapelnicza-mariupol
В зависимости от степени выраженности абстинентного синдрома и наличия сопутствующих осложнений клиника «Азимут Здоровья» предлагает два основных формата оказания помощи, позволяющих оптимально сочетать эффективность лечения и комфорт пациента. Каждый вариант тщательно продуман: мы учитываем не только медицинские показания, но и личные предпочтения, чтобы вы или ваш близкий чувствовали себя максимально защищённо и спокойно. Оба формата подразумевают строгий контроль жизненных показателей и сопровождение на всех этапах — от первой капельницы до завершения курса поддерживающей терапии.
Выяснить больше – zapoj narkolog na dom
Пациенты могут воспринимать окружающих как врагов, отказываться от помощи. Стресс от изоляции дома усугубляет состояние без профессиональной поддержки.
Получить больше информации – вывод из запоя в стационаре
Каждый пациент проходит предварительное обследование: экспресс-анализ крови на электролиты, биохимия печени и почек, ЭКГ. На основании результатов врач формирует персональную программу инфузионной терапии.
Получить дополнительную информацию – капельница от запоя вызов город
Нарколог на дом в Волгограде — это специализированная медицинская услуга, направленная на оказание квалифицированной помощи пациентам с зависимостями в привычной домашней обстановке. Такая форма лечения позволяет снизить стресс, связанный с госпитализацией, и обеспечивает более комфортное проведение медицинских процедур. Вызов нарколога на дом пользуется высокой востребованностью как среди пациентов с алкоголизмом, так и среди людей, страдающих от наркотической зависимости, а также при острых состояниях, требующих неотложного вмешательства.
Подробнее можно узнать тут – нарколог на дом срочно в волгограде
Обращаясь в «ВолгаМед», вы получаете:
Исследовать вопрос подробнее – лечение в наркологической клинике в волгограде
При поступлении вызова нарколог незамедлительно приезжает на дом для проведения детального первичного осмотра. Врач собирает краткий анамнез, измеряет жизненно важные показатели — пульс, артериальное давление, температуру — и оценивает степень алкогольной интоксикации. Эти данные являются основой для разработки индивидуального плана лечения, позволяющего подобрать наиболее эффективные методы детоксикации.
Исследовать вопрос подробнее – http://vyvod-iz-zapoya-tula00.ru
Своевременный выезд нарколога снижает риск осложнений и ускоряет вывод из запоя, а под контролем профессионала каждая процедура проходит максимально безопасно.
Исследовать вопрос подробнее – вывод из запоя цена
Алкогольная зависимость — хроническое заболевание, требующее комплексного подхода. В клинике «КубаньМед» в Краснодаре разработаны авторские методики, направленные на полное преодоление зависимости и возвращение пациента к полноценной жизни. Мы предлагаем индивидуальные программы лечения, сочетающие медикаментозную детоксикацию, специализированные реабилитационные процедуры и профессиональные психологические консультации. Всё это в условиях полного комфорта и абсолютной конфиденциальности.
Подробнее – http://lechenie-alkogolizma-krasnodar0.ru/klinika-lecheniya-alkogolizma-krasnodar/
Сразу после поступления вызова нарколог прибывает на дом для проведения детального первичного осмотра. Врач собирает краткий анамнез, измеряет жизненно важные показатели, такие как пульс, артериальное давление и температура, и оценивает степень интоксикации. Эта информация является фундаментом для разработки индивидуального плана терапии, который учитывает особенности состояния пациента.
Разобраться лучше – https://vyvod-iz-zapoya-tula000.ru
Наркологическая клиника в Екатеринбурге занимается широким спектром услуг, включающих как экстренную помощь, так и длительную реабилитацию пациентов с зависимостью. Ключевыми направлениями являются:
Получить больше информации – наркологическая клиника екатеринбург
Существуют определённые признаки, свидетельствующие о необходимости срочного обращения за профессиональной помощью:
Получить больше информации – http://vyvod-iz-zapoya-orekhovo-zuevo4.ru/vyvod-iz-zapoya-na-domu-v-orekhovo-zuevo/
В течение процедуры пациент находится под непрерывным наблюдением: внутривенные капельницы с регидратационными растворами, витаминно-минеральными комплексами и гепатопротекторами обеспечивают восстановление функций печени, нормализацию обменных процессов и поддержку работы сердечно-сосудистой системы. При необходимости к лечению привлекаются узкопрофильные врачи — кардиолог, невролог или терапевт — что делает процесс максимально комплексным. По завершении выведения из запоя врач предоставляет подробный план поддерживающей терапии с рекомендациями по питанию, питьевому режиму и графику повторных консультаций.
Получить больше информации – http://vyvod-iz-zapoya-reutov4.ru
Подробности можно найти на официальном сайте Министерства здравоохранения РФ, где описаны стандарты оказания наркологической помощи и рекомендации по лечению зависимости Минздрав РФ — наркологическая помощь.
Получить больше информации – помощь нарколога на дому в челябинске
Клиника оснащена современным оборудованием для мониторинга состояния пациентов и проведения процедур с максимальной безопасностью. Врачебный состав состоит из опытных наркологов, психиатров и психологов, регулярно повышающих квалификацию и применяющих доказательные методы лечения. На портале Российской медицинской ассоциации наркологов можно ознакомиться с рекомендациями по стандартам оказания наркологической помощи.
Разобраться лучше – https://narkologicheskaya-klinika-chelyabinsk13.ru/platnaya-narkologicheskaya-klinika-chelyabinsk
Запой – это опасное состояние, при котором организм подвергается значительной токсической нагрузке, а длительное злоупотребление алкоголем приводит к нарушению работы внутренних органов и ухудшению общего самочувствия. В Ярославле качественная наркологическая помощь на дому становится спасением для пациентов, нуждающихся в оперативной детоксикации и стабилизации состояния. Такой формат лечения позволяет начать терапию в комфортной обстановке, сохраняя конфиденциальность и минимизируя стресс, связанный с посещением стационара.
Детальнее – вывод из запоя цена
Лечение алкоголизма в Краснодаре представляет собой комплекс мероприятий, направленных на полное восстановление физического и психологического состояния пациента. Этот процесс требует профессионального подхода, включающего диагностику, детоксикацию, терапию зависимости и реабилитацию. Информация о современных методах терапии доступна на официальном портале Минздрава РФ.
Узнать больше – https://lechenie-alkogolizma-krasnodar00.ru/metody-lecheniya-alkogolizma-krasnodar
Детоксикация производится как внутривенно — капельницы с регидратационными растворима, гепатопротекторами и сорбентами — так и аппаратным методом (плазмаферез, гемодиализ). Мы используем только современные одноразовые инфузионные системы и высококачественные лекарственные растворы, что гарантирует безопасность и максимальную эффективность процедур.
Подробнее можно узнать тут – http://narkologicheskaya-klinika-zhukovskij4.ru/
Пациенты могут воспринимать окружающих как врагов, отказываться от помощи. Стресс от изоляции дома усугубляет состояние без профессиональной поддержки.
Подробнее тут – вывод из запоя дешево
Использование автоматизированных систем дозирования обеспечивает точное введение медикаментов, минимизируя риск передозировки и побочных эффектов. Постоянный мониторинг жизненно важных показателей позволяет врачу оперативно корректировать терапевтическую схему, адаптируя её к изменяющемуся состоянию пациента и обеспечивая максимальную безопасность лечения.
Подробнее – вывод из запоя тула
Длительное употребление алкоголя негативно сказывается на состоянии организма, приводя к тяжелой интоксикации, обезвоживанию и нарушениям работы внутренних органов. Самостоятельный выход из запоя часто сопровождается сильным похмельем, скачками давления, головной болью, тошнотой и тревожностью.
Детальнее – https://kapelnica-ot-zapoya-moskva0.ru/kapelnicza-ot-zapoya-anonimno-msk
Квалифицированный нарколог при вызове на дом в Волгограде выполняет следующие задачи:
Подробнее тут – http://
Каждый пациент проходит предварительное обследование: экспресс-анализ крови на электролиты, биохимия печени и почек, ЭКГ. На основании результатов врач формирует персональную программу инфузионной терапии.
Получить больше информации – http://kapelnica-ot-zapoya-chelyabinsk13.ru/kapelniczy-ot-zapoya-na-domu-chelyabinsk/
Выбор помощи на дому имеет ряд значительных преимуществ:
Подробнее тут – https://vyvod-iz-zapoya-tula0.ru/
Своевременный вызов специалиста особенно важен при следующих признаках:
Ознакомиться с деталями – вывод из запоя капельница
После снятия острой интоксикации переходим к физическому и психическому восстановлению — комплекс лечебной гимнастики, массажи, физиопроцедуры и сеансы ароматерапии для снятия стресса и повышения общего тонуса.
Ознакомиться с деталями – центр лечения алкоголизма краснодар.
Клиника «ВолгаМед» в Волгограде обеспечивает круглосуточную анонимную помощь людям, столкнувшимся с алкогольной или наркотической зависимостью. Мы предлагаем как стационарное лечение в комфортных условиях, так и выезд врача на дом в любое время суток. Конфиденциальность, профессионализм и индивидуальный подход — ключевые принципы нашей работы. В этой статье подробно рассмотрим преимущества клиники, спектр услуг, порядок организации домашнего выезда специалистов и дополнительные возможности поддержки в период реабилитации.
Выяснить больше – http://narkologicheskaya-klinika-volgograd13.ru
Домашний вывод из запоя подходит тем, кто сохраняет относительно стабильные жизненные показатели и нуждается в минимальном мониторинге. Врач приезжает в удобное для вас время, проводит все необходимые манипуляции в привычной обстановке и остаётся на связи после процедуры для оперативной консультации.
Получить дополнительную информацию – srochnyj vyvod iz zapoya
Существуют определённые признаки, свидетельствующие о необходимости срочного обращения за профессиональной помощью:
Ознакомиться с деталями – https://vyvod-iz-zapoya-orekhovo-zuevo4.ru/
Наркологическая клиника в Екатеринбурге уделяет большое внимание психотерапевтическим методам. Индивидуальный подход к пациенту позволяет выявить причины и особенности зависимости, сформировать устойчивую мотивацию на лечение и отказ от вредных привычек.
Детальнее – http://narcologicheskaya-klinika-ekaterinburg00.ru/narkologicheskaya-klinika-telefon-v-ekaterinburge/
Обращение к специалисту должно происходить при первых тревожных признаках абстиненции. Сигналом к безотлагательному вызову могут служить:
Разобраться лучше – http://narkolog-na-dom-ramenskoe4.ru
На данном этапе специалист уточняет, как долго продолжается запой, какой вид алкоголя употребляется и имеются ли сопутствующие заболевания. Тщательный анализ информации позволяет оперативно определить степень интоксикации и выбрать оптимальные методы терапии для быстрого и безопасного вывода из запоя.
Подробнее можно узнать тут – вывод из запоя клиника в туле
Среди преимуществ услуги:
Изучить вопрос глубже – запой нарколог на дом
Сразу после вызова нарколог прибывает на дом для проведения тщательного первичного осмотра. На этом этапе специалист собирает краткий анамнез, измеряет жизненно важные показатели – пульс, артериальное давление, температуру – и оценивает степень алкогольной интоксикации. Полученные данные служат основой для составления индивидуального плана лечения, позволяющего подобрать оптимальные методы детоксикации.
Подробнее можно узнать тут – https://vyvod-iz-zapoya-yaroslavl00.ru/vyvod-iz-zapoya-kruglosutochno-yaroslavl
Наркологическая клиника в Челябинске предоставляет полный спектр медицинских услуг по диагностике, лечению и реабилитации пациентов с зависимостями различной этиологии. Современные методы терапии, применяемые в клинике, направлены на безопасное и эффективное избавление от наркотической и алкогольной зависимости, а также сопутствующих психических и соматических осложнений.
Изучить вопрос глубже – платная наркологическая клиника в челябинске
Основной этап, направленный на очищение организма от продуктов распада алкоголя и нормализацию функций внутренних органов. Применяются современные препараты с антиоксидантным и гепатопротекторным эффектом.
Изучить вопрос глубже – centr lecheniya alkogolizma krasnodar
Своевременный выезд нарколога снижает риск осложнений и ускоряет вывод из запоя, а под контролем профессионала каждая процедура проходит максимально безопасно.
Подробнее тут – https://vyvod-iz-zapoya-reutov4.ru/anonimnyj-vyvod-iz-zapoya-v-reutove/
В клинике применяются инновационные методы диагностики, включая лабораторные анализы и аппаратные исследования, которые позволяют выявить степень зависимости и сопутствующие патологии. Важным этапом является комплексный подход к лечению, включающий детоксикацию организма, психотерапию и медикаментозную поддержку.
Получить дополнительную информацию – narkologicheskaya-klinika-krasnodar00.ru/
Алкогольный делирий проявляется в виде галлюцинаций, бреда и агрессии. При отсутствии контроля такие пациенты опасны для себя и окружающих, требуя немедленной госпитализации.
Подробнее можно узнать тут – вывод из запоя капельница челябинск
Наркологическая клиника «ЧелябДоктор» специализируется на экстренной и плановой детоксикации пациентов с алкогольной зависимостью. Наши главные преимущества:
Детальнее – капельница от запоя анонимно в челябинске
Наркологическая клиника в Екатеринбурге представляет собой специализированное медицинское учреждение, ориентированное на диагностику, лечение и профилактику зависимости от алкоголя, наркотиков и других психоактивных веществ. Современные подходы и комплексные методы терапии позволяют эффективно справляться с разнообразными формами аддиктивного поведения, обеспечивая пациентам качественную медицинскую помощь и психологическую поддержку. Подробнее о современных методах лечения зависимости можно узнать на сайте Всемирной организации здравоохранения.
Получить больше информации – https://narcologicheskaya-klinika-ekaterinburg00.ru/narkologicheskaya-klinika-telefon-v-ekaterinburge
Чтобы вызвать нарколога на дом, достаточно позвонить по специализированным горячим телефонам или оформить заявку на сайте. Специалисты быстро реагируют на обращения, проводят первичную оценку и выезжают в течение часа. Важным аспектом является наличие лицензии и квалификации у медицинского персонала, что гарантирует безопасность и эффективность лечения.
Детальнее – http://www.domen.ru
Каждый этап лечения тщательно продуман для достижения максимальной безопасности и эффективности:
Получить дополнительные сведения – наркологический вывод из запоя мариуполь
Обращаясь в «ВолгаМед», вы получаете:
Углубиться в тему – https://narkologicheskaya-klinika-volgograd13.ru/chastnaya-narkologicheskaya-klinika-volgograd/
После основной терапии важно обеспечить поддержку пациента в период реабилитации. Реабилитационные программы в Краснодаре включают социальную адаптацию, восстановление навыков общения и трудоустройства. Это позволяет минимизировать риск рецидива и возвращения к употреблению алкоголя. Поддержка со стороны специалистов и близких — обязательное условие успешного результата. Более подробно о социальной реабилитации можно ознакомиться на сайте Федерального реабилитационного центра.
Узнать больше – анонимное лечение алкоголизма
Психотерапия является неотъемлемой частью лечения, позволяя работать с психологическими причинами зависимости. В клинике применяются различные методы, включая когнитивно-поведенческую терапию, мотивационное интервью и групповую терапию. Это позволяет повысить мотивацию к выздоровлению и сформировать навыки, необходимые для жизни без наркотиков и алкоголя.
Подробнее – наркологическая клиника на дом
Доступность услуги и оперативность реагирования гарантируют, что помощь будет оказана в течение 30–60 минут после вызова. Это позволяет не только быстро начать детоксикацию, но и минимизировать риск развития осложнений, таких как повреждение печени, почек и сердечно-сосудистой системы.
Получить дополнительные сведения – вывод из запоя на дому цена
Использование автоматизированных систем дозирования обеспечивает точное введение медикаментов, минимизируя риск передозировки и побочных эффектов. Постоянный мониторинг жизненно важных показателей позволяет врачу оперативно корректировать терапевтическую схему, адаптируя её к изменяющемуся состоянию пациента и обеспечивая максимальную безопасность лечения.
Получить дополнительные сведения – https://vyvod-iz-zapoya-tula00.ru/vyvod-iz-zapoya-na-domu-tula
Не откладывайте обращение к специалисту, если вы или ваши близкие столкнулись с:
Изучить вопрос глубже – narkologicheskaya klinika v oblasti
Процедура включает несколько этапов, направленных на выведение токсинов и восстановление нормальной работы организма.
Получить больше информации – https://kapelnica-ot-zapoya-moskva0.ru/kapelnicza-ot-zapoya-czena-msk
Каждый пациент уникален — именно поэтому мы не применяем «типовых» решений. После первичной консультации и диагностики специалисты «КубаньМед» разрабатывают персональную программу, учитывающую состояние здоровья, психологические особенности и социальные обстоятельства пациента.
Выяснить больше – лечение алкоголизма на дому
Среди преимуществ услуги:
Узнать больше – нарколог на дом недорого челябинск
После обращения оператор клиники уточняет все детали — состояние пациента, стаж запоев, наличие хронических болезней, принимаемые лекарства, аллергии. Далее в течение 30–60 минут на дом выезжает мобильная бригада: врач-нарколог и медсестра со всем необходимым оборудованием и медикаментами.
Подробнее тут – https://vyvod-iz-zapoya-orekhovo-zuevo4.ru/anonimnyj-vyvod-iz-zapoya-v-orekhovo-zuevo/
Использование автоматизированных систем дозирования позволяет точно подобрать необходимое количество медикаментов, минимизируя риск передозировки и побочных эффектов. Постоянный мониторинг жизненно важных показателей дает возможность врачу корректировать схему лечения в режиме реального времени, что повышает безопасность и эффективность процедуры.
Подробнее тут – https://vyvod-iz-zapoya-yaroslavl0.ru/
Вид услуги
Получить дополнительную информацию – запой наркологическая клиника в челябинске
Запой – это критическое состояние, при котором организм подвергается сильной алкогольной интоксикации, что может привести к накоплению токсинов, нарушению обменных процессов и повреждению жизненно важных органов. В Туле, благодаря профессиональной помощи нарколога на дому, возможно оперативно начать лечение, не прибегая к госпитализации. Такой подход позволяет пациенту получить качественную терапию в комфортных условиях, сохраняя полную конфиденциальность и минимизируя стресс, связанный с посещением стационара.
Изучить вопрос глубже – vyvod-iz-zapoya-klinika tula
Сопутствующие патологии печени, почек, сердца или ЖКТ усугубляют последствия запоя. Без коррекции электролитного баланса и поддержки органов пациент рискует получить необратимые осложнения.
Детальнее – http://vivod-iz-zapoya-chelyabinsk13.ru/srochnyj-vyvod-iz-zapoya-chelyabinsk/
Наркологическая клиника в Екатеринбурге уделяет большое внимание психотерапевтическим методам. Индивидуальный подход к пациенту позволяет выявить причины и особенности зависимости, сформировать устойчивую мотивацию на лечение и отказ от вредных привычек.
Получить дополнительные сведения – narkologicheskie kliniki alkogolizm ekaterinburg
Метод лечения
Выяснить больше – наркологическая клиника на дом
Наши специалисты регулярно проходят обучение и сертификацию по последним международным протоколам лечения алкогольной интоксикации. В арсенале «ЧелябДоктор» — передовое оборудование для инфузий, портативные насосы и тест-системы для контроля электролитов, глюкозы и функции печени прямо на дому.
Получить дополнительные сведения – http://kapelnica-ot-zapoya-chelyabinsk13.ru/kapelnicza-ot-zapoya-czena-chelyabinsk/
Выбор помощи на дому имеет ряд значительных преимуществ:
Подробнее – https://vyvod-iz-zapoya-tula0.ru/
При глубокой алкогольной интоксикации запой может привести к серьёзным осложнениям — от обезвоживания и электролитного дисбаланса до острого алкогольного психоза. В Мариуполе клиника «Мариуполь без запоя» предлагает оперативную помощь на дому с выездом нарколога в течение 60 минут и круглосуточную поддержку. Пациент получает комплексное лечение без стресса госпитализации и в условиях полной конфиденциальности.
Получить дополнительную информацию – помощь вывод из запоя мариуполь
В течение процедуры пациент находится под непрерывным наблюдением: внутривенные капельницы с регидратационными растворами, витаминно-минеральными комплексами и гепатопротекторами обеспечивают восстановление функций печени, нормализацию обменных процессов и поддержку работы сердечно-сосудистой системы. При необходимости к лечению привлекаются узкопрофильные врачи — кардиолог, невролог или терапевт — что делает процесс максимально комплексным. По завершении выведения из запоя врач предоставляет подробный план поддерживающей терапии с рекомендациями по питанию, питьевому режиму и графику повторных консультаций.
Получить больше информации – вывод из запоя вызов
Чтобы вызвать нарколога на дом, достаточно позвонить по специализированным горячим телефонам или оформить заявку на сайте. Специалисты быстро реагируют на обращения, проводят первичную оценку и выезжают в течение часа. Важным аспектом является наличие лицензии и квалификации у медицинского персонала, что гарантирует безопасность и эффективность лечения.
Получить дополнительную информацию – частный нарколог на дом
Каждый пациент уникален — именно поэтому мы не применяем «типовых» решений. После первичной консультации и диагностики специалисты «КубаньМед» разрабатывают персональную программу, учитывающую состояние здоровья, психологические особенности и социальные обстоятельства пациента.
Получить больше информации – http://lechenie-alkogolizma-krasnodar0.ru/metody-lecheniya-alkogolizma-krasnodar/https://lechenie-alkogolizma-krasnodar0.ru
Наши врачи имеют сертификаты Министерства здравоохранения РФ и европейские дипломы о дополнительном образовании. Это гарантирует, что вы получите помощь, основанную на последних исследованиях и передовых практиках наркологии.
Исследовать вопрос подробнее – наркологические клиники алкоголизм
Существуют определённые признаки, свидетельствующие о необходимости срочного обращения за профессиональной помощью:
Получить дополнительную информацию – vyvod iz zapoya na domu nedorogo
Вывод из запоя на дому в Туле осуществляется по строго отлаженной схеме, которая включает несколько последовательных этапов. Такой комплексный подход позволяет не только быстро вывести токсины из организма, но и обеспечить всестороннюю поддержку пациента, включая психологическую реабилитацию.
Исследовать вопрос подробнее – вывод из запоя в стационаре тула
Основные задачи
Детальнее – анонимное лечение алкоголизма краснодар
Своевременный вызов нарколога позволяет снизить риски осложнений, таких как судорожный синдром, панкреатит или сердечная недостаточность, часто сопровождающие тяжелое алкогольное или наркотическое отравление. По данным исследований, раннее вмешательство сокращает сроки госпитализации и улучшает прогнозы выздоровления.
Разобраться лучше – нарколог на дом клиника
Наркологическая клиника в Челябинске предоставляет полный спектр медицинских услуг по диагностике, лечению и реабилитации пациентов с зависимостями различной этиологии. Современные методы терапии, применяемые в клинике, направлены на безопасное и эффективное избавление от наркотической и алкогольной зависимости, а также сопутствующих психических и соматических осложнений.
Узнать больше – https://narkologicheskaya-klinika-chelyabinsk13.ru/chastnaya-narkologicheskaya-klinika-chelyabinsk/
Врач уточняет длительность запоя, тип употребляемого алкоголя и наличие сопутствующих заболеваний. Тщательный анализ этой информации позволяет оперативно определить степень интоксикации и подобрать наиболее эффективные методы терапии, минимизируя риск осложнений.
Детальнее – срочный вывод из запоя
Наркологическая клиника в Екатеринбурге занимается широким спектром услуг, включающих как экстренную помощь, так и длительную реабилитацию пациентов с зависимостью. Ключевыми направлениями являются:
Углубиться в тему – http://narcologicheskaya-klinika-ekaterinburg00.ru
Лечение в наркологической клинике в Краснодаре строится на комплексном подходе, включающем медикаментозную терапию, психотерапевтическую помощь и социальную реабилитацию. Медикаментозное лечение направлено на детоксикацию организма и снижение симптомов абстиненции, что позволяет значительно улучшить состояние пациента в первые дни терапии. Современные препараты, применяемые в лечении зависимости, сертифицированы и соответствуют международным стандартам, что подтверждается на сайте Всемирной организации здравоохранения.
Разобраться лучше – https://narkologicheskaya-klinika-krasnodar0.ru/anonimnaya-narkologicheskaya-klinika-v-krasnodare/
В «Север-Мед» вы найдёте не только медицинскую, но и социальную поддержку: наши специалисты помогают восстановить утраченные навыки общения и трудоспособности. Родственники могут пройти семейное консультирование, где профессионалы подскажут, как построить эффективный диалог с зависимым и создать благоприятную среду для выздоровления.
Подробнее тут – http://narkologicheskaya-klinika-zhukovskij4.ru/
Процедура включает несколько этапов, направленных на выведение токсинов и восстановление нормальной работы организма.
Подробнее – капельница от запоя цена московская область
Круглосуточная служба «ЧелябМед» оперативно реагирует на экстренные случаи при следующих состояниях:
Узнать больше – вывод из запоя дешево
Включает полную лабораторную диагностику — печёночные пробы, биохимический анализ крови, ЭКГ и УЗИ органов брюшной полости. На основе результатов врач определяет оптимальную дозировку и продолжительность капельниц, минимизируя нагрузку на сердце и почки.
Разобраться лучше – https://lechenie-alkogolizma-krasnodar0.ru/
Каждый пациент проходит предварительное обследование: экспресс-анализ крови на электролиты, биохимия печени и почек, ЭКГ. На основании результатов врач формирует персональную программу инфузионной терапии.
Получить дополнительные сведения – сколько стоит капельница на дому от запоя челябинск
В клинике применяются инновационные методы диагностики, включая лабораторные анализы и аппаратные исследования, которые позволяют выявить степень зависимости и сопутствующие патологии. Важным этапом является комплексный подход к лечению, включающий детоксикацию организма, психотерапию и медикаментозную поддержку.
Получить дополнительные сведения – частная наркологическая клиника краснодар.
Услуга вывода из запоя на дому в Туле разработана для тех, кто столкнулся с тяжелыми последствиями злоупотребления алкоголем. Основная цель – оперативная детоксикация организма, восстановление нормального обмена веществ и предотвращение дальнейших осложнений. Врач нарколог проводит полный комплекс обследований и назначает персонализированный план лечения, включающий медикаментозную терапию и психологическую поддержку, что позволяет обеспечить стабильное восстановление организма.
Получить дополнительные сведения – вывод из запоя цена в туле
На данном этапе специалист уточняет, как долго продолжается запой, какой вид алкоголя употребляется и имеются ли сопутствующие заболевания. Тщательный анализ информации позволяет оперативно определить степень интоксикации и выбрать оптимальные методы терапии для быстрого и безопасного вывода из запоя.
Подробнее тут – https://vyvod-iz-zapoya-tula00.ru/vyvod-iz-zapoya-czena-tula/
В таких случаях медлить нельзя — своевременный вызов нарколога может спасти жизнь и предотвратить тяжёлую инвалидизацию.
Подробнее тут – https://vyvod-iz-zapoya-orekhovo-zuevo4.ru/
Своевременный вызов специалиста особенно важен при следующих признаках:
Углубиться в тему – вывод из запоя с выездом в мариуполе
По вопросам оформления вызова можно ознакомиться с правилами на портале Федеральной службы по надзору в сфере здравоохранения, где опубликованы актуальные рекомендации и требования к медицинским организациям.
Получить дополнительную информацию – врач нарколог на дом
В «ВолгаМед» работают врачи-наркологи, психотерапевты и реабилитологи с опытом от 5 до 20 лет. Каждый специалист регулярно проходит повышение квалификации, участвует в научных конференциях и владеет современными методами диагностики и лечения зависимостей.
Подробнее – наркологические клиники алкоголизм
Своевременный выезд нарколога снижает риск осложнений и ускоряет вывод из запоя, а под контролем профессионала каждая процедура проходит максимально безопасно.
Ознакомиться с деталями – vyvod iz zapoya nedorogo
Одним из основных этапов вывода из запоя является медикаментозная детоксикация. Современные препараты вводятся капельничным методом, что обеспечивает быстрое снижение уровня алкоголя и токсинов в крови. Это позволяет восстановить нормальный обмен веществ и нормализовать работу жизненно важных органов, таких как печень, почки и сердце. Такой подход помогает не только стабилизировать состояние пациента, но и уменьшить риск развития осложнений.
Исследовать вопрос подробнее – вывод из запоя цена ярославская область
Наркологическая клиника в Екатеринбурге уделяет большое внимание психотерапевтическим методам. Индивидуальный подход к пациенту позволяет выявить причины и особенности зависимости, сформировать устойчивую мотивацию на лечение и отказ от вредных привычек.
Получить больше информации – http://narcologicheskaya-klinika-ekaterinburg00.ru
Современная практика включает комплексное обследование, позволяющее оценить состояние пациента и подобрать оптимальную схему терапии. Нарколог на дом в Челябинске проводит:
Подробнее можно узнать тут – https://narkolog-na-dom-chelyabinsk13.ru/zapoj-narkolog-na-dom-chelyabinsk/
Клиника оснащена современным оборудованием для мониторинга состояния пациентов и проведения процедур с максимальной безопасностью. Врачебный состав состоит из опытных наркологов, психиатров и психологов, регулярно повышающих квалификацию и применяющих доказательные методы лечения. На портале Российской медицинской ассоциации наркологов можно ознакомиться с рекомендациями по стандартам оказания наркологической помощи.
Исследовать вопрос подробнее – частная наркологическая клиника
Основной этап, направленный на очищение организма от продуктов распада алкоголя и нормализацию функций внутренних органов. Применяются современные препараты с антиоксидантным и гепатопротекторным эффектом.
Исследовать вопрос подробнее – лечение алкоголизма цена
Лечение алкоголизма в Краснодаре представляет собой комплекс мероприятий, направленных на полное восстановление физического и психологического состояния пациента. Этот процесс требует профессионального подхода, включающего диагностику, детоксикацию, терапию зависимости и реабилитацию. Информация о современных методах терапии доступна на официальном портале Минздрава РФ.
Детальнее – http://lechenie-alkogolizma-krasnodar00.ru/lechenie-khronicheskogo-alkogolizma-krasnodar/
Сопутствующие патологии печени, почек, сердца или ЖКТ усугубляют последствия запоя. Без коррекции электролитного баланса и поддержки органов пациент рискует получить необратимые осложнения.
Исследовать вопрос подробнее – вывод из запоя на дому недорого челябинск
Запой – это критическое состояние, при котором организм подвергается сильной алкогольной интоксикации, что может привести к накоплению токсинов, нарушению обменных процессов и повреждению жизненно важных органов. В Туле, благодаря профессиональной помощи нарколога на дому, возможно оперативно начать лечение, не прибегая к госпитализации. Такой подход позволяет пациенту получить качественную терапию в комфортных условиях, сохраняя полную конфиденциальность и минимизируя стресс, связанный с посещением стационара.
Узнать больше – вывод из запоя на дому в туле
Длительный запой приводит к нарастанию интоксикации, истощению нервной системы, серьёзным нарушениям в работе печени, почек и сердца. Могут возникнуть тяжёлые психозы (белая горячка), судороги, развитие алкогольной энцефалопатии, панкреатит, обострение хронических болезней. Самостоятельные попытки выйти из запоя с помощью «народных средств», внезапного отказа от алкоголя, промывания желудка или лекарств из домашней аптечки часто только усугубляют состояние.
Детальнее – vyvod iz zapoya na domu orekhovo zuevo
Выбор помощи на дому имеет ряд значительных преимуществ:
Получить дополнительную информацию – вывод из запоя круглосуточно тула
В «ЧелябДокторе» применяются комбинированные схемы, основанные на доказательной медицине и новейших разработках:
Подробнее можно узнать тут – капельницы от запоя на дому цена
В клинике применяются инновационные методы диагностики, включая лабораторные анализы и аппаратные исследования, которые позволяют выявить степень зависимости и сопутствующие патологии. Важным этапом является комплексный подход к лечению, включающий детоксикацию организма, психотерапию и медикаментозную поддержку.
Получить дополнительные сведения – наркологическая клиника краснодарский край
Детоксикация производится как внутривенно — капельницы с регидратационными растворима, гепатопротекторами и сорбентами — так и аппаратным методом (плазмаферез, гемодиализ). Мы используем только современные одноразовые инфузионные системы и высококачественные лекарственные растворы, что гарантирует безопасность и максимальную эффективность процедур.
Получить дополнительную информацию – https://narkologicheskaya-klinika-zhukovskij4.ru/chastnaya-narkologicheskaya-klinika-v-zhukovskom/
Психотерапия является неотъемлемой частью лечения, позволяя работать с психологическими причинами зависимости. В клинике применяются различные методы, включая когнитивно-поведенческую терапию, мотивационное интервью и групповую терапию. Это позволяет повысить мотивацию к выздоровлению и сформировать навыки, необходимые для жизни без наркотиков и алкоголя.
Изучить вопрос глубже – http://narkologicheskaya-klinika-krasnodar0.ru/narkologicheskaya-klinika-anonimno-krasnodar/
Длительное употребление алкоголя негативно сказывается на состоянии организма, приводя к тяжелой интоксикации, обезвоживанию и нарушениям работы внутренних органов. Самостоятельный выход из запоя часто сопровождается сильным похмельем, скачками давления, головной болью, тошнотой и тревожностью.
Детальнее – вызвать капельницу от запоя на дому
Для срочных случаев клиника поддерживает круглосуточный режим приёма заявок. После оформления вызова диспетчер передаёт информацию бригаде, и в течение часа врач прибудет по указанному адресу.
Детальнее – помощь вывод из запоя
Наркологическая клиника в Екатеринбурге представляет собой специализированное медицинское учреждение, ориентированное на диагностику, лечение и профилактику зависимости от алкоголя, наркотиков и других психоактивных веществ. Современные подходы и комплексные методы терапии позволяют эффективно справляться с разнообразными формами аддиктивного поведения, обеспечивая пациентам качественную медицинскую помощь и психологическую поддержку. Подробнее о современных методах лечения зависимости можно узнать на сайте Всемирной организации здравоохранения.
Детальнее – бесплатная наркологическая клиника в екатеринбурге
Наша клиника работает по стандартам международного уровня, сочетая научно обоснованные методики с внимательным отношением к каждому пациенту. В «ВолгаМед» вы не столкнётесь с бюрократией или очередями — помощь оказывается сразу после обращения, а все процедуры проводятся в строгом соответствии с медицинскими протоколами и этическими нормами.
Подробнее можно узнать тут – наркологическая клиника клиника помощь волгоград
Оказание наркологической помощи в домашних условиях имеет ряд нюансов. Пациент находится в знакомой среде, что снижает уровень тревоги и позволяет легче переносить лечебные процедуры. При этом специалист оснащён необходимым оборудованием для экстренной помощи, что важно при рисках осложнений. Поддержка близких дополнительно повышает эффективность терапии.
Выяснить больше – выезд нарколога на дом волгоград
Мы стремимся обеспечить пациентам максимальный уровень доверия и результативности лечения, сочетая передовые технологии и многолетний опыт специалистов:
Детальнее – http://lechenie-alkogolizma-krasnodar0.ru/klinika-lecheniya-alkogolizma-krasnodar/
Своевременный вызов нарколога позволяет снизить риски осложнений, таких как судорожный синдром, панкреатит или сердечная недостаточность, часто сопровождающие тяжелое алкогольное или наркотическое отравление. По данным исследований, раннее вмешательство сокращает сроки госпитализации и улучшает прогнозы выздоровления.
Исследовать вопрос подробнее – http://www.domen.ru
Когда запой угрожает здоровью, каждая минута имеет решающее значение. В Ярославле квалифицированные специалисты по наркологии оказывают помощь на дому, позволяя оперативно начать лечение алкогольной интоксикации и вывести токсины из организма. Такой формат терапии обеспечивает комфортные условия для пациента, максимальную конфиденциальность и индивидуальный подход, что особенно важно для быстрого и безопасного восстановления здоровья.
Разобраться лучше – наркологический вывод из запоя
Использование автоматизированных систем дозирования обеспечивает точное введение медикаментов, минимизируя риск передозировки и побочных эффектов. Постоянный мониторинг жизненно важных показателей позволяет врачу оперативно корректировать терапевтическую схему, адаптируя её к изменяющемуся состоянию пациента и обеспечивая максимальную безопасность лечения.
Исследовать вопрос подробнее – https://vyvod-iz-zapoya-tula00.ru/vyvod-iz-zapoya-na-domu-tula
Важным этапом работы клиники является всесторонняя диагностика состояния пациента. Используются лабораторные и инструментальные методы обследования для оценки влияния токсических веществ на организм. Такой подход позволяет составить индивидуальный план лечения, максимально учитывающий особенности пациента и стадию зависимости. Подробные рекомендации по диагностике зависимости опубликованы на сайте ФГБУ «НМИЦ Психиатрии и наркологии» Минздрава России.
Подробнее можно узнать тут – анонимная наркологическая клиника
Существуют определённые признаки, свидетельствующие о необходимости срочного обращения за профессиональной помощью:
Получить дополнительную информацию – https://vyvod-iz-zapoya-orekhovo-zuevo4.ru
Работа врача начинается с детального сбора анамнеза: выясняются длительность запоя, объёмы употреблённого алкоголя, сопутствующие заболевания и аллергические реакции. Затем специалист измеряет давление, пульс, сатурацию и температуру, после чего подбирает оптимальный протокол детоксикации.
Разобраться лучше – vyvod iz zapoya cena reutov
Программа лечения строится на комплексном подходе, который учитывает не только физические, но и психоэмоциональные потребности пациента. Благодаря круглосуточной доступности наркологической помощи, лечение начинается в самые ранние часы кризиса, что значительно повышает шансы на успешную реабилитацию.
Получить больше информации – http://vyvod-iz-zapoya-tula000.ru/
Круглосуточная служба «ЧелябМед» оперативно реагирует на экстренные случаи при следующих состояниях:
Подробнее – вывод из запоя на дому в челябинске
Каждый пациент проходит предварительное обследование: экспресс-анализ крови на электролиты, биохимия печени и почек, ЭКГ. На основании результатов врач формирует персональную программу инфузионной терапии.
Подробнее тут – http://kapelnica-ot-zapoya-chelyabinsk13.ru
Наркологическая клиника в Краснодаре представляет собой специализированное медицинское учреждение, где оказывается профессиональная помощь пациентам с различными формами зависимости. Современные подходы к лечению позволяют обеспечить эффективную и безопасную терапию, направленную на восстановление физического и психического здоровья.
Углубиться в тему – наркологические клиники алкоголизм в краснодаре
После основной терапии важно обеспечить поддержку пациента в период реабилитации. Реабилитационные программы в Краснодаре включают социальную адаптацию, восстановление навыков общения и трудоустройства. Это позволяет минимизировать риск рецидива и возвращения к употреблению алкоголя. Поддержка со стороны специалистов и близких — обязательное условие успешного результата. Более подробно о социальной реабилитации можно ознакомиться на сайте Федерального реабилитационного центра.
Углубиться в тему – центр лечения алкоголизма краснодар.
Алкогольная зависимость — хроническое заболевание, требующее комплексного подхода. В клинике «КубаньМед» в Краснодаре разработаны авторские методики, направленные на полное преодоление зависимости и возвращение пациента к полноценной жизни. Мы предлагаем индивидуальные программы лечения, сочетающие медикаментозную детоксикацию, специализированные реабилитационные процедуры и профессиональные психологические консультации. Всё это в условиях полного комфорта и абсолютной конфиденциальности.
Детальнее – лечение алкоголизма на дому
Наркологическая клиника в Екатеринбурге представляет собой специализированное медицинское учреждение, ориентированное на диагностику, лечение и профилактику зависимости от алкоголя, наркотиков и других психоактивных веществ. Современные подходы и комплексные методы терапии позволяют эффективно справляться с разнообразными формами аддиктивного поведения, обеспечивая пациентам качественную медицинскую помощь и психологическую поддержку. Подробнее о современных методах лечения зависимости можно узнать на сайте Всемирной организации здравоохранения.
Узнать больше – http://narcologicheskaya-klinika-ekaterinburg00.ru/
На данном этапе специалист уточняет, как долго продолжается запой, какой вид алкоголя употребляется и имеются ли сопутствующие заболевания. Тщательный анализ информации позволяет оперативно определить степень интоксикации и выбрать оптимальные методы терапии для быстрого и безопасного вывода из запоя.
Исследовать вопрос подробнее – наркологический вывод из запоя
Использование автоматизированных систем дозирования позволяет точно подобрать необходимое количество медикаментов, минимизируя риск передозировки и побочных эффектов. Постоянный мониторинг жизненно важных показателей дает возможность врачу корректировать схему лечения в режиме реального времени, что повышает безопасность и эффективность процедуры.
Ознакомиться с деталями – https://vyvod-iz-zapoya-yaroslavl0.ru/
При глубокой алкогольной интоксикации запой может привести к серьёзным осложнениям — от обезвоживания и электролитного дисбаланса до острого алкогольного психоза. В Мариуполе клиника «Мариуполь без запоя» предлагает оперативную помощь на дому с выездом нарколога в течение 60 минут и круглосуточную поддержку. Пациент получает комплексное лечение без стресса госпитализации и в условиях полной конфиденциальности.
Подробнее можно узнать тут – вывод из запоя на дому круглосуточно в мариуполе
Обращаясь в «ВолгаМед», вы получаете:
Выяснить больше – http://narkologicheskaya-klinika-volgograd13.ru
Среди преимуществ услуги:
Получить дополнительную информацию – http://narkolog-na-dom-chelyabinsk13.ru/vyzov-narkologa-na-dom-chelyabinsk/
Первичный осмотр включает измерение давления, температуры, уровня глюкозы и сатурации, анализ неврологического статуса, оценку степени обезвоживания и интоксикации. Далее формируется индивидуальный план инфузионной терапии: капельницы с солевыми, глюкозными, витаминными, гепатопротекторными и седативными препаратами. При необходимости применяются современные противосудорожные и нейропротекторные средства, кислородная поддержка.
Подробнее – вывод из запоя на дому орехово
По вопросам оформления вызова можно ознакомиться с правилами на портале Федеральной службы по надзору в сфере здравоохранения, где опубликованы актуальные рекомендации и требования к медицинским организациям.
Узнать больше – нарколог на дом вывод из запоя
В клинике применяются комплексные программы, включающие медицинскую детоксикацию, психотерапевтическую поддержку и социальную реабилитацию. Медицинская детоксикация проводится с использованием современных препаратов и методик, что позволяет снизить тяжесть абстинентного синдрома и минимизировать риски для здоровья пациента. Подробнее о методах детоксикации можно узнать на официальном портале Министерства здравоохранения России.
Подробнее – наркологические клиники алкоголизм в челябинске
Чем раньше начинается профессиональная детоксикация, тем меньше вероятность развития тяжёлых осложнений, таких как судорожный синдром, отёк мозга, острый панкреатит или некроз печени.
Детальнее – http://
Одним из ключевых аспектов является определение стадии зависимости, что можно подробнее изучить на официальном портале Министерства здравоохранения РФ. Там представлена актуальная информация о современных стандартах диагностики и лечения.
Подробнее тут – https://narkologicheskaya-klinika-krasnodar0.ru/narkologicheskaya-klinika-anonimno-krasnodar/
Основные показания для проведения капельницы на дому:
Разобраться лучше – врач на дом капельница от запоя
Пациенты могут воспринимать окружающих как врагов, отказываться от помощи. Стресс от изоляции дома усугубляет состояние без профессиональной поддержки.
Подробнее можно узнать тут – http://vivod-iz-zapoya-chelyabinsk13.ru/vyvod-iz-zapoya-czena-chelyabinsk/
Выбор помощи на дому имеет ряд значительных преимуществ:
Получить дополнительную информацию – наркология вывод из запоя в туле
Включает полную лабораторную диагностику — печёночные пробы, биохимический анализ крови, ЭКГ и УЗИ органов брюшной полости. На основе результатов врач определяет оптимальную дозировку и продолжительность капельниц, минимизируя нагрузку на сердце и почки.
Подробнее можно узнать тут – https://lechenie-alkogolizma-krasnodar0.ru/lechenie-alkogolizma-anonimno-krasnodar/
В «ЧелябДокторе» применяются комбинированные схемы, основанные на доказательной медицине и новейших разработках:
Углубиться в тему – капельница от запоя на дому недорого челябинск
После первичной диагностики начинается активная фаза медикаментозного вмешательства. Современные препараты вводятся капельничным методом, что позволяет оперативно снизить уровень токсинов в крови, восстановить нормальный обмен веществ и нормализовать работу внутренних органов, таких как печень, почки и сердце. Этот этап критически важен для стабилизации состояния пациента и предотвращения дальнейших осложнений.
Получить дополнительную информацию – http://vyvod-iz-zapoya-tula00.ru/
Наркологическая клиника в Краснодаре представляет собой специализированное медицинское учреждение, где оказывается профессиональная помощь пациентам с различными формами зависимости. Современные подходы к лечению позволяют обеспечить эффективную и безопасную терапию, направленную на восстановление физического и психического здоровья.
Выяснить больше – наркологическая клиника нарколог краснодар
В течение процедуры пациент находится под непрерывным наблюдением: внутривенные капельницы с регидратационными растворами, витаминно-минеральными комплексами и гепатопротекторами обеспечивают восстановление функций печени, нормализацию обменных процессов и поддержку работы сердечно-сосудистой системы. При необходимости к лечению привлекаются узкопрофильные врачи — кардиолог, невролог или терапевт — что делает процесс максимально комплексным. По завершении выведения из запоя врач предоставляет подробный план поддерживающей терапии с рекомендациями по питанию, питьевому режиму и графику повторных консультаций.
Подробнее тут – вывод из запоя на дому
После обращения оператор клиники уточняет все детали — состояние пациента, стаж запоев, наличие хронических болезней, принимаемые лекарства, аллергии. Далее в течение 30–60 минут на дом выезжает мобильная бригада: врач-нарколог и медсестра со всем необходимым оборудованием и медикаментами.
Детальнее – https://vyvod-iz-zapoya-orekhovo-zuevo4.ru/vyvod-iz-zapoya-na-domu-v-orekhovo-zuevo
Когда запой угрожает здоровью, каждая минута имеет решающее значение. В Ярославле квалифицированные специалисты по наркологии оказывают помощь на дому, позволяя оперативно начать лечение алкогольной интоксикации и вывести токсины из организма. Такой формат терапии обеспечивает комфортные условия для пациента, максимальную конфиденциальность и индивидуальный подход, что особенно важно для быстрого и безопасного восстановления здоровья.
Подробнее – вывод из запоя на дому ярославская область
В современных условиях лечение алкогольной и наркотической зависимости требует комплексного подхода и быстрого реагирования. Нарколог на дом в Челябинске — это услуга, позволяющая получить квалифицированную помощь без необходимости посещения медицинского учреждения. Такая форма оказания медицинской помощи особенно актуальна для пациентов с острыми состояниями, а также тех, кто нуждается в анонимности и комфорте домашней обстановки.
Подробнее – вызов нарколога на дом челябинск
После основной терапии важно обеспечить поддержку пациента в период реабилитации. Реабилитационные программы в Краснодаре включают социальную адаптацию, восстановление навыков общения и трудоустройства. Это позволяет минимизировать риск рецидива и возвращения к употреблению алкоголя. Поддержка со стороны специалистов и близких — обязательное условие успешного результата. Более подробно о социальной реабилитации можно ознакомиться на сайте Федерального реабилитационного центра.
Детальнее – центр лечения алкоголизма краснодар
В «ВолгаМед» работают врачи-наркологи, психотерапевты и реабилитологи с опытом от 5 до 20 лет. Каждый специалист регулярно проходит повышение квалификации, участвует в научных конференциях и владеет современными методами диагностики и лечения зависимостей.
Получить дополнительную информацию – наркологическая клиника лечение алкоголизма волгоград
Вид услуги
Подробнее тут – http://narkologicheskaya-klinika-chelyabinsk13.ru
По вопросам оформления вызова можно ознакомиться с правилами на портале Федеральной службы по надзору в сфере здравоохранения, где опубликованы актуальные рекомендации и требования к медицинским организациям.
Получить дополнительные сведения – http://narkolog-na-dom-volgograd13.ru/narkolog-na-dom-kruglosutochno-volgograd/
При глубокой алкогольной интоксикации запой может привести к серьёзным осложнениям — от обезвоживания и электролитного дисбаланса до острого алкогольного психоза. В Мариуполе клиника «Мариуполь без запоя» предлагает оперативную помощь на дому с выездом нарколога в течение 60 минут и круглосуточную поддержку. Пациент получает комплексное лечение без стресса госпитализации и в условиях полной конфиденциальности.
Получить больше информации – https://vyvod-iz-zapoya-mariupol13.ru/vyvod-iz-zapoya-na-domu-mariupol/
Алкогольная интоксикация и запой могут стремительно ухудшить состояние здоровья, став угрозой жизни, поэтому оперативное вмешательство имеет первостепенное значение. В Туле квалифицированные наркологи предоставляют круглосуточную помощь на дому, что позволяет начать лечение незамедлительно и в комфортных условиях. Такой формат терапии гарантирует индивидуальный подход, всестороннюю поддержку и полную конфиденциальность, что особенно важно для пациентов, стремящихся восстановить своё здоровье без лишних стрессовых ситуаций.
Углубиться в тему – вывод из запоя на дому в туле
Основной этап, направленный на очищение организма от продуктов распада алкоголя и нормализацию функций внутренних органов. Применяются современные препараты с антиоксидантным и гепатопротекторным эффектом.
Углубиться в тему – лечение алкоголизма
При поступлении вызова нарколог незамедлительно приезжает на дом для проведения детального первичного осмотра. Врач собирает краткий анамнез, измеряет жизненно важные показатели — пульс, артериальное давление, температуру — и оценивает степень алкогольной интоксикации. Эти данные являются основой для разработки индивидуального плана лечения, позволяющего подобрать наиболее эффективные методы детоксикации.
Разобраться лучше – вывод из запоя клиника
Сопутствующие патологии печени, почек, сердца или ЖКТ усугубляют последствия запоя. Без коррекции электролитного баланса и поддержки органов пациент рискует получить необратимые осложнения.
Получить дополнительные сведения – вывод из запоя на дому челябинск
Наркологическая клиника в Екатеринбурге уделяет большое внимание психотерапевтическим методам. Индивидуальный подход к пациенту позволяет выявить причины и особенности зависимости, сформировать устойчивую мотивацию на лечение и отказ от вредных привычек.
Исследовать вопрос подробнее – http://narcologicheskaya-klinika-ekaterinburg00.ru/
Наши специалисты регулярно проходят обучение и сертификацию по последним международным протоколам лечения алкогольной интоксикации. В арсенале «ЧелябДоктор» — передовое оборудование для инфузий, портативные насосы и тест-системы для контроля электролитов, глюкозы и функции печени прямо на дому.
Подробнее – [url=https://kapelnica-ot-zapoya-chelyabinsk13.ru/]капельница от запоя цена[/url]
Вывод из запоя в Орехово-Зуево — это профессиональная экстренная помощь, предоставляемая наркологической клиникой «Гармония-Мед» на дому или в условиях современного стационара. Запой — тяжёлое состояние, при котором организм подвергается многодневному отравлению этанолом и продуктами его распада. Это критический момент в развитии алкогольной зависимости, опасный как для физического, так и для психического здоровья. Только своевременное и квалифицированное вмешательство позволяет предотвратить тяжёлые осложнения и вернуть пациента к полноценной жизни.
Подробнее – vyvod iz zapoya na domu kruglosutochno
После завершения основного курса лечения в наркологической клинике в Краснодаре пациентам предлагаются программы социальной реабилитации. Они направлены на восстановление социальных навыков, адаптацию в обществе и предотвращение рецидивов. Ключевым элементом здесь является поддержка со стороны профессиональных социальных работников и участие в группах взаимопомощи.
Разобраться лучше – наркологическая клиника краснодар
Чем раньше начинается профессиональная детоксикация, тем меньше вероятность развития тяжёлых осложнений, таких как судорожный синдром, отёк мозга, острый панкреатит или некроз печени.
Получить больше информации – http://narkologicheskaya-klinika-zhukovskij4.ru/narkologicheskaya-klinika-telefon-v-zhukovskom/
В клинике применяются инновационные методы диагностики, включая лабораторные анализы и аппаратные исследования, которые позволяют выявить степень зависимости и сопутствующие патологии. Важным этапом является комплексный подход к лечению, включающий детоксикацию организма, психотерапию и медикаментозную поддержку.
Получить больше информации – наркологическая клиника в краснодаре
Процедура включает несколько этапов, направленных на выведение токсинов и восстановление нормальной работы организма.
Получить дополнительную информацию – http://kapelnica-ot-zapoya-moskva0.ru/
Использование автоматизированных систем дозирования позволяет точно подобрать необходимое количество медикаментов, минимизируя риск передозировки и побочных эффектов. Постоянный мониторинг жизненно важных показателей дает возможность врачу корректировать схему лечения в режиме реального времени, что повышает безопасность и эффективность процедуры.
Детальнее – https://vyvod-iz-zapoya-yaroslavl0.ru/vyvod-iz-zapoya-na-domu-yaroslavl
Среди преимуществ услуги:
Узнать больше – психиатр нарколог на дом
На данном этапе специалист уточняет, как долго продолжается запой, какой вид алкоголя употребляется и имеются ли сопутствующие заболевания. Тщательный анализ информации позволяет оперативно определить степень интоксикации и выбрать оптимальные методы терапии для быстрого и безопасного вывода из запоя.
Получить больше информации – вывод из запоя
Мы стремимся обеспечить пациентам максимальный уровень доверия и результативности лечения, сочетая передовые технологии и многолетний опыт специалистов:
Подробнее – http://lechenie-alkogolizma-krasnodar0.ru/metody-lecheniya-alkogolizma-krasnodar/https://lechenie-alkogolizma-krasnodar0.ru
В клинике применяются комплексные программы, включающие медицинскую детоксикацию, психотерапевтическую поддержку и социальную реабилитацию. Медицинская детоксикация проводится с использованием современных препаратов и методик, что позволяет снизить тяжесть абстинентного синдрома и минимизировать риски для здоровья пациента. Подробнее о методах детоксикации можно узнать на официальном портале Министерства здравоохранения России.
Узнать больше – http://narkologicheskaya-klinika-chelyabinsk13.ru/narkologicheskaya-klinika-lechenie-alkogolizma-chelyabinsk/
Наши врачи имеют сертификаты Министерства здравоохранения РФ и европейские дипломы о дополнительном образовании. Это гарантирует, что вы получите помощь, основанную на последних исследованиях и передовых практиках наркологии.
Исследовать вопрос подробнее – вывод наркологическая клиника в волгограде
Своевременный вызов специалиста особенно важен при следующих признаках:
Исследовать вопрос подробнее – http://vyvod-iz-zapoya-mariupol13.ru
Нарколог на дом в Волгограде — это специализированная медицинская услуга, направленная на оказание квалифицированной помощи пациентам с зависимостями в привычной домашней обстановке. Такая форма лечения позволяет снизить стресс, связанный с госпитализацией, и обеспечивает более комфортное проведение медицинских процедур. Вызов нарколога на дом пользуется высокой востребованностью как среди пациентов с алкоголизмом, так и среди людей, страдающих от наркотической зависимости, а также при острых состояниях, требующих неотложного вмешательства.
Углубиться в тему – частный нарколог на дом
В Екатеринбургской наркологической клинике применяются передовые методики, такие как медикаментозная терапия с использованием современных препаратов, когнитивно-поведенческая терапия, групповые и индивидуальные занятия с психологом. Эти методы подробно описаны на портале наркологической помощи России. Это обеспечивает эффективное лечение хронических форм зависимости и предупреждение осложнений.
Разобраться лучше – narkologicheskaya klinika ekaterinburg
Вывод из запоя в Орехово-Зуево — это профессиональная экстренная помощь, предоставляемая наркологической клиникой «Гармония-Мед» на дому или в условиях современного стационара. Запой — тяжёлое состояние, при котором организм подвергается многодневному отравлению этанолом и продуктами его распада. Это критический момент в развитии алкогольной зависимости, опасный как для физического, так и для психического здоровья. Только своевременное и квалифицированное вмешательство позволяет предотвратить тяжёлые осложнения и вернуть пациента к полноценной жизни.
Подробнее тут – http://www.domen.ru
Сопутствующие патологии печени, почек, сердца или ЖКТ усугубляют последствия запоя. Без коррекции электролитного баланса и поддержки органов пациент рискует получить необратимые осложнения.
Детальнее – вывод из запоя дешево в челябинске
Врач уточняет, как долго продолжается запой, какой алкоголь употребляется, а также наличие сопутствующих заболеваний. Этот тщательный анализ позволяет оперативно подобрать оптимальные методы детоксикации и снизить риск осложнений.
Подробнее – наркология вывод из запоя тула
После основной терапии важно обеспечить поддержку пациента в период реабилитации. Реабилитационные программы в Краснодаре включают социальную адаптацию, восстановление навыков общения и трудоустройства. Это позволяет минимизировать риск рецидива и возвращения к употреблению алкоголя. Поддержка со стороны специалистов и близких — обязательное условие успешного результата. Более подробно о социальной реабилитации можно ознакомиться на сайте Федерального реабилитационного центра.
Углубиться в тему – https://lechenie-alkogolizma-krasnodar00.ru/lechenie-khronicheskogo-alkogolizma-krasnodar/
Каждый пациент проходит предварительное обследование: экспресс-анализ крови на электролиты, биохимия печени и почек, ЭКГ. На основании результатов врач формирует персональную программу инфузионной терапии.
Получить больше информации – капельница от запоя в челябинске
Запой – это критическое состояние, при котором организм подвергается сильной алкогольной интоксикации, что может привести к накоплению токсинов, нарушению обменных процессов и повреждению жизненно важных органов. В Туле, благодаря профессиональной помощи нарколога на дому, возможно оперативно начать лечение, не прибегая к госпитализации. Такой подход позволяет пациенту получить качественную терапию в комфортных условиях, сохраняя полную конфиденциальность и минимизируя стресс, связанный с посещением стационара.
Разобраться лучше – http://vyvod-iz-zapoya-tula00.ru/vyvod-iz-zapoya-na-domu-tula/
В клинике применяются инновационные методы диагностики, включая лабораторные анализы и аппаратные исследования, которые позволяют выявить степень зависимости и сопутствующие патологии. Важным этапом является комплексный подход к лечению, включающий детоксикацию организма, психотерапию и медикаментозную поддержку.
Разобраться лучше – http://narkologicheskaya-klinika-krasnodar00.ru/narkologicheskaya-klinika-anonimno-krasnodar/
Мы стремимся обеспечить пациентам максимальный уровень доверия и результативности лечения, сочетая передовые технологии и многолетний опыт специалистов:
Получить дополнительные сведения – анонимное лечение алкоголизма краснодар
Вызов нарколога на дом в Челябинске обеспечивает возможность проведения полного обследования и первичной терапии в условиях, привычных для пациента. Специалисты оказывают услуги круглосуточно, что позволяет своевременно купировать острые состояния, связанные с алкогольной интоксикацией, абстинентным синдромом или осложнениями наркозависимости.
Изучить вопрос глубже – вызов нарколога на дом челябинск
Вывод из запоя в Орехово-Зуево — это профессиональная экстренная помощь, предоставляемая наркологической клиникой «Гармония-Мед» на дому или в условиях современного стационара. Запой — тяжёлое состояние, при котором организм подвергается многодневному отравлению этанолом и продуктами его распада. Это критический момент в развитии алкогольной зависимости, опасный как для физического, так и для психического здоровья. Только своевременное и квалифицированное вмешательство позволяет предотвратить тяжёлые осложнения и вернуть пациента к полноценной жизни.
Подробнее тут – vyvod iz zapoya na domu kruglosutochno
Клиника оснащена современным оборудованием для мониторинга состояния пациентов и проведения процедур с максимальной безопасностью. Врачебный состав состоит из опытных наркологов, психиатров и психологов, регулярно повышающих квалификацию и применяющих доказательные методы лечения. На портале Российской медицинской ассоциации наркологов можно ознакомиться с рекомендациями по стандартам оказания наркологической помощи.
Выяснить больше – http://narkologicheskaya-klinika-chelyabinsk13.ru/narkologicheskaya-klinika-lechenie-alkogolizma-chelyabinsk/
Наша клиника работает по стандартам международного уровня, сочетая научно обоснованные методики с внимательным отношением к каждому пациенту. В «ВолгаМед» вы не столкнётесь с бюрократией или очередями — помощь оказывается сразу после обращения, а все процедуры проводятся в строгом соответствии с медицинскими протоколами и этическими нормами.
Детальнее – http://narkologicheskaya-klinika-volgograd13.ru
Наркологическая клиника в Екатеринбурге уделяет большое внимание психотерапевтическим методам. Индивидуальный подход к пациенту позволяет выявить причины и особенности зависимости, сформировать устойчивую мотивацию на лечение и отказ от вредных привычек.
Получить дополнительные сведения – http://narcologicheskaya-klinika-ekaterinburg00.ru/chastnaya-narkologicheskaya-klinika-v-ekaterinburge/
Лечение в наркологической клинике в Краснодаре строится на комплексном подходе, включающем медикаментозную терапию, психотерапевтическую помощь и социальную реабилитацию. Медикаментозное лечение направлено на детоксикацию организма и снижение симптомов абстиненции, что позволяет значительно улучшить состояние пациента в первые дни терапии. Современные препараты, применяемые в лечении зависимости, сертифицированы и соответствуют международным стандартам, что подтверждается на сайте Всемирной организации здравоохранения.
Узнать больше – http://narkologicheskaya-klinika-krasnodar0.ru/platnaya-narkologicheskaya-klinika-krasnodar/
В «Север-Мед» реализованы все основные направления наркологической помощи. Первичным этапом является консультация нарколога, включающая сбор анамнеза, оценку тяжести зависимости и назначение диагностических исследований (общий и биохимический анализ крови, УЗИ брюшной полости, ЭКГ).
Исследовать вопрос подробнее – платная наркологическая клиника
Капельница от запоя — это быстрый и безопасный способ вывести токсины, восстановить водно-солевой баланс и улучшить общее самочувствие. Наркологи клиники «ТрезвоКлиник» оказывают круглосуточную медицинскую помощь на дому, используя только сертифицированные препараты и проверенные методики детоксикации.
Углубиться в тему – https://kapelnica-ot-zapoya-moskva0.ru/kapelnicza-ot-zapoya-czena-msk/
Нельзя игнорировать первые признаки серьёзного алкогольного отравления: промедление повышает риск судорожных припадков, остановки дыхания и комы. Нарколог на дом в Реутове рекомендован при следующих симптомах:
Получить больше информации – вывод из запоя вызов
Этот информационный материал собраны данные, которые помогут лучше понять текущие тенденции и процессы в различных сферах жизни. Мы предоставляем четкий анализ, графики и примеры, чтобы информация была не только понятной, но и практичной для принятия решений.
Узнать напрямую – https://jovannbuilders.com/hello-world
Этот информативный текст отличается привлекательным содержанием и актуальными данными. Мы предлагаем читателям взглянуть на привычные вещи под новым углом, предоставляя интересный и доступный материал. Получите удовольствие от чтения и расширьте кругозор!
Погрузиться в научную дискуссию – https://www.bretagneidlarge.org/court-defeat-for-trump-is-a-win-for-the-arctic-court-defeat-for-trump-is-a-win-for-the-arctic
Эта публикация дает возможность задействовать различные источники информации и представить их в удобной форме. Читатели смогут быстро найти нужные данные и получить ответы на интересующие их вопросы. Мы стремимся к четкости и доступности материала для всех!
Ознакомьтесь с аналитикой – https://f5fashion.vn/trac-nghiem-tam-ly-trong-4-con-ngua-nay-con-ngua-nao-tot-nhat-khi-nao-cuoc-doi-ban-se-sang-trang
Эта статья предлагает живое освещение актуальной темы с множеством интересных фактов. Мы рассмотрим ключевые моменты, которые делают данную тему важной и актуальной. Подготовьтесь к насыщенному путешествию по неизвестным аспектам и узнайте больше о значимых событиях.
Секреты успеха внутри – https://taxipuntacanabelen.com/hello-world
Публикация приглашает вас исследовать неизведанное — от древних тайн до современных достижений науки. Вы узнаете, как случайные находки превращались в революции, а смелые мысли — в новые эры человеческого прогресса.
Ознакомьтесь с аналитикой – https://www.chatadoubravka.cz/component/k2/item/14-do-what-you-like?start=340
Мы собрали для вас самые захватывающие факты из мира науки и истории. От малознакомых деталей до грандиозных событий — эта статья расширит ваш кругозор и подарит новое понимание того, как устроен наш мир.
Это стоит прочитать полностью – https://zona-dle.ru
В статье представлены ключевые моменты по актуальной теме, дополненные советами экспертов и ссылками на дополнительные ресурсы. Цель материала — дать читателю инструменты для самостоятельного развития и принятия осознанных решений.
Смотрите также… – https://f5fashion.vn/chia-se-voi-hon-51-ve-cafe-to-chuc-sinh-nhat-moi-nhat
В этом информативном тексте представлены захватывающие события и факты, которые заставят вас задуматься. Мы обращаем внимание на важные моменты, которые часто остаются незамеченными, и предлагаем новые перспективы на привычные вещи. Подготовьтесь к тому, чтобы быть поглощенным увлекательными рассказами!
Следуйте по ссылке – https://medianagames.wpxblog.jp/%E3%80%90%E3%82%BD%E3%82%A6%E3%83%AB%E3%82%B9%E3%83%88%E3%83%A9%E3%82%A4%E3%82%AF%E3%80%91%E5%88%9D%E5%BF%83%E8%80%85%E5%90%91%E3%81%91%E3%83%97%E3%83%AC%E3%82%A4%E9%96%8B%E5%A7%8B%E3%81%8B%E3%82%89
Этот информационный материал собраны данные, которые помогут лучше понять текущие тенденции и процессы в различных сферах жизни. Мы предоставляем четкий анализ, графики и примеры, чтобы информация была не только понятной, но и практичной для принятия решений.
Все материалы собраны здесь – http://kassandrarochefort.com/logo_kassandrarochefort-05
В этой статье-обзоре мы соберем актуальную информацию и интересные факты, которые освещают важные темы. Читатели смогут ознакомиться с различными мнениями и подходами, что позволит им расширить кругозор и глубже понять обсуждаемые вопросы.
Ознакомиться с деталями – https://f5fashion.vn/goi-ten-4-con-giap-xui-xeo-thang-9-2023-kho-khan-giang-loi
В этой статье вы найдете познавательную и занимательную информацию, которая поможет вам лучше понять мир вокруг. Мы собрали интересные данные, которые вдохновляют на размышления и побуждают к действиям. Открывайте новую информацию и получайте удовольствие от чтения!
Смотрите также – https://fd-performance.com/project/the7-creative-agency
Предлагаем вашему вниманию интересную справочную статью, в которой собраны ключевые моменты и нюансы по актуальным вопросам. Эта информация будет полезна как для профессионалов, так и для тех, кто только начинает изучать тему. Узнайте ответы на важные вопросы и расширьте свои знания!
Смотри, что ещё есть – https://www.kunstmetstip.nl/portfolio/kvc_poster
Мы предлагаем вам подробное руководство, основанное на проверенных источниках и реальных примерах. Каждая часть публикации направлена на то, чтобы помочь вам разобраться в сложных вопросах и применить знания на практике.
Лучшее решение — прямо здесь – https://f5fashion.vn/top-hon-63-ve-tranh-to-mau-anime-nam-moi-nhat
В статье представлены ключевые моменты по актуальной теме, дополненные советами экспертов и ссылками на дополнительные ресурсы. Цель материала — дать читателю инструменты для самостоятельного развития и принятия осознанных решений.
Смотрите также… – https://f5fashion.vn/chia-se-56-ve-hinh-nen-de-gea-dep-hay-nhat
В этой публикации мы предлагаем подробные объяснения по актуальным вопросам, чтобы помочь читателям глубже понять их. Четкость и структурированность материала сделают его удобным для усвоения и применения в повседневной жизни.
Углубить понимание вопроса – https://pozdrabook.ru
Этот интересный отчет представляет собой сборник полезных фактов, касающихся актуальных тем. Мы проанализируем данные, чтобы вы могли сделать обоснованные выводы. Читайте, чтобы узнать больше о последних трендах и значимых событиях!
Получить исчерпывающие сведения – https://ehsuy.com/cual-es-el-tiempo-de-vida-de-un-carro
В этой информационной статье вы найдете интересное содержание, которое поможет вам расширить свои знания. Мы предлагаем увлекательный подход и уникальные взгляды на обсуждаемые темы, побуждая пользователей к активному мышлению и критическому анализу.
Следуйте по ссылке – https://cursosinemweb.es/oficina-virtual-de-empleo
Публикация предлагает уникальную подборку информации, которая будет интересна как специалистам, так и широкому кругу читателей. Здесь вы найдете ответы на часто задаваемые вопросы и полезные инсайты для дальнейшего применения.
Ознакомьтесь с аналитикой – https://f5fashion.vn/thoi-trang-kho-cam-cua-top-4-miss-earth-2023
Эта информационная заметка содержит увлекательные сведения, которые могут вас удивить! Мы собрали интересные факты, которые сделают вашу жизнь ярче и полнее. Узнайте нечто новое о привычных аспектах повседневности и откройте для себя удивительный мир информации.
Более подробно об этом – https://cocktailsandsteaks.co.uk/home/attachment/smirnoff-cocktails-portrait
Эта публикация завернет вас в вихрь увлекательного контента, сбрасывая стереотипы и открывая двери к новым идеям. Каждый абзац станет для вас открытием, полным ярких примеров и впечатляющих достижений. Подготовьтесь быть вовлеченными и удивленными каждый раз, когда продолжите читать.
Получить полную информацию – https://www.koebrugge.com/hallo-wereld
В этом обзорном материале представлены увлекательные детали, которые находят отражение в различных аспектах жизни. Мы исследуем непонятные и интересные моменты, позволяя читателю увидеть картину целиком. Погрузитесь в мир знаний и удивительных открытий!
Не пропусти важное – https://jornalbaixadasantista.com.br/2023/07/08/chega-ao-fim-a-luta-de-simony-contra-o-cancer
Этот увлекательный информационный материал подарит вам массу новых знаний и ярких эмоций. Мы собрали для вас интересные факты и сведения, которые обогатят ваш опыт. Откройте для себя увлекательный мир информации и насладитесь процессом изучения!
Разобраться лучше – http://vovinamcanada.com/responsive
Эта статья для ознакомления предлагает читателям общее представление об актуальной теме. Мы стремимся представить ключевые факты и идеи, которые помогут читателям получить представление о предмете и решить, стоит ли углубляться в изучение.
Изучить аспект более тщательно – https://www.kunstmetstip.nl/portfolio/kvc_poster
Алкоголизм — хроническое заболевание, требующее профессионального подхода и комплексной терапии. В Екатеринбурге наркологическая клиника «УралРеаб» предлагает бесплатную первичную консультацию, на которой опытные специалисты проведут оценку состояния, подберут оптимальную программу лечения и обеспечат поддержку на каждом этапе реабилитации. Благодаря индивидуальным протоколам терапии и современным методикам выздоровление становится более безопасным и эффективным.
Детальнее – http://lechenie-alkogolizma-ekaterinburg00.ru
Этот информативный текст выделяется своими захватывающими аспектами, которые делают сложные темы доступными и понятными. Мы стремимся предложить читателям глубину знаний вместе с разнообразием интересных фактов. Откройте новые горизонты и развивайте свои способности познавать мир!
Смотрите также… – https://f5fashion.vn/columbus-oh-bloom-carroll-bentley-spurlock-obituary-and-death-cause-linked-to-illness
Этот увлекательный информационный материал подарит вам массу новых знаний и ярких эмоций. Мы собрали для вас интересные факты и сведения, которые обогатят ваш опыт. Откройте для себя увлекательный мир информации и насладитесь процессом изучения!
Читать дальше – https://www.taylordentist.com/benefits-of-pinhole-technique-vs-gum-grafting
Детоксикация организма, проводимая на дому, помогает очистить кровь от токсинов, накопившихся из-за длительного употребления алкоголя или наркотических веществ. Она проводится с использованием специально подобранных медикаментов, которые улучшают работу печени, почек и других органов.
Получить дополнительные сведения – нарколог на дом клиника красноярск
Первый этап лечения направлен на быстрый вывод токсинов, накопившихся в организме вследствие длительного употребления алкоголя. Для этого применяются современные препараты, позволяющие очистить кровь и восстановить нормальный обмен веществ.
Углубиться в тему – нарколог на дом вывод из запоя
Внутривенная инфузия – это один из самых быстрых и безопасных способов очистки организма от алкоголя и его токсичных продуктов распада. Она позволяет:
Подробнее тут – https://kapelnica-ot-zapoya-krasnoyarsk6.ru
Обращение за наркологической помощью на дому требуется в случаях, когда состояние пациента не позволяет ему самостоятельно посетить клинику или есть необходимость в анонимном лечении.
Подробнее можно узнать тут – помощь нарколога на дому в иркутске
Красноярск, как и любой крупный город, сталкивается с распространенными проблемами зависимости. Учитывая высокий уровень стресса, социальное давление и быстрое развитие мегаполиса, люди часто оказываются в сложных ситуациях, связанных с алкогольной или наркотической зависимостью. В таких случаях своевременная помощь квалифицированного нарколога становится не просто желательной, а жизненно необходимой.
Получить дополнительные сведения – нарколог на дом вывод
Когда организм на пределе, важна срочная помощь в Екатеринбурге — это команда опытных наркологов, которые помогут быстро и мягко выйти из запоя без вреда для здоровья.
Получить больше информации – http://vyvod-iz-zapoya-ekaterinburg.ru
Затяжной запой опасен для жизни. Врачи наркологической клиники в Екатеринбурге проводят срочный вывод из запоя — на дому или в стационаре. Анонимно, безопасно, круглосуточно.
Разобраться лучше – наркологический вывод из запоя
В Екатеринбурге решение есть — наркологическая клиника. Здесь помогают людям выйти из запоя без страха и осуждения. Всё анонимно, грамотно и с заботой о каждом пациенте.
Подробнее – вывод из запоя круглосуточно в екатеринбурге
Наркологическая клиника “Путь к выздоровлению” расположена по адресу: г. Ростов-на-Дону, ул. Петровская, д. 19. Клиника работает ежедневно с 8:00 до 20:00, без выходных. Наши специалисты готовы предоставить консультацию и ответить на все вопросы, связанные с лечением зависимостей. Мы гарантируем конфиденциальность и индивидуальный подход к каждому пациенту.
Подробнее тут – http://нарко-фильтр.рф/vivod-iz-zapoya-cena-v-rostove-na-donu/
Кроме того, врач оказывает психологическую поддержку, которая помогает пациенту справиться с чувством тревоги, депрессией и страхом, возникающими на фоне зависимости.
Подробнее можно узнать тут – нарколог на дом анонимно в красноярске
Каждый из наших врачей не только специалист, но и психолог, способный понять переживания пациента, создать атмосферу доверия. Мы применяем индивидуальный подход, позволяя каждому пациенту чувствовать себя комфортно. Наши наркологи проводят тщательную диагностику, разрабатывают планы лечения, основываясь на данных обследования, психологическом состоянии и других факторах. Основное внимание уделяется снижению абстиненции, лечению сопутствующих заболеваний, коррекции психоэмоционального состояния.
Получить больше информации – срочный вывод из запоя смоленск
Наркологическая клиника “Маяк надежды” расположена по адресу: г. Санкт-Петербург, ул. Колпинская, д. 27. Клиника работает ежедневно с 9:00 до 21:00, без выходных. Наши специалисты готовы предоставить консультацию и ответить на все вопросы, связанные с лечением зависимостей. Мы гарантируем конфиденциальность и индивидуальный подход к каждому пациенту.
Разобраться лучше – http://алко-лечение24.рф/vivod-iz-zapoya-cena-v-Sankt-Peterburge/
Существуют различные методы и стратегии, которые применяются для устранения зависимостей. Каждый случай уникален, поэтому важно проводить глубокую диагностику и индивидуально разрабатывать план лечения. Мы понимаем, что борьба с зависимостью — это длительный процесс, требующий как медицинской, так и психологической поддержки.
Получить больше информации – http://zavisim-alko.ru
Профессиональная помощь при запое необходима, если:
Разобраться лучше – вывод из запоя вызов на дом в санкт-петербурге
Комплексный подход: лечение зависимости — это процесс, включающий медикаментозную терапию, психотерапевтическую помощь, физиотерапию и социальную реабилитацию.
Подробнее тут – вывод из запоя вызов
Оптимально для пациентов в стабильном состоянии. Процедура начинается с приезда врача, осмотра и постановки капельницы с индивидуально подобранными растворами.
Выяснить больше – наркология вывод из запоя в новосибирске
Этанол связывается с ГАМК-рецепторами, усиливая тормозные процессы в ЦНС, что ведёт к снижению рефлексов и когнитивных функций. Одновременно происходит повышение активности дофаминовых путей, вызывая ощущение кратковременного «успокоения» и «радости». При прекращении поступления алкоголя к рецепторам наступает синдром отмены — резкое возбуждение, тревожность и дисбаланс нейротрансмиттеров.
Разобраться лучше – срочный вывод из запоя
Наши наркологи придерживаются принципов уважительного и чуткого отношения, что создаёт атмосферу доверия. Специалисты проводят детальную диагностику, выявляют причины зависимости и разрабатывают персональные стратегии лечения. Компетентность и профессионализм врачей — залог успешного восстановления пациентов.
Подробнее тут – вывод из запоя на дому ростов-на-дону
Затяжной запой представляет собой состояние, при котором организм накапливает токсичные продукты распада алкоголя, нарушается работа сердца, печени и нервной системы. Без своевременного медицинского вмешательства возможны серьёзные осложнения: судороги, алкогольный психоз и острые нарушения гемодинамики. В Красноярске клиника «Красмед» предлагает круглосуточную службу вывода из запоя с применением передовых методик детоксикации и постоянным контролем состояния пациента.
Исследовать вопрос подробнее – нарколог вывод из запоя в красноярске
Когда организм на пределе, важна срочная помощь в Екатеринбурге — это команда опытных наркологов, которые помогут быстро и мягко выйти из запоя без вреда для здоровья.
Получить дополнительные сведения – вывод из запоя капельница город екатеринбург
Каждый день запоя увеличивает риск для жизни. Не рискуйте — специалисты в Екатеринбурге приедут на дом и окажут экстренную помощь. Без боли, стресса и ожидания.
Получить больше информации – вывод из запоя круглосуточно в екатеринбурге
Детоксикация проводится в комфортных условиях, под постоянным наблюдением медперсонала. Пациенту назначают инфузионную терапию, препараты для поддержки печени, сердца, нервной системы. При выраженных абстинентных симптомах используются современные методы купирования синдрома — всё под контролем опытных врачей. Важно, что лечение в стационаре позволяет не только быстро купировать симптомы, но и вовремя скорректировать терапию при появлении осложнений.
Получить дополнительные сведения – narkologicheskaya-klinika-balashiha5.ru/
Близкий человек в запое? Не ждите ухудшения. Обратитесь в клинику — здесь проведут профессиональный вывод из запоя с последующим восстановлением организма.
Ознакомиться с деталями – вывод из запоя анонимно в екатеринбурге
Дисфункция нейромедиаторных систем головного мозга, обусловленная длительным воздействием психоактивных веществ, приводит к формированию патологического влечения — абстинентного синдрома.
Исследовать вопрос подробнее – http://
Современные технологии позволяют:
Подробнее – вывод из запоя на дому круглосуточно
Детоксикация организма, проводимая на дому, помогает очистить кровь от токсинов, накопившихся из-за длительного употребления алкоголя или наркотических веществ. Она проводится с использованием специально подобранных медикаментов, которые улучшают работу печени, почек и других органов.
Подробнее можно узнать тут – narkolog-na-dom krasnojarsk
В клинике «Решение+» предусмотрены оба основных формата: выезд на дом и лечение в стационаре. Домашний вариант подойдёт тем, чьё состояние относительно стабильно, нет риска тяжёлых осложнений. Врач приезжает с полным комплектом оборудования и медикаментов, проводит капельницу на дому и даёт инструкции по дальнейшему уходу.
Получить дополнительную информацию – вывод из запоя ногинск
Следующий этап — реабилитация: индивидуальная и групповая психотерапия, восстановление эмоционального фона, обучение навыкам самоконтроля и профилактики рецидивов. При необходимости привлекаются дополнительные специалисты — психологи, психиатры, кардиологи. Важно, что в клинике «ВитаРеабилит» в Подольске большое внимание уделяется не только медицинской, но и психологической поддержке пациента и его семьи.
Углубиться в тему – https://narkologicheskaya-klinika-podolsk5.ru/chastnaya-narkologicheskaya-klinika-v-podolske/
В подобных случаях вывод из запоя в домашних условиях без врачебного контроля крайне опасен и может привести к тяжёлым последствиям. Лучше сразу вызвать нарколога или привезти пациента в клинику — это поможет избежать критических осложнений.
Подробнее – vyvod-iz-zapoya-cena-balashiha
Помимо физической детоксикации, лечение запоя требует комплексной психологической поддержки. Психотерапевты работают с пациентами для выявления глубинных причин зависимости, помогают снизить уровень стресса и развивают навыки самоконтроля, что критически важно для предотвращения рецидивов.
Разобраться лучше – наркология вывод из запоя красноярск
Мы верим, что каждый человек, столкнувшийся с проблемой зависимости, заслуживает шанса на новую жизнь. Наша миссия — предоставить необходимые инструменты и поддержку, чтобы помочь пациентам в их стремлении к здоровой и свободной от зависимостей жизни.
Детальнее – https://нарко-фильтр.рф/vivod-iz-zapoya-v-kruglosutochno-v-rostove-na-donu/
В клинике каждому пациенту уделяют особое внимание. Врачи знают: универсальных решений нет, за каждым случаем — своя история и свои причины. Первый контакт начинается с конфиденциальной консультации. Можно просто позвонить или написать онлайн — уже на этом этапе врач поможет оценить ситуацию, объяснит возможные этапы и даст рекомендации по подготовке к визиту.
Выяснить больше – http://lechenie-alkogolizma-korolev5.ru/
Если узнаёте подобные признаки у себя или у родственника — не ждите кризиса. Чем быстрее обратиться за профессиональной поддержкой, тем легче вернуть здоровье и гармонию в семью.
Исследовать вопрос подробнее – https://lechenie-alkogolizma-korolev5.ru/lechenie-alkogolizma-anonimno-v-koroleve/
Да, многие клиники выезжают в Ленинградскую область — в радиусе 50–100 км от Санкт-Петербурга. Время прибытия согласуется при обращении.
Подробнее можно узнать тут – вывод из запоя недорого санкт-петербург
Проблемы зависимости — актуальная тема для современного общества. Эти состояния оказывают серьезное влияние на личность, семью и общественные связи. Наркологическая клиника “Перезагрузка” предлагает широкий спектр услуг для людей, страдающих от различных зависимостей, таких как алкоголизм, наркомания и игромания. Наша задача заключается в комплексном подходе к лечению, что обеспечивает успешные результаты для наших пациентов.
Подробнее тут – нарколог на дом вывод из запоя
Современная наркология предлагает два основных формата вывода из запоя:
Детальнее – врач вывод из запоя в санкт-петербруге
Среди основных задач клиники выделяются помощь людям, страдающим от хронического алкоголизма, наркозависимости, игромании и других расстройств. Мы осознаём, что каждый случай уникален, и подходим к каждому пациенту индивидуально, предлагая персонализированные программы лечения, учитывающие все аспекты его состояния. Основное внимание уделяется не только физическому, но и психологическому состоянию пациента, что позволяет более эффективно преодолевать зависимость.
Подробнее тут – https://alko-konsultaciya.ru/vivod-iz-zapoya-cena-v-smolenske
Вывод из запоя может осуществляться в двух форматах — на дому и в стационаре. Выбор зависит от степени интоксикации, наличия осложнений и возможности обеспечить пациенту наблюдение в домашних условиях.
Детальнее – анонимный вывод из запоя
Индивидуальный подход: каждый пациент уникален, поэтому мы разрабатываем индивидуальный план лечения, учитывающий вид зависимости, стадию заболевания и особенности здоровья пациента.
Подробнее можно узнать тут – вывод из запоя в стационаре в уфе
Чем раньше начато лечение, тем выше вероятность полного восстановления здоровья без тяжёлых последствий для организма и психики. В клинике «Наркосфера» к каждому случаю подходят максимально внимательно и индивидуально.
Углубиться в тему – наркологическая клиника стационар
В Екатеринбурге решение есть — наркологическая клиника. Здесь помогают людям выйти из запоя без страха и осуждения. Всё анонимно, грамотно и с заботой о каждом пациенте.
Узнать больше – вывод из запоя на дому свердловская область
В Екатеринбурге решение есть — наркологическая клиника. Здесь помогают людям выйти из запоя без страха и осуждения. Всё анонимно, грамотно и с заботой о каждом пациенте.
Получить больше информации – нарколог вывод из запоя в екатеринбурге
Состав инфузии подбирается врачом индивидуально, с учётом состояния пациента, длительности запоя, возраста и хронических заболеваний.
Углубиться в тему – врач на дом капельница от запоя красноярск
Срочный вызов нарколога необходим, если:
Получить дополнительную информацию – вызвать нарколога на дом в иркутске
Каждый день запоя увеличивает риск для жизни. Не рискуйте — специалисты в Екатеринбурге приедут на дом и окажут экстренную помощь. Без боли, стресса и ожидания.
Ознакомиться с деталями – срочный вывод из запоя в екатеринбурге
Команда клиники «Новый шанс» состоит из опытных специалистов-наркологов, которые имеют многолетнюю практику работы с пациентами, находящимися в зависимости, и регулярно совершенствуют свои знания.
Разобраться лучше – вывод из запоя дешево
Кроме того, врач оказывает психологическую поддержку, которая помогает пациенту справиться с чувством тревоги, депрессией и страхом, возникающими на фоне зависимости.
Углубиться в тему – https://narcolog-na-dom-v-krasnoyarske55.ru/narkolog-na-dom-kruglosutochno-krasnoyarsk/
Попытки пациента самостоятельно прекратить употребление психоактивных веществ приводят к развитию мучительного абстинентного синдрома, который проявляется в виде физических и психических страданий.
Выяснить больше – https://алко-консультация.рф/vivod-iz-zapoya-v-kruglosutochno-v-Moskve/
При сильной интоксикации требуется полное очищение организма от токсинов. Детоксикация помогает нормализовать работу внутренних органов, улучшить общее состояние пациента и восстановить баланс жидкостей в организме. Специалист использует современные препараты, включая электролиты, глюкозу и антиоксиданты, для безопасного и эффективного очищения организма.
Получить дополнительные сведения – выезд нарколога на дом
Миссия клиники “Маяк надежды” заключается в содействии восстановлению здоровья и социальной реинтеграции людей, столкнувшихся с проблемами зависимости. Мы стремимся к комплексному решению этой сложной задачи, учитывая физические, психологические и социальные аспекты зависимости. Наша задача — не только помочь пациентам избавиться от физической зависимости, но и обеспечить их психологическое восстановление и возвращение к нормальной жизни в обществе.
Детальнее – http://алко-лечение24.рф
Для максимальной эффективности и безопасности «Красмед» использует комбинированные подходы:
Детальнее – врач вывод из запоя
Врачебный состав клиники “Путь к выздоровлению” состоит из высококвалифицированных специалистов в области наркологии. Наши врачи-наркологи имеют обширный опыт работы с зависимыми пациентами и постоянно совершенствуют свои навыки.
Ознакомиться с деталями – http://нарко-фильтр.рф
Самостоятельно выйти из запоя — почти невозможно. В Екатеринбурге врачи клиники проводят медикаментозный вывод из запоя с круглосуточным выездом. Доверяйте профессионалам.
Ознакомиться с деталями – https://vyvod-iz-zapoya-ekaterinburg.ru
В стационаре пациент получает круглосуточный контроль, расширенную диагностику и возможность подключения к аппаратуре мониторинга. Это особенно важно при тяжёлой интоксикации, нарушении сознания или судорожной активности.
Подробнее тут – нарколог на дом вывод из запоя в санкт-петербурге
В период восстановления пациент получает психологическую поддержку, работает с психотерапевтом, осваивает навыки самоконтроля, учится противостоять стрессу без возвращения к прежним привычкам. После выписки возможно амбулаторное сопровождение, дистанционные консультации и поддержка для всей семьи.
Выяснить больше – http://narkologicheskaya-klinika-balashiha5.ru
Современная жизнь, особенно в крупном городе, как Красноярск, часто становится причиной различных зависимостей. Работа в условиях постоянного стресса, высокий ритм жизни и эмоциональные перегрузки могут привести к проблемам, которые требуют неотложной медицинской помощи. Одним из наиболее удобных решений в такой ситуации является вызов нарколога на дом.
Детальнее – нарколог на дом срочно в красноярске
Затяжной запой опасен для жизни. Врачи наркологической клиники в Екатеринбурге проводят срочный вывод из запоя — на дому или в стационаре. Анонимно, безопасно, круглосуточно.
Подробнее – http://vyvod-iz-zapoya-ekaterinburg11.ru/
Каждый пациент в «НаркоМедцентре» в Балашихе с самого начала окружён вниманием и заботой. Сразу после обращения по телефону или через сайт медицинский персонал консультирует родственников, уточняет детали состояния, даёт рекомендации по первой помощи и при необходимости отправляет бригаду наркологов на дом. В случае тяжёлых абстинентных проявлений возможно экстренное транспортирование пациента в стационар.
Углубиться в тему – анонимный вывод из запоя
Мы акцентируем внимание на следующих аспектах в нашей работе:
Получить дополнительную информацию – скорая вывод из запоя краснодар
Этанол связывается с ГАМК-рецепторами, усиливая тормозные процессы в ЦНС, что ведёт к снижению рефлексов и когнитивных функций. Одновременно происходит повышение активности дофаминовых путей, вызывая ощущение кратковременного «успокоения» и «радости». При прекращении поступления алкоголя к рецепторам наступает синдром отмены — резкое возбуждение, тревожность и дисбаланс нейротрансмиттеров.
Разобраться лучше – http://nadezhnyj-vyvod-iz-zapoya.ru
Показана в тяжёлых случаях или при наличии сопутствующих заболеваний. Лечение проходит под круглосуточным наблюдением врачей и медсестёр с постоянной корректировкой терапии.
Углубиться в тему – http://narko-zakodirovan2.ru
Наркологический центр “Чистое Завтра” специализируется на лечении и реабилитации пациентов с различными формами зависимостей. Наша деятельность базируется на принципах доказательной медицины, биопсихосоциальной модели аддикции, индивидуальном подходе к каждому пациенту. Мы используем современные протоколы лечения, эффективность которых подтверждена многочисленными клиническими исследованиями.
Выяснить больше – https://алко-консультация.рф
Комплексный подход: лечение зависимости — это процесс, включающий медикаментозную терапию, психотерапевтическую помощь, физиотерапию и социальную реабилитацию.
Ознакомиться с деталями – http://srochno-vyvod-iz-zapoya.ru
Миссия клиники заключается в предоставлении качественной помощи людям, страдающим от различных зависимостей. Мы понимаем, что зависимость — это заболевание, требующее комплексного подхода. В “Клиника Наркологии и Психотерапии” мы стремимся создать атмосферу доверия, где каждый пациент может открыто говорить о своих проблемах, получая поддержку от опытных специалистов. Наша команда предлагает лечение, основанное на научных данных и современных методах, что позволяет достигать высоких результатов.
Детальнее – анонимный вывод из запоя в смоленске
Обращение в клинику начинается с подробной консультации, где пациент или его родственники могут задать любые вопросы о методах лечения, продолжительности курса и возможностях реабилитации. Первый этап — диагностика: анализы, осмотр врача-нарколога, оценка общего состояния и выявление сопутствующих заболеваний.
Углубиться в тему – анонимная наркологическая клиника
Алкогольная зависимость – заболевание, при котором страдает не только тело, но и психика человека. При длительных запоях нарушается работа сердца, печени, почек, появляются острые психоэмоциональные расстройства: тревожность, страхи, агрессия, проблемы со сном. В стадии абстиненции часто отмечается учащённый пульс, скачки давления, дрожь в руках, галлюцинации. Это крайне опасное состояние, требующее профессионального вмешательства нарколога. Клиника «Решение+» в Ногинске предлагает квалифицированный вывод из запоя на дому и в стационаре — с индивидуальным подходом, круглосуточной поддержкой и полным соблюдением анонимности.
Детальнее – https://vyvod-iz-zapoya-noginsk5.ru/vyvod-iz-zapoya-na-domu-v-noginske
Наши наркологи придерживаются принципов уважительного и чуткого отношения, что создаёт атмосферу доверия. Специалисты проводят детальную диагностику, выявляют причины зависимости и разрабатывают персональные стратегии лечения. Компетентность и профессионализм врачей — залог успешного восстановления пациентов.
Получить дополнительные сведения – вывод из запоя на дому круглосуточно ростов-на-дону
Когда организм на пределе, важна срочная помощь в Екатеринбурге — это команда опытных наркологов, которые помогут быстро и мягко выйти из запоя без вреда для здоровья.
Детальнее – вывод из запоя капельница город екатеринбург
Зависимость от алкоголя или наркотиков — серьёзная проблема, которая постепенно разрушает жизнь, подрывает здоровье, нарушает семейные отношения и ведёт к социальной изоляции. Попытки самостоятельно справиться с заболеванием редко приводят к успеху и зачастую только усугубляют ситуацию. Важно не терять время и обращаться за профессиональной помощью. В наркологической клинике «Наркосфера» в Балашихе пациентов ждёт современное оборудование, команда опытных специалистов, индивидуальный подход и абсолютная анонимность.
Разобраться лучше – narkologicheskaya-klinika-balashiha5.ru/
Каждый день запоя увеличивает риск для жизни. Не рискуйте — специалисты в Екатеринбурге приедут на дом и окажут экстренную помощь. Без боли, стресса и ожидания.
Подробнее тут – срочный вывод из запоя в екатеринбурге
Врачебный состав клиники “Путь к выздоровлению” состоит из высококвалифицированных специалистов в области наркологии. Наши врачи-наркологи имеют обширный опыт работы с зависимыми пациентами и постоянно совершенствуют свои навыки.
Подробнее можно узнать тут – https://нарко-фильтр.рф/vivod-iz-zapoya-v-stacionare-v-rostove-na-donu/
Если пациент находится в остром состоянии — начинается с детоксикации. Это не только капельницы для вывода токсинов и восстановления баланса в организме, но и поддержка работы сердца, печени, почек, купирование тревоги и бессонницы, снятие судорог, коррекция давления. Весь процесс проходит под наблюдением опытного нарколога, который учитывает хронические заболевания, особенности организма, степень интоксикации.
Разобраться лучше – https://lechenie-alkogolizma-korolev5.ru/
Затяжной запой опасен для жизни. Врачи наркологической клиники в Екатеринбурге проводят срочный вывод из запоя — на дому или в стационаре. Анонимно, безопасно, круглосуточно.
Подробнее – вывод из запоя на дому в екатеринбурге
В стационаре пациент получает круглосуточный контроль, расширенную диагностику и возможность подключения к аппаратуре мониторинга. Это особенно важно при тяжёлой интоксикации, нарушении сознания или судорожной активности.
Узнать больше – вывод из запоя дешево санкт-петербург
Аддиктивное поведение, проявляющееся в форме алкоголизма, наркомании, игровой зависимости — это комплексное био-психо-социальное расстройство, требующее квалифицированного вмешательства.
Подробнее можно узнать тут – http://алко-консультация.рф/vivod-iz-zapoya-cena-v-Moskve/
Неотъемлемой частью программы становится психотерапия — работа с мотивацией, психологической поддержкой, поиском и устранением “триггеров” зависимости, проработка самооценки, стрессоустойчивости. К работе обязательно подключаются близкие: совместные консультации помогают восстановить доверие, снизить уровень конфликтов, научиться поддерживать без контроля и упрёков.
Получить дополнительные сведения – лечение алкоголизма на дому стоимость
Существуют различные методы и стратегии, которые применяются для устранения зависимостей. Каждый случай уникален, поэтому важно проводить глубокую диагностику и индивидуально разрабатывать план лечения. Мы понимаем, что борьба с зависимостью — это длительный процесс, требующий как медицинской, так и психологической поддержки.
Детальнее – срочный вывод из запоя краснодар
Запой — это не просто временная слабость, а критическое состояние, требующее экстренного медицинского вмешательства. Особенно опасно откладывать обращение за помощью, если у человека наблюдаются такие симптомы:
Изучить вопрос глубже – vyvod-iz-zapoya-s-vyezdom
Этанол связывается с ГАМК-рецепторами, усиливая тормозные процессы в ЦНС, что ведёт к снижению рефлексов и когнитивных функций. Одновременно происходит повышение активности дофаминовых путей, вызывая ощущение кратковременного «успокоения» и «радости». При прекращении поступления алкоголя к рецепторам наступает синдром отмены — резкое возбуждение, тревожность и дисбаланс нейротрансмиттеров.
Получить дополнительную информацию – вывод из запоя вызов на дом
Затяжной запой — это состояние, при котором человек в течение нескольких дней не может прекратить употребление алкоголя без медицинской помощи. Такое состояние чревато тяжёлыми нарушениями в работе внутренних органов и психики. В Новосибирске и Новосибирской области доступен профессиональный вывод из запоя как на дому, так и в условиях стационара. Подход к лечению индивидуален, и основная цель — безопасно и эффективно устранить последствия интоксикации и предотвратить рецидив.
Узнать больше – скорая вывод из запоя новосибирск
Вывод из запоя в «Сибирском Докторе» происходит в несколько взаимосвязанных этапов:
Получить дополнительную информацию – вывод из запоя на дому
В статье представлены ключевые моменты по актуальной теме, дополненные советами экспертов и ссылками на дополнительные ресурсы. Цель материала — дать читателю инструменты для самостоятельного развития и принятия осознанных решений.
Только факты! – https://www.marshabrink.nl/contact
Самостоятельно выйти из запоя — почти невозможно. В Екатеринбурге врачи клиники проводят медикаментозный вывод из запоя с круглосуточным выездом. Доверяйте профессионалам.
Получить больше информации – вывод из запоя круглосуточно город екатеринбург
Публикация предлагает уникальную подборку информации, которая будет интересна как специалистам, так и широкому кругу читателей. Здесь вы найдете ответы на часто задаваемые вопросы и полезные инсайты для дальнейшего применения.
Посмотреть подробности – https://lrc-oberflaechenschutz.de/soundtrack-filma-lady-exclusive-music-2
Когда организм на пределе, важна срочная помощь в Екатеринбурге — это команда опытных наркологов, которые помогут быстро и мягко выйти из запоя без вреда для здоровья.
Ознакомиться с деталями – vyvod-iz-zapoya-ekaterinburg11.ru
В этом обзорном материале представлены увлекательные детали, которые находят отражение в различных аспектах жизни. Мы исследуем непонятные и интересные моменты, позволяя читателю увидеть картину целиком. Погрузитесь в мир знаний и удивительных открытий!
Все материалы собраны здесь – https://www.alnasertours.com/2022/02/15/events-for-nature-protect-4
Этот информативный текст отличается привлекательным содержанием и актуальными данными. Мы предлагаем читателям взглянуть на привычные вещи под новым углом, предоставляя интересный и доступный материал. Получите удовольствие от чтения и расширьте кругозор!
Секреты успеха внутри – https://f5fashion.vn/chi-tiet-51-ve-sinh-nhat-cua-eren-moi-nhat
Этот информативный текст выделяется своими захватывающими аспектами, которые делают сложные темы доступными и понятными. Мы стремимся предложить читателям глубину знаний вместе с разнообразием интересных фактов. Откройте новые горизонты и развивайте свои способности познавать мир!
Читать дальше – https://imindyourbusiness.nl/startup-goodlord-appoints-love-film
Эта публикация завернет вас в вихрь увлекательного контента, сбрасывая стереотипы и открывая двери к новым идеям. Каждый абзац станет для вас открытием, полным ярких примеров и впечатляющих достижений. Подготовьтесь быть вовлеченными и удивленными каждый раз, когда продолжите читать.
Продолжить изучение – https://puasbetbuktiwd3.xyz/index.php/bukti-wd-puasbet-17-nov-2023-sweet-bonanza-rp-2000000000-lunas
Публикация приглашает вас исследовать неизведанное — от древних тайн до современных достижений науки. Вы узнаете, как случайные находки превращались в революции, а смелые мысли — в новые эры человеческого прогресса.
Смотри, что ещё есть – https://radiovinil.ge/logo_1-1
Эта информационная заметка содержит увлекательные сведения, которые могут вас удивить! Мы собрали интересные факты, которые сделают вашу жизнь ярче и полнее. Узнайте нечто новое о привычных аспектах повседневности и откройте для себя удивительный мир информации.
Только для своих – https://f5fashion.vn/top-voi-hon-57-ve-ao-so-mi-bien
В этом информативном тексте представлены захватывающие события и факты, которые заставят вас задуматься. Мы обращаем внимание на важные моменты, которые часто остаются незамеченными, и предлагаем новые перспективы на привычные вещи. Подготовьтесь к тому, чтобы быть поглощенным увлекательными рассказами!
Ознакомиться с деталями – https://rudissecuriteprivee.fr/10-key-steps-to-launching-a-successful-startup
Этот информационный обзор станет отличным путеводителем по актуальным темам, объединяющим важные факты и мнения экспертов. Мы исследуем ключевые идеи и представляем их в доступной форме для более глубокого понимания. Читайте, чтобы оставаться в курсе событий!
Расширить кругозор по теме – https://www.od-bau-gmbh.de/blog_single_layout_overlay
Эта информационная статья содержит полезные факты, советы и рекомендации, которые помогут вам быть в курсе последних тенденций и изменений в выбранной области. Материал составлен так, чтобы быть полезным и понятным каждому.
Только факты! – https://forbesport.com/unveiling-the-auz100x-exploring-the-next-big-thing-in-audio-technology
Эта информационная статья содержит полезные факты, советы и рекомендации, которые помогут вам быть в курсе последних тенденций и изменений в выбранной области. Материал составлен так, чтобы быть полезным и понятным каждому.
Это стоит прочитать полностью – https://f5fashion.vn/chia-se-voi-hon-73-ve-hinh-nen-anh-one-piece-luffy-ngau-moi-nhat
Этот текст сочетает в себе элементы познавательного рассказа и аналитической подачи информации. Читатель получает доступ к уникальным данным, которые соединяют прошлое с настоящим и открывают двери в будущее.
Обратитесь за информацией – https://f5fashion.vn/who-is-darlene-duryea-john-lauro-wife-married-life-and-kids
Этот интересный отчет представляет собой сборник полезных фактов, касающихся актуальных тем. Мы проанализируем данные, чтобы вы могли сделать обоснованные выводы. Читайте, чтобы узнать больше о последних трендах и значимых событиях!
Это ещё не всё… – https://www.bassonwahwah.com/2021/04/30/bonjour-tout-le-monde
Эта публикация дает возможность задействовать различные источники информации и представить их в удобной форме. Читатели смогут быстро найти нужные данные и получить ответы на интересующие их вопросы. Мы стремимся к четкости и доступности материала для всех!
Смотрите также… – https://looknow.pl/baby-boy-capsule-lookbook-has-just-arrived-to-miini-2
Этот увлекательный информационный материал подарит вам массу новых знаний и ярких эмоций. Мы собрали для вас интересные факты и сведения, которые обогатят ваш опыт. Откройте для себя увлекательный мир информации и насладитесь процессом изучения!
Смотрите также – https://f5fashion.vn/a-look-into-the-criminal-journey
Публикация приглашает вас исследовать неизведанное — от древних тайн до современных достижений науки. Вы узнаете, как случайные находки превращались в революции, а смелые мысли — в новые эры человеческого прогресса.
Что ещё нужно знать? – http://uisyar.ru
Эта обзорная заметка содержит ключевые моменты и факты по актуальным вопросам. Она поможет читателям быстро ориентироваться в теме и узнать о самых важных аспектах сегодня. Получите краткий курс по современной информации и оставайтесь в курсе событий!
Ознакомиться с деталями – https://humano.com.co/2023/01/14/hello-world
В этой статье представлен занимательный и актуальный контент, который заставит вас задуматься. Мы обсуждаем насущные вопросы и проблемы, а также освещаем истории, которые вдохновляют на действия и изменения. Узнайте, что стоит за событиями нашего времени!
Изучить вопрос глубже – https://craftportvarna.bg/index.php/product/guakamole
В этом информативном тексте представлены захватывающие события и факты, которые заставят вас задуматься. Мы обращаем внимание на важные моменты, которые часто остаются незамеченными, и предлагаем новые перспективы на привычные вещи. Подготовьтесь к тому, чтобы быть поглощенным увлекательными рассказами!
Уточнить детали – https://topic.lk/6199
Чтобы обеспечить безопасный и поэтапный выход из запоя, важно обратиться к специалистам, которые определят оптимальный курс лечения, учитывая индивидуальное состояние пациента. Наркологическая клиника «Код здоровья» в Архангельске предлагает круглосуточную помощь, обеспечивая как лечение на дому, так и в стационаре для пациентов с тяжёлыми формами интоксикации.
Разобраться лучше – вывод из запоя капельница на дому
Состав инфузии подбирается врачом индивидуально, с учётом состояния пациента, длительности запоя, возраста и хронических заболеваний.
Углубиться в тему – вызвать капельницу от запоя красноярск
В этой информационной статье вы найдете интересное содержание, которое поможет вам расширить свои знания. Мы предлагаем увлекательный подход и уникальные взгляды на обсуждаемые темы, побуждая пользователей к активному мышлению и критическому анализу.
Ознакомиться с деталями – https://concernauto.ru
Применяются растворы на основе физраствора, глюкозы, витаминов группы B, противорвотных, седативных и гепатопротекторов. Используемые препараты входят в реестр разрешённых лекарств.
Получить дополнительные сведения – http://narcolog-na-dom-ekaterinburg55.ru
Мультидисциплинарная программа строится на взаимодействии нескольких специалистов — нарколога, психотерапевта, социального работника и, при необходимости, специалиста по физреабилитации. Такой формат позволяет:
Разобраться лучше – лечение наркомании наркология мариуполь
Клиника «РостовМед» предлагает профессиональную наркологическую помощь в Ростове и области в режиме 24/7. Наша команда готова выехать на дом к пациенту в любое время суток, обеспечивая анонимность и высокие медицинские стандарты. В основе работы — индивидуальный подход, современное оборудование и чётко отлаженные протоколы детоксикации, что позволяет безопасно вывести пациента из запоя и начать этап реабилитации без стресса госпитализации.
Выяснить больше – http://narkologicheskaya-klinika-rostov13.ru/psikhiatricheskaya-narkologicheskaya-klinika-v-rostove/https://narkologicheskaya-klinika-rostov13.ru
В клинике применяются комплексные программы, включающие медицинскую детоксикацию, психотерапевтическую поддержку и социальную реабилитацию. Медицинская детоксикация проводится с использованием современных препаратов и методик, что позволяет снизить тяжесть абстинентного синдрома и минимизировать риски для здоровья пациента. Подробнее о методах детоксикации можно узнать на официальном портале Министерства здравоохранения России.
Получить дополнительную информацию – http://narkologicheskaya-klinika-chelyabinsk13.ru/platnaya-narkologicheskaya-klinika-chelyabinsk/https://narkologicheskaya-klinika-chelyabinsk13.ru
Клиника специализируется на домашней детоксикации и стационарном лечении алкогольной зависимости. Основные направления работы:
Подробнее – https://vyvod-iz-zapoya-mariupol13.ru/vyvod-iz-zapoya-kapelnicza-mariupol/
Близкий человек в запое? Не ждите ухудшения. Обратитесь в клинику — здесь проведут профессиональный вывод из запоя с последующим восстановлением организма.
Узнать больше – http://vyvod-iz-zapoya-ekaterinburg.ru
В Екатеринбурге решение есть — наркологическая клиника. Здесь помогают людям выйти из запоя без страха и осуждения. Всё анонимно, грамотно и с заботой о каждом пациенте.
Подробнее тут – вывод из запоя капельница город екатеринбург
При обращении по телефону или через сайт диспетчер уточняет ФИО пациента, адрес, краткую историю запоя и наличие хронических заболеваний. Затем он передаёт информацию дежурному наркологу, который готовится к выезду.
Подробнее можно узнать тут – http://narkolog-na-dom-rostov-na-donu13.ru
Чтобы обеспечить безопасный и поэтапный выход из запоя, важно обратиться к специалистам, которые определят оптимальный курс лечения, учитывая индивидуальное состояние пациента. Наркологическая клиника «Код здоровья» в Архангельске предлагает круглосуточную помощь, обеспечивая как лечение на дому, так и в стационаре для пациентов с тяжёлыми формами интоксикации.
Ознакомиться с деталями – http://vyvod-iz-zapoya-arkhangelsk6.ru/vyvod-iz-zapoya-klinika-arkhangelsk/
Каждый пациент проходит предварительное обследование: экспресс-анализ крови на электролиты, биохимия печени и почек, ЭКГ. На основании результатов врач формирует персональную программу инфузионной терапии.
Подробнее – вызов на дом капельницы от запоя
Для устойчивого отказа от вредных привычек применяется кодирование — метод, основанный на психологическом воздействии, а также заместительная терапия, при которой пациент получает контролируемые дозы препаратов, снижающих ломку и тягу.
Ознакомиться с деталями – вывод наркологическая клиника
Детоксикация организма, проводимая на дому, помогает очистить кровь от токсинов, накопившихся из-за длительного употребления алкоголя или наркотических веществ. Она проводится с использованием специально подобранных медикаментов, которые улучшают работу печени, почек и других органов.
Получить дополнительные сведения – narkolog-na-dom-kruglosutochno krasnojarsk
Основные методы, используемые в клинике, включают медикаментозную детоксикацию, психотерапевтические программы и реабилитационные мероприятия. Медикаментозное выведение токсинов из организма проводится с применением сертифицированных препаратов под строгим контролем врачей. Подробности о методах медикаментозной детоксикации представлены на сайте Министерства здравоохранения РФ.
Выяснить больше – https://narkologicheskaya-klinika-rostov-na-donu13.ru/chastnaya-narkologicheskaya-klinika-v-rostove
Алкогольный делирий проявляется в виде галлюцинаций, бреда и агрессии. При отсутствии контроля такие пациенты опасны для себя и окружающих, требуя немедленной госпитализации.
Получить дополнительные сведения – https://vivod-iz-zapoya-chelyabinsk13.ru/srochnyj-vyvod-iz-zapoya-chelyabinsk/
Нарколог на дом в Волгограде — это специализированная медицинская услуга, направленная на оказание квалифицированной помощи пациентам с зависимостями в привычной домашней обстановке. Такая форма лечения позволяет снизить стресс, связанный с госпитализацией, и обеспечивает более комфортное проведение медицинских процедур. Вызов нарколога на дом пользуется высокой востребованностью как среди пациентов с алкоголизмом, так и среди людей, страдающих от наркотической зависимости, а также при острых состояниях, требующих неотложного вмешательства.
Разобраться лучше – выезд нарколога на дом в волгограде
Срочный вызов нарколога необходим, если:
Узнать больше – вызов нарколога на дом в иркутске
Одной из самых сильных сторон нашей клиники является оперативность. Мы понимаем, что при алкоголизме, наркомании и лекарственной зависимости часто требуются немедленные действия. Если человек находится в состоянии запоя, абстиненции или передозировки, промедление может привести к тяжёлым осложнениям или даже смерти.
Изучить вопрос глубже – http://narkologicheskaya-pomoshch-balashiha1.ru
Существуют определённые признаки, свидетельствующие о необходимости срочного обращения за профессиональной помощью:
Детальнее – https://vyvod-iz-zapoya-orekhovo-zuevo4.ru/anonimnyj-vyvod-iz-zapoya-v-orekhovo-zuevo
Нарколог рекомендует кодирование при наличии следующих признаков:
Узнать больше – https://kodirovanie-ot-alkogolizma-pushkino4.ru/kodirovanie-ot-alkogolizma-ceny-v-pushkino/
В Екатеринбурге решение есть — наркологическая клиника. Здесь помогают людям выйти из запоя без страха и осуждения. Всё анонимно, грамотно и с заботой о каждом пациенте.
Разобраться лучше – вывод из запоя анонимно город екатеринбург
Выездная бригада «РостовМед» оснащена всем необходимым для оказания экстренной помощи и проведения полного курса детоксикации на дому. Процесс состоит из нескольких этапов:
Подробнее можно узнать тут – частная наркологическая клиника в ростове-на-дону
Клиника «Феникс-Мед» предлагает два базовых формата лечения, позволяющих адаптировать помощь под состояние пациента и его предпочтения.
Получить больше информации – http://vyvod-iz-zapoya-reutov4.ru/anonimnyj-vyvod-iz-zapoya-v-reutove/
Услуга
Детальнее – https://narkolog-na-dom-ramenskoe4.ru/narkolog-na-dom-srochno-v-ramenskom
Близкий человек в запое? Не ждите ухудшения. Обратитесь в клинику — здесь проведут профессиональный вывод из запоя с последующим восстановлением организма.
Подробнее – нарколог вывод из запоя
Первый этап лечения заключается в безопасном выведении токсинов и стабилизации физического состояния. В клинике «АзовМед» применяется инфузионная терапия, направленная на компенсацию водно-электролитного баланса и ускоренное выведение продуктов распада наркотиков.
Детальнее – лечение наркомании клиника мариуполь
В Екатеринбурге решение есть — наркологическая клиника. Здесь помогают людям выйти из запоя без страха и осуждения. Всё анонимно, грамотно и с заботой о каждом пациенте.
Подробнее – наркология вывод из запоя город екатеринбург
Для срочных случаев клиника поддерживает круглосуточный режим приёма заявок. После оформления вызова диспетчер передаёт информацию бригаде, и в течение часа врач прибудет по указанному адресу.
Подробнее тут – https://vyvod-iz-zapoya-mariupol13.ru/vyvod-iz-zapoya-na-domu-mariupol
Чтобы обеспечить безопасный и поэтапный выход из запоя, важно обратиться к специалистам, которые определят оптимальный курс лечения, учитывая индивидуальное состояние пациента. Наркологическая клиника «Код здоровья» в Архангельске предлагает круглосуточную помощь, обеспечивая как лечение на дому, так и в стационаре для пациентов с тяжёлыми формами интоксикации.
Получить дополнительные сведения – вывод из запоя на дому цена архангельск
Когда организм на пределе, важна срочная помощь в Екатеринбурге — это команда опытных наркологов, которые помогут быстро и мягко выйти из запоя без вреда для здоровья.
Выяснить больше – vyvod-iz-zapoya-klinika ekaterinburg
Вид услуги
Разобраться лучше – http://narkologicheskaya-klinika-chelyabinsk13.ru
Услуга доступна как жителям Челябинска, так и пригородных районов области, благодаря наличию мобильных бригад и оптимизированным маршрутам выезда.
Исследовать вопрос подробнее – вызвать капельницу от запоя на дому в челябинске
Есть ситуации, когда дальнейшее промедление может привести к необратимым последствиям:
Разобраться лучше – https://lechenie-alkogolizma-korolev5.ru/lechenie-alkogolizma-v-stacionare-v-koroleve/
Современная наркологическая помощь в Ростове-на-Дону базируется на комплексном подходе, который объединяет медицинское лечение, психологическую поддержку и социальную реабилитацию. Такой подход доказал свою эффективность в многочисленных исследованиях, доступных на сайте Российского общества наркологов.
Получить больше информации – http://narkologicheskaya-klinika-rostov-na-donu13.ru
Для устойчивого отказа от вредных привычек применяется кодирование — метод, основанный на психологическом воздействии, а также заместительная терапия, при которой пациент получает контролируемые дозы препаратов, снижающих ломку и тягу.
Углубиться в тему – анонимная наркологическая клиника
В таких случаях медлить нельзя — своевременный вызов нарколога может спасти жизнь и предотвратить тяжёлую инвалидизацию.
Выяснить больше – vyvod iz zapoya kruglosutochno
Алкогольный делирий проявляется в виде галлюцинаций, бреда и агрессии. При отсутствии контроля такие пациенты опасны для себя и окружающих, требуя немедленной госпитализации.
Углубиться в тему – https://vivod-iz-zapoya-chelyabinsk13.ru/vyvod-iz-zapoya-czena-chelyabinsk
Эффект
Исследовать вопрос подробнее – http://kapelnica-ot-zapoya-krasnoyarsk6.ru
Нельзя игнорировать первые признаки серьёзного алкогольного отравления: промедление повышает риск судорожных припадков, остановки дыхания и комы. Нарколог на дом в Реутове рекомендован при следующих симптомах:
Подробнее – http://vyvod-iz-zapoya-reutov4.ru/vyvod-iz-zapoya-stacionar-v-reutove/https://vyvod-iz-zapoya-reutov4.ru
Нарколог на дом в Волгограде — это специализированная медицинская услуга, направленная на оказание квалифицированной помощи пациентам с зависимостями в привычной домашней обстановке. Такая форма лечения позволяет снизить стресс, связанный с госпитализацией, и обеспечивает более комфортное проведение медицинских процедур. Вызов нарколога на дом пользуется высокой востребованностью как среди пациентов с алкоголизмом, так и среди людей, страдающих от наркотической зависимости, а также при острых состояниях, требующих неотложного вмешательства.
Выяснить больше – психиатр нарколог на дом
Чтобы обеспечить безопасный и поэтапный выход из запоя, важно обратиться к специалистам, которые определят оптимальный курс лечения, учитывая индивидуальное состояние пациента. Наркологическая клиника «Код здоровья» в Архангельске предлагает круглосуточную помощь, обеспечивая как лечение на дому, так и в стационаре для пациентов с тяжёлыми формами интоксикации.
Исследовать вопрос подробнее – вывод из запоя на дому круглосуточно в архангельске
Национальный стандарт оказания наркологической помощи регламентирует состав препаратов, используемых при терапии, а также протоколы безопасности, которым следует выездной персонал.
Получить дополнительные сведения – https://narcolog-na-dom-ekaterinburg55.ru/narkolog-na-dom-kruglosutochno-v-ekaterinburge/
Самостоятельно выйти из запоя — почти невозможно. В Екатеринбурге врачи клиники проводят медикаментозный вывод из запоя с круглосуточным выездом. Доверяйте профессионалам.
Углубиться в тему – екатеринбург.
При обращении на горячую линию пациент может получить бесплатную телефонную консультацию. Врач уточняет состояние, собирает предварительный анамнез и согласовывает время визита.
Получить больше информации – наркологическая клиника
Нарколог прибывает в течение 30 минут, оснащённый переносным оборудованием: портативным электрокардиографом, спирометром, прибором для измерения сатурации, набором необходимых медикаментов и расходных материалов. На первом этапе проводится замер давления, пульса, температуры и сатурации, берётся капиллярная проба крови для экспресс-анализа глюкозы и электролитов.
Исследовать вопрос подробнее – нарколог капельница на дом
Своевременный вызов специалиста особенно важен при следующих признаках:
Детальнее – помощь вывод из запоя в мариуполе
Когда организм на пределе, важна срочная помощь в Екатеринбурге — это команда опытных наркологов, которые помогут быстро и мягко выйти из запоя без вреда для здоровья.
Ознакомиться с деталями – вывод из запоя капельница
Во время инфузий врач непрерывно отслеживает артериальное давление, частоту сердечных сокращений и диурез. Это позволяет моментально реагировать на любые изменения и корректировать терапию.
Изучить вопрос глубже – запой лечение наркомания
Наркологическая клиника в Челябинске предоставляет полный спектр медицинских услуг по диагностике, лечению и реабилитации пациентов с зависимостями различной этиологии. Современные методы терапии, применяемые в клинике, направлены на безопасное и эффективное избавление от наркотической и алкогольной зависимости, а также сопутствующих психических и соматических осложнений.
Углубиться в тему – наркологическая клиника нарколог челябинск
В таких случаях медлить нельзя — своевременный вызов нарколога может спасти жизнь и предотвратить тяжёлую инвалидизацию.
Детальнее – https://vyvod-iz-zapoya-orekhovo-zuevo4.ru/
Затяжной запой опасен для жизни. Врачи наркологической клиники в Екатеринбурге проводят срочный вывод из запоя — на дому или в стационаре. Анонимно, безопасно, круглосуточно.
Получить дополнительную информацию – вывод из запоя клиника в екатеринбурге
Наши специалисты регулярно проходят обучение и сертификацию по последним международным протоколам лечения алкогольной интоксикации. В арсенале «ЧелябДоктор» — передовое оборудование для инфузий, портативные насосы и тест-системы для контроля электролитов, глюкозы и функции печени прямо на дому.
Детальнее – капельница от запоя на дому
Чтобы обеспечить безопасный и поэтапный выход из запоя, важно обратиться к специалистам, которые определят оптимальный курс лечения, учитывая индивидуальное состояние пациента. Наркологическая клиника «Код здоровья» в Архангельске предлагает круглосуточную помощь, обеспечивая как лечение на дому, так и в стационаре для пациентов с тяжёлыми формами интоксикации.
Получить дополнительные сведения – вывод из запоя капельница в архангельске
Метод лечения
Получить больше информации – https://narkologicheskaya-klinika-rostov-na-donu13.ru/narkologicheskaya-klinika-narkologicheskij-czentr-v-rostove/
Клиника «Орион-Клиник» располагает собственной лабораторией и оснащением для аппаратных методик, что позволяет проводить все этапы лечения под одним крышей. Наши врачи имеют международные сертификаты по наркологии и гипнотерапии, а психологи прошли дополнительное обучение по работе с зависимостями. Мы гарантируем:
Разобраться лучше – https://kodirovanie-ot-alkogolizma-pushkino4.ru/kodirovanie-ot-alkogolizma-na-domu-v-pushkino/
Медикаментозная детоксикация позволяет быстро и безопасно очистить организм от токсинов и продуктов распада алкоголя или наркотиков, минимизируя риски осложнений. Используются препараты, которые восстанавливают работу печени, почек и других органов, а также нормализуют электролитный баланс.
Получить дополнительную информацию – наркологическая клиника стационар мариуполь
Своевременный выезд нарколога снижает риск осложнений и ускоряет вывод из запоя, а под контролем профессионала каждая процедура проходит максимально безопасно.
Исследовать вопрос подробнее – вывод из запоя цена
Круглосуточная служба «ЧелябМед» оперативно реагирует на экстренные случаи при следующих состояниях:
Углубиться в тему – https://vivod-iz-zapoya-chelyabinsk13.ru/vyvod-iz-zapoya-czena-chelyabinsk/
Этот формат позволяет пациентам получить профессиональную помощь в комфортной домашней обстановке. Такой подход не только обеспечивает удобство, но и гарантирует конфиденциальность, что особенно важно для многих людей.
Изучить вопрос глубже – врач нарколог на дом красноярск.
Если узнаёте подобные признаки у себя или у родственника — не ждите кризиса. Чем быстрее обратиться за профессиональной поддержкой, тем легче вернуть здоровье и гармонию в семью.
Получить дополнительную информацию – lechenie-alkogolizma-korolev5.ru/
Когда организм на пределе, важна срочная помощь в Екатеринбурге — это команда опытных наркологов, которые помогут быстро и мягко выйти из запоя без вреда для здоровья.
Исследовать вопрос подробнее – вывод из запоя свердловская область
Обращение за наркологической помощью на дому требуется в случаях, когда состояние пациента не позволяет ему самостоятельно посетить клинику или есть необходимость в анонимном лечении.
Получить дополнительную информацию – http://narcolog-na-dom-v-irkutske6.ru/
По вопросам оформления вызова можно ознакомиться с правилами на портале Федеральной службы по надзору в сфере здравоохранения, где опубликованы актуальные рекомендации и требования к медицинским организациям.
Изучить вопрос глубже – нарколог на дом круглосуточно
Когда организм на пределе, важна срочная помощь в Екатеринбурге — это команда опытных наркологов, которые помогут быстро и мягко выйти из запоя без вреда для здоровья.
Подробнее – вывод из запоя клиника город екатеринбург
Чтобы обеспечить безопасный и поэтапный выход из запоя, важно обратиться к специалистам, которые определят оптимальный курс лечения, учитывая индивидуальное состояние пациента. Наркологическая клиника «Код здоровья» в Архангельске предлагает круглосуточную помощь, обеспечивая как лечение на дому, так и в стационаре для пациентов с тяжёлыми формами интоксикации.
Разобраться лучше – https://vyvod-iz-zapoya-arkhangelsk6.ru/vyvod-iz-zapoya-klinika-arkhangelsk/
Мультидисциплинарная программа строится на взаимодействии нескольких специалистов — нарколога, психотерапевта, социального работника и, при необходимости, специалиста по физреабилитации. Такой формат позволяет:
Узнать больше – лечение наркомании анонимно мариуполь
Выездная бригада «РостовМед» оснащена всем необходимым для оказания экстренной помощи и проведения полного курса детоксикации на дому. Процесс состоит из нескольких этапов:
Выяснить больше – https://narkologicheskaya-klinika-rostov13.ru/psikhiatricheskaya-narkologicheskaya-klinika-v-rostove/
После обращения оператор клиники уточняет все детали — состояние пациента, стаж запоев, наличие хронических болезней, принимаемые лекарства, аллергии. Далее в течение 30–60 минут на дом выезжает мобильная бригада: врач-нарколог и медсестра со всем необходимым оборудованием и медикаментами.
Разобраться лучше – https://vyvod-iz-zapoya-orekhovo-zuevo4.ru/vyvod-iz-zapoya-stacionar-v-orekhovo-zuevo
Своевременный вызов специалиста особенно важен при следующих признаках:
Подробнее можно узнать тут – вывод из запоя вызов
Клиника оснащена современным оборудованием для мониторинга состояния пациентов и проведения процедур с максимальной безопасностью. Врачебный состав состоит из опытных наркологов, психиатров и психологов, регулярно повышающих квалификацию и применяющих доказательные методы лечения. На портале Российской медицинской ассоциации наркологов можно ознакомиться с рекомендациями по стандартам оказания наркологической помощи.
Получить дополнительную информацию – наркологическая клиника нарколог в челябинске
В течение процедуры пациент находится под непрерывным наблюдением: внутривенные капельницы с регидратационными растворами, витаминно-минеральными комплексами и гепатопротекторами обеспечивают восстановление функций печени, нормализацию обменных процессов и поддержку работы сердечно-сосудистой системы. При необходимости к лечению привлекаются узкопрофильные врачи — кардиолог, невролог или терапевт — что делает процесс максимально комплексным. По завершении выведения из запоя врач предоставляет подробный план поддерживающей терапии с рекомендациями по питанию, питьевому режиму и графику повторных консультаций.
Получить дополнительную информацию – https://vyvod-iz-zapoya-reutov4.ru/vyvod-iz-zapoya-stacionar-v-reutove
Каждый пациент проходит предварительное обследование: экспресс-анализ крови на электролиты, биохимия печени и почек, ЭКГ. На основании результатов врач формирует персональную программу инфузионной терапии.
Ознакомиться с деталями – капельница от запоя вызов
В Екатеринбурге решение есть — наркологическая клиника. Здесь помогают людям выйти из запоя без страха и осуждения. Всё анонимно, грамотно и с заботой о каждом пациенте.
Получить больше информации – вывод из запоя цена город екатеринбург
Наркологическая клиника в Ростове-на-Дону предоставляет полный спектр услуг по диагностике, лечению и реабилитации пациентов с алкогольной и наркотической зависимостью. Применение современных медицинских протоколов и индивидуальный подход к каждому пациенту обеспечивают высокую эффективность терапии и снижение риска рецидивов.
Детальнее – наркологическая клиника цены в ростове-на-дону
Нарколог прибывает в течение 30 минут, оснащённый переносным оборудованием: портативным электрокардиографом, спирометром, прибором для измерения сатурации, набором необходимых медикаментов и расходных материалов. На первом этапе проводится замер давления, пульса, температуры и сатурации, берётся капиллярная проба крови для экспресс-анализа глюкозы и электролитов.
Ознакомиться с деталями – вызвать врача нарколога на дом в ростове-на-дону
Медикаментозная детоксикация позволяет быстро и безопасно очистить организм от токсинов и продуктов распада алкоголя или наркотиков, минимизируя риски осложнений. Используются препараты, которые восстанавливают работу печени, почек и других органов, а также нормализуют электролитный баланс.
Изучить вопрос глубже – https://narkologicheskaya-klinika-mariupol13.ru/platnaya-narkologicheskaya-klinika-mariupol
В Екатеринбурге решение есть — наркологическая клиника. Здесь помогают людям выйти из запоя без страха и осуждения. Всё анонимно, грамотно и с заботой о каждом пациенте.
Получить дополнительные сведения – екатеринбург.
Далее, когда физическое состояние стабилизировано, совместно с врачом выбирается стратегия дальнейшего лечения. В «Новая Точка» доступны современные методы кодирования (уколы, таблетки, вшивание препаратов, гипнотерапия), но решение всегда принимается осознанно, с объяснением плюсов, рисков и индивидуальным подбором метода.
Подробнее – klinika-lechenie-alkogolizma-ceny
Первичный осмотр включает измерение давления, температуры, уровня глюкозы и сатурации, анализ неврологического статуса, оценку степени обезвоживания и интоксикации. Далее формируется индивидуальный план инфузионной терапии: капельницы с солевыми, глюкозными, витаминными, гепатопротекторными и седативными препаратами. При необходимости применяются современные противосудорожные и нейропротекторные средства, кислородная поддержка.
Подробнее тут – анонимный вывод из запоя
Мы предлагаем вам подробное руководство, основанное на проверенных источниках и реальных примерах. Каждая часть публикации направлена на то, чтобы помочь вам разобраться в сложных вопросах и применить знания на практике.
Переходите по ссылке ниже – https://furballkc.org/fb-logo
Кодирование от алкоголизма в Пушкино — это современная и надёжная методика лечения, заключающаяся в создании устойчивого барьера к употреблению спиртного. В наркологической клинике «Орион-Клиник» применяется сочетание медицинских и психотерапевтических технологий, благодаря чему пациент получает не только химическое, но и психологическое подкрепление трезвости. Процедура проводится после полной диагностики, с учётом индивидуальных особенностей, анамнеза и текущего состояния организма.
Детальнее – кодирование от алкоголизма выезд на дом
В этом информативном тексте представлены захватывающие события и факты, которые заставят вас задуматься. Мы обращаем внимание на важные моменты, которые часто остаются незамеченными, и предлагаем новые перспективы на привычные вещи. Подготовьтесь к тому, чтобы быть поглощенным увлекательными рассказами!
Секреты успеха внутри – https://pmi-bank.com/management-strategy/73
Эта информационная статья содержит полезные факты, советы и рекомендации, которые помогут вам быть в курсе последних тенденций и изменений в выбранной области. Материал составлен так, чтобы быть полезным и понятным каждому.
Выяснить больше – https://fotodroid.com/ahoj-vsichni
В этой публикации мы предлагаем подробные объяснения по актуальным вопросам, чтобы помочь читателям глубже понять их. Четкость и структурированность материала сделают его удобным для усвоения и применения в повседневной жизни.
Обратитесь за информацией – https://ctxvm.cn/about
Эта информационная заметка содержит увлекательные сведения, которые могут вас удивить! Мы собрали интересные факты, которые сделают вашу жизнь ярче и полнее. Узнайте нечто новое о привычных аспектах повседневности и откройте для себя удивительный мир информации.
Более подробно об этом – https://queenstshirtprinting.com/free-download-im-cold-247-svg
Этот текст сочетает в себе элементы познавательного рассказа и аналитической подачи информации. Читатель получает доступ к уникальным данным, которые соединяют прошлое с настоящим и открывают двери в будущее.
Почему это важно? – https://iiettafoundation.org/tuesday-tips-being-realistic-with-your-goals
Эта публикация дает возможность задействовать различные источники информации и представить их в удобной форме. Читатели смогут быстро найти нужные данные и получить ответы на интересующие их вопросы. Мы стремимся к четкости и доступности материала для всех!
Лучшее решение — прямо здесь – http://ceremony54.ru
Эта публикация завернет вас в вихрь увлекательного контента, сбрасывая стереотипы и открывая двери к новым идеям. Каждый абзац станет для вас открытием, полным ярких примеров и впечатляющих достижений. Подготовьтесь быть вовлеченными и удивленными каждый раз, когда продолжите читать.
Обратитесь за информацией – https://www.ankaramerdiven.com/hello-world
Эта информационная статья содержит полезные факты, советы и рекомендации, которые помогут вам быть в курсе последних тенденций и изменений в выбранной области. Материал составлен так, чтобы быть полезным и понятным каждому.
Только факты! – https://atos-stenotypie.com/street_w
Эта информационная заметка содержит увлекательные сведения, которые могут вас удивить! Мы собрали интересные факты, которые сделают вашу жизнь ярче и полнее. Узнайте нечто новое о привычных аспектах повседневности и откройте для себя удивительный мир информации.
Полная информация здесь – https://cinemovel.tv/sic/2020/per-questo-mi-chiamo-giovanni-4
Этот интересный отчет представляет собой сборник полезных фактов, касающихся актуальных тем. Мы проанализируем данные, чтобы вы могли сделать обоснованные выводы. Читайте, чтобы узнать больше о последних трендах и значимых событиях!
Почему это важно? – https://cinemovel.tv/sic/2020/per-questo-mi-chiamo-giovanni-4
Эта обзорная заметка содержит ключевые моменты и факты по актуальным вопросам. Она поможет читателям быстро ориентироваться в теме и узнать о самых важных аспектах сегодня. Получите краткий курс по современной информации и оставайтесь в курсе событий!
Нажми и узнай всё – https://borsettastivali.com/product/borsetta-stivali-classic-bag-black-with-black-interior
Эта публикация завернет вас в вихрь увлекательного контента, сбрасывая стереотипы и открывая двери к новым идеям. Каждый абзац станет для вас открытием, полным ярких примеров и впечатляющих достижений. Подготовьтесь быть вовлеченными и удивленными каждый раз, когда продолжите читать.
Детальнее – https://www.manabangarutelangana.in/people-will-make-all-sorts-of-comments-against-us-said-farokh-engineer
Этот информационный материал собраны данные, которые помогут лучше понять текущие тенденции и процессы в различных сферах жизни. Мы предоставляем четкий анализ, графики и примеры, чтобы информация была не только понятной, но и практичной для принятия решений.
Следуйте по ссылке – https://oboi-dlja-rabochego-stola.ru
В этой статье вы найдете познавательную и занимательную информацию, которая поможет вам лучше понять мир вокруг. Мы собрали интересные данные, которые вдохновляют на размышления и побуждают к действиям. Открывайте новую информацию и получайте удовольствие от чтения!
Переходите по ссылке ниже – http://www.brambillacarlocenter.com/news/prova-news
В этой статье вы найдете познавательную и занимательную информацию, которая поможет вам лучше понять мир вокруг. Мы собрали интересные данные, которые вдохновляют на размышления и побуждают к действиям. Открывайте новую информацию и получайте удовольствие от чтения!
Ознакомиться с полной информацией – https://kktcalimsatim.com/tag/curren
Эта обзорная заметка содержит ключевые моменты и факты по актуальным вопросам. Она поможет читателям быстро ориентироваться в теме и узнать о самых важных аспектах сегодня. Получите краткий курс по современной информации и оставайтесь в курсе событий!
Осуществить глубокий анализ – http://3wordpress.ru
Публикация предлагает уникальную подборку информации, которая будет интересна как специалистам, так и широкому кругу читателей. Здесь вы найдете ответы на часто задаваемые вопросы и полезные инсайты для дальнейшего применения.
Читать дальше – https://kktcalimsatim.com/tag/yamaha
Публикация приглашает вас исследовать неизведанное — от древних тайн до современных достижений науки. Вы узнаете, как случайные находки превращались в революции, а смелые мысли — в новые эры человеческого прогресса.
Осуществить глубокий анализ – https://2022nq.co.uk
В этой публикации мы предлагаем подробные объяснения по актуальным вопросам, чтобы помочь читателям глубже понять их. Четкость и структурированность материала сделают его удобным для усвоения и применения в повседневной жизни.
Подробнее тут – https://bloggenmeister.com/seo-tools-tipps-und-schreibwerkzeuge-fur-ihren-blog
Мы собрали для вас самые захватывающие факты из мира науки и истории. От малознакомых деталей до грандиозных событий — эта статья расширит ваш кругозор и подарит новое понимание того, как устроен наш мир.
Обратитесь за информацией – https://sports-network.ch/2015/05/12/the-10-biggest-mistakes-that-every-gym-members-makes
В этой статье представлен занимательный и актуальный контент, который заставит вас задуматься. Мы обсуждаем насущные вопросы и проблемы, а также освещаем истории, которые вдохновляют на действия и изменения. Узнайте, что стоит за событиями нашего времени!
Детальнее – https://www.yorkshirewillwriters.co.uk/uncategorised/hello-world
Предлагаем вашему вниманию интересную справочную статью, в которой собраны ключевые моменты и нюансы по актуальным вопросам. Эта информация будет полезна как для профессионалов, так и для тех, кто только начинает изучать тему. Узнайте ответы на важные вопросы и расширьте свои знания!
Более подробно об этом – https://munihuancabamba.gob.pe/transparencia/buenas-practicas/comunicados/item/732-comunicate-con-defensa-civil?start=1170
Мы предлагаем вам подробное руководство, основанное на проверенных источниках и реальных примерах. Каждая часть публикации направлена на то, чтобы помочь вам разобраться в сложных вопросах и применить знания на практике.
Читать дальше – https://kitpeledeouro.com/ola-mundo
Не стоит медлить с вызовом врача-нарколога, если у человека проявляются тревожные признаки ухудшения состояния. Среди наиболее серьезных симптомов, требующих немедленного вмешательства врача, можно выделить продолжительный запой (более двух дней подряд), частую рвоту, невыносимую головную боль, выраженный тремор рук и тела, повышение артериального давления, нарушение ритма сердца, а также психические нарушения, включая тревогу, галлюцинации и бессонницу. Чем раньше пациент обратится за профессиональной помощью, тем выше шансы избежать серьезных осложнений и быстро вернуться к нормальной жизни.
Подробнее можно узнать тут – vyvod-iz-zapoya-klinika novosibirsk
Эта информационная заметка содержит увлекательные сведения, которые могут вас удивить! Мы собрали интересные факты, которые сделают вашу жизнь ярче и полнее. Узнайте нечто новое о привычных аспектах повседневности и откройте для себя удивительный мир информации.
Все материалы собраны здесь – https://assignmentnepal.com/mc4064ni-principles-of-marketing-islington-college-coursework-type-individual-essay-1500-words
Запой может быть не только физически тяжёлым, но и психологически разрушительным. Поэтому важно вовремя обратиться за помощью. Вывод из запоя в Нижнем Новгороде — это необходимая медицинская процедура, которая помогает победить алкогольную зависимость и восстановить здоровье. Мы в клинике «АнтиЗависимость» предлагаем круглосуточную помощь в комфортных условиях — на дому или в стационаре.
Разобраться лучше – выезд нарколога на дом новокузнецк
Запой – это состояние, когда организм требует постоянного поступления алкоголя для нормальной работы. Запой вызывает накопление вредных веществ, что негативно влияет на органы и иммунную систему. Не пытайтесь самостоятельно избавиться от запоя, это может навредить. Получите квалифицированную помощь на дому от клиники «Семья и Здоровье». Мы быстро приедем и окажем круглосуточную поддержку при запое. Длительное употребление алкоголя опасно для здоровья и жизни. Не ждите, пока станет слишком поздно, обратитесь за помощью при запое!
Получить дополнительные сведения – вывод из запоя на дому красноярск цены
В этих случаях вызов нарколога на дом не только оправдан, но и жизненно необходим для предотвращения опасных осложнений и стабилизации здоровья пациента.
Узнать больше – нарколог на дом круглосуточно воронеж
Близкий человек в запое? Не ждите ухудшения. Обратитесь в клинику — здесь проведут профессиональный вывод из запоя с последующим восстановлением организма.
Получить дополнительные сведения – вывод из запоя на дому круглосуточно
После обращения пациента в клинику «НаркоЩит» наш специалист выезжает на дом в течение 30–60 минут. По прибытии врач проводит подробный осмотр: измеряет артериальное давление, пульс и уровень кислорода в крови, а также собирает анамнез, чтобы оценить степень интоксикации и тяжесть запоя. На основе полученной информации формируется индивидуальный план лечения.
Детальнее – https://kapelnica-ot-zapoya-nizhniy-novgorod00.ru/kapelnicza-ot-zapoya-czena-nizhnij-novgorod/
Стоимость услуг по установке капельницы определяется индивидуально и зависит от нескольких факторов. В первую очередь, цена обусловлена тяжестью состояния пациента: при более сильной интоксикации и выраженных симптомах абстинентного синдрома может потребоваться расширенная терапия. Кроме того, итоговая сумма зависит от продолжительности запоя, так как длительное употребление спиртного ведет к более серьезному накоплению токсинов, требующему дополнительных лечебных мероприятий.
Подробнее тут – https://kapelnica-ot-zapoya-nizhniy-novgorod000.ru/kapelnicza-ot-zapoya-czena-nizhnij-novgorod
Алкогольная и наркотическая зависимость требуют незамедлительного и комплексного вмешательства для предотвращения серьезных осложнений и сохранения здоровья пациента. В Уфе, Республика Башкортостан, опытные наркологи выезжают на дом 24 часа в сутки, предоставляя оперативную помощь при запоях и в случаях наркотической интоксикации. Такой формат лечения позволяет начать детоксикацию в комфортной, привычной обстановке, обеспечивая максимальную конфиденциальность и индивидуальный подход к каждому пациенту.
Разобраться лучше – https://narcolog-na-dom-ufa000.ru/narkolog-na-dom-ufa-czeny/
Именно поэтому так важно не терять время. Чем раньше пациент получает помощь, тем выше шансы избежать необратимых последствий и вернуться к нормальной жизни.
Детальнее – снятие ломки наркомана в подольске
Каждый день запоя увеличивает риск для жизни. Не рискуйте — специалисты в Екатеринбурге приедут на дом и окажут экстренную помощь. Без боли, стресса и ожидания.
Изучить вопрос глубже – ekaterinburg
Современные методы лечения при выводе из запоя включают как медикаментозную детоксикацию, так и психологическую реабилитацию. В Уфе наркологи используют капельничное введение лекарственных средств, которые помогают быстро вывести токсины, нормализовать обмен веществ и стабилизировать работу внутренних органов. Одновременно с этим проводится психологическая поддержка для снижения эмоционального стресса, связанного с запоем.
Углубиться в тему – нарколог на дом уфа
После вашего звонка нарколог выезжает на дом в течение 30–60 минут. Прибыв на место, специалист проводит всесторонний медицинский осмотр, включая измерение артериального давления, пульса и уровня кислорода в крови, а также собирает анамнез для определения степени интоксикации.
Получить дополнительную информацию – http://narcolog-na-dom-voronezh0.ru/vyzov-narkologa-na-dom-voronezh/
Сразу после вызова нарколог приезжает на дом для проведения первичного осмотра и диагностики. На этом этапе проводится сбор анамнеза, измеряются жизненно важные показатели (пульс, артериальное давление, температура) и определяется степень алкогольной интоксикации. Эти данные являются основой для разработки индивидуального плана лечения.
Детальнее – капельницы от запоятюмень
Специалист выясняет продолжительность запоя, характер симптомов и наличие сопутствующих заболеваний. Полученные данные являются основой для составления индивидуальной программы терапии и выбора оптимальных медикаментов.
Изучить вопрос глубже – https://narcolog-na-dom-ufa00.ru/narkolog-na-dom-kruglosutochno-ufa
Наши врачи используют только проверенные и сертифицированные медикаменты, индивидуально подбираемые для каждого пациента. В состав лечебного курса входят:
Исследовать вопрос подробнее – vyvod-iz-zapoya-kruglosutochno novosibirsk
На основании проведенных обследований врач разрабатывает индивидуальную терапевтическую схему. Основной этап — детоксикация организма при помощи внутривенных инфузий. В капельницу включают растворы для восстановления водно-солевого баланса, выведения токсинов и улучшения работы внутренних органов. Также по показаниям назначают препараты для поддержки работы печени и сердца, стабилизации психоэмоционального состояния и снятия симптомов абстиненции. На протяжении процедуры врач ведет постоянный контроль за состоянием пациента, корректируя лечение при необходимости.
Разобраться лучше – http://vyvod-iz-zapoya-novosibirsk0.ru
Лечение начинается с обязательной консультации врача-нарколога. На этом этапе специалист подробно выясняет особенности употребления, продолжительность зависимости, наличие хронических и сопутствующих заболеваний, а также психоэмоциональное состояние пациента. Диагностика позволяет выбрать максимально эффективную и безопасную методику кодирования.
Углубиться в тему – http://kodirovanie-ot-alkogolizma-mytishchi5.ru
Почему пациенты выбирают именно нас:
Подробнее можно узнать тут – http://narkologicheskaya-pomoshch-lyubercy5.ru
Нужна срочная помощь при алкогольном отравлении или запое? Вызовите нарколога на дом в Иркутске! Квалифицированная помощь нарколога на дому: диагностика, капельница, стабилизация состояния. Круглосуточный выезд нарколога, анонимность и снижение рисков – с «ТрезвоМед». Самостоятельный отказ невозможен? Необходима наркологическая помощь. Васильев: «Не затягивайте с помощью при алкогольном отравлении!».
Разобраться лучше – narcolog-na-dom-v-irkutske0.ru/
В подобных случаях вывод из запоя в домашних условиях без врачебного контроля крайне опасен и может привести к тяжёлым последствиям. Лучше сразу вызвать нарколога или привезти пациента в клинику — это поможет избежать критических осложнений.
Углубиться в тему – srochnyj-vyvod-iz-zapoya
Алкогольная и наркотическая зависимость оказывают разрушительное воздействие на организм, нарушая работу сердечно-сосудистой системы, печени, почек и головного мозга. Запои и передозировки приводят к острой интоксикации, которая без медицинской помощи может перерасти в поражение внутренних органов, психоз или даже летальный исход.
Разобраться лучше – нарколог на дом цена новокузнецк
Врачи клиники «ВитаЛайн» для снятия интоксикации и облегчения состояния пациента применяют исключительно качественные и проверенные лекарственные препараты, подбирая их в зависимости от особенностей ситуации и состояния здоровья пациента:
Получить больше информации – http://narcolog-na-dom-novosibirsk0.ru
Самостоятельно выйти из запоя — почти невозможно. В Екатеринбурге врачи клиники проводят медикаментозный вывод из запоя с круглосуточным выездом. Доверяйте профессионалам.
Изучить вопрос глубже – http://vyvod-iz-zapoya-ekaterinburg15.ru
Каждый день запоя увеличивает риск для жизни. Не рискуйте — специалисты в Екатеринбурге приедут на дом и окажут экстренную помощь. Без боли, стресса и ожидания.
Детальнее – вывод из запоя на дому цена
Сигналы, указывающие на потребность в наркологической помощи, часто игнорируются либо недооцениваются. Очень важно не пропустить тревожные симптомы, такие как:
Получить дополнительные сведения – anonimnaya-narkologicheskaya-klinika
Самостоятельно выйти из запоя — почти невозможно. В Екатеринбурге врачи клиники проводят медикаментозный вывод из запоя с круглосуточным выездом. Доверяйте профессионалам.
Исследовать вопрос подробнее – вывод из запоя недорого в екатеринбурге
Группа препаратов
Изучить вопрос глубже – вызвать капельницу от запоя на дому в нижний новгороде
По окончании курса детоксикации нарколог дает пациенту и его близким подробные рекомендации, помогающие быстрее восстановить здоровье и предотвратить повторные случаи запоев.
Получить больше информации – вывод из запоя в новосибирске
Современные методы лечения при выводе из запоя включают как медикаментозную детоксикацию, так и психологическую реабилитацию. В Уфе наркологи используют капельничное введение лекарственных средств, которые помогают быстро вывести токсины, нормализовать обмен веществ и стабилизировать работу внутренних органов. Одновременно с этим проводится психологическая поддержка для снижения эмоционального стресса, связанного с запоем.
Разобраться лучше – narkolog na dom ufa
Основная терапия заключается в установке внутривенной капельницы, через которую вводятся специально подобранные растворы. Эти препараты помогают быстро вывести токсины, восстановить водно-электролитный баланс и нормализовать работу внутренних органов. При необходимости врач может дополнительно назначить медикаменты для поддержки печени, стабилизации сердечной деятельности и купирования симптомов абстинентного синдрома. По завершении процедуры специалист предоставляет рекомендации по дальнейшему восстановлению и профилактике повторных эпизодов зависимости.
Разобраться лучше – kapelnicza-ot-zapoya-czena nizhnij novgorod
Близкий человек в запое? Не ждите ухудшения. Обратитесь в клинику — здесь проведут профессиональный вывод из запоя с последующим восстановлением организма.
Разобраться лучше – наркологический вывод из запоя
Алкогольная и наркотическая зависимости могут привести к тяжелым и опасным для жизни состояниям. Вызов нарколога становится необходимым, если:
Разобраться лучше – нарколог на дом вывод воронеж
Алкогольная и наркотическая зависимость требуют незамедлительного и комплексного вмешательства для предотвращения серьезных осложнений и сохранения здоровья пациента. В Уфе, Республика Башкортостан, опытные наркологи выезжают на дом 24 часа в сутки, предоставляя оперативную помощь при запоях и в случаях наркотической интоксикации. Такой формат лечения позволяет начать детоксикацию в комфортной, привычной обстановке, обеспечивая максимальную конфиденциальность и индивидуальный подход к каждому пациенту.
Получить дополнительные сведения – https://narcolog-na-dom-ufa000.ru/narkolog-na-dom-ufa-czeny/
В некоторых случаях медлить нельзя ни минуты. Запойное состояние чревато обезвоживанием, судорогами, инфарктом, психозом. Если у пациента наблюдаются выраженные физические и психические нарушения, самостоятельное «пережидание» может закончиться тяжёлыми осложнениями.Поводом немедленно обратиться к специалистам становится:
Подробнее – vyvod-iz-zapoya
Далее назначается инфузионная терапия (капельницы) — специально подобранные растворы и препараты для безопасного выведения токсинов, коррекции водно-солевого баланса, поддержки сердца, нервной системы и печени, нормализации сна и снятия тревожности. Капельница длится от 2 до 4 часов, врач наблюдает за состоянием пациента и, при необходимости, корректирует дозировки, вводит дополнительные средства для купирования судорог, снятия боли, коррекции психоэмоционального состояния.
Узнать больше – http://vyvod-iz-zapoya-himki5.ru
Процесс вывода из запоя капельничным методом организован по строгой схеме, позволяющей обеспечить максимальную эффективность терапии. Каждая стадия направлена на комплексное восстановление организма и минимизацию риска осложнений.
Ознакомиться с деталями – http://kapelnica-ot-zapoya-tyumen0.ru
При длительном запое токсические вещества накапливаются в организме, нарушая работу сердца, печени, почек и других жизненно важных систем. Своевременное вмешательство помогает предотвратить необратимые повреждения и снизить риск развития хронических заболеваний. В Уфе вызов нарколога на дом позволяет начать лечение в самые критические моменты, когда каждая минута имеет решающее значение для сохранения здоровья и жизни пациента.
Исследовать вопрос подробнее – http://
После поступления звонка нарколог оперативно выезжает по указанному адресу и прибывает в течение 30–60 минут. Врач незамедлительно приступает к оказанию помощи по четко отработанному алгоритму, состоящему из следующих этапов:
Выяснить больше – нарколог на дом недорого воронеж
Запой — это не просто временная слабость, а критическое состояние, требующее экстренного медицинского вмешательства. Особенно опасно откладывать обращение за помощью, если у человека наблюдаются такие симптомы:
Углубиться в тему – вывод из запоя на дому круглосуточно
Действие и назначение
Подробнее – срочный вывод из запоя
На основании проведенных обследований врач разрабатывает индивидуальную терапевтическую схему. Основной этап — детоксикация организма при помощи внутривенных инфузий. В капельницу включают растворы для восстановления водно-солевого баланса, выведения токсинов и улучшения работы внутренних органов. Также по показаниям назначают препараты для поддержки работы печени и сердца, стабилизации психоэмоционального состояния и снятия симптомов абстиненции. На протяжении процедуры врач ведет постоянный контроль за состоянием пациента, корректируя лечение при необходимости.
Узнать больше – вывод из запоя недорого новосибирск
Самостоятельно выйти из запоя — почти невозможно. В Екатеринбурге врачи клиники проводят медикаментозный вывод из запоя с круглосуточным выездом. Доверяйте профессионалам.
Получить больше информации – свердловская область
После звонка специалист клиники «ВитаЛайн» оперативно отправляется по указанному адресу и обычно прибывает в течение 30–60 минут. На месте врач сразу проводит детальную диагностику, оценивая состояние пациента: проверяет пульс, давление, сатурацию, степень интоксикации и наличие хронических болезней. На основании результатов осмотра нарколог разрабатывает индивидуальную схему терапии.
Исследовать вопрос подробнее – запой нарколог на дом
Услуга вызова нарколога на дом в Уфе разработана для оперативного вывода из запоя без необходимости госпитализации. Это особенно актуально для тех, кто столкнулся с алкогольной интоксикацией в условиях, когда каждая минута имеет значение. Своевременная помощь позволяет не только устранить негативное воздействие алкоголя на организм, но и предотвратить возможные осложнения, такие как нарушения работы сердца, печени и почек.
Выяснить больше – врач нарколог на дом платный в уфе
Услуга
Разобраться лучше – капельница от запоя на дому цена в нижний новгороде
Самостоятельно выйти из запоя — почти невозможно. В Екатеринбурге врачи клиники проводят медикаментозный вывод из запоя с круглосуточным выездом. Доверяйте профессионалам.
Изучить вопрос глубже – вывод из запоя круглосуточно город екатеринбург
Клиника «НаркологикПлюс» предоставляет квалифицированную помощь нарколога на дому в Воронеже. Если вы или ваши близкие столкнулись с последствиями длительного употребления алкоголя или наркотиков, наши специалисты готовы оперативно выехать и оказать экстренную помощь. Мы проводим детоксикацию организма, снимаем симптомы абстинентного синдрома и стабилизируем состояние пациента, обеспечивая высокий уровень безопасности, строгую анонимность и индивидуальный подход.
Выяснить больше – vyzvat-narkologa-na-dom voronezh
Запой – тяжелое состояние, когда организм не может функционировать без алкоголя. Токсины накапливаются, органы перестают работать, иммунитет слабеет. Это очень опасно. Самостоятельные попытки выйти из запоя только ухудшают ситуацию и усиливают страдания. Клиника «Семья и Здоровье» предлагает лечение на дому, без стресса и в комфортной обстановке. Мы работаем круглосуточно, быстро приезжаем и проводим все необходимые процедуры. Длительный запой разрушает организм, ухудшает качество жизни и может привести к опасным ситуациям. Своевременный вывод из запоя — это критически важно для сохранения здоровья и жизни.
Узнать больше – нарколог вывод из запоя красноярск
Алкогольная и наркотическая зависимость требуют незамедлительного и комплексного вмешательства для предотвращения серьезных осложнений и сохранения здоровья пациента. В Уфе, Республика Башкортостан, опытные наркологи выезжают на дом 24 часа в сутки, предоставляя оперативную помощь при запоях и в случаях наркотической интоксикации. Такой формат лечения позволяет начать детоксикацию в комфортной, привычной обстановке, обеспечивая максимальную конфиденциальность и индивидуальный подход к каждому пациенту.
Выяснить больше – https://narcolog-na-dom-ufa000.ru/
Запой может быть не только физически тяжёлым, но и психологически разрушительным. Поэтому важно вовремя обратиться за помощью. Вывод из запоя в Нижнем Новгороде — это необходимая медицинская процедура, которая помогает победить алкогольную зависимость и восстановить здоровье. Мы в клинике «АнтиЗависимость» предлагаем круглосуточную помощь в комфортных условиях — на дому или в стационаре.
Получить дополнительные сведения – vrach-narkolog-na-dom novokuznetsk
Есть ряд признаков и ситуаций, когда откладывать обращение к наркологу опасно:
Детальнее – skoraya-narkologicheskaya-pomoshch-lyubercy
Запой – это угрожающее здоровью состояние, при котором человек утрачивает контроль над употреблением алкоголя, что приводит к накоплению токсинов в организме и может вызвать серьезные осложнения. В Уфе, столице Республики Башкортостан, опытные наркологи предоставляют услугу вызова на дом, позволяющую оперативно начать детоксикацию и стабилизировать состояние пациента в комфортной, знакомой обстановке. Такой подход обеспечивает не только быстрый вывод из запоя, но и комплексную терапию, включающую медикаментозное лечение и психологическую поддержку.
Разобраться лучше – http://narcolog-na-dom-ufa00.ru/narkolog-na-dom-czena-ufa/
Процесс вывода из запоя капельничным методом организован по строгой схеме, позволяющей обеспечить максимальную эффективность терапии. Каждая стадия направлена на комплексное восстановление организма и минимизацию риска осложнений.
Ознакомиться с деталями – капельница от запоя тюмень
В зависимости от тяжести состояния подбирается индивидуальная программа детоксикации. В неё входят: — Инфузионная терапия (капельницы) для очищения организма от токсинов; — Поддерживающие препараты для работы сердца, печени, нервной системы; — Симптоматическое лечение (устранение рвоты, судорог, бессонницы); — Витамины и средства для восстановления водно-солевого баланса.
Углубиться в тему – narkologicheskaya-klinika-podolsk
Кодирование — это не просто медицинская манипуляция, а серьёзный шаг к восстановлению контроля над собственной жизнью и формированию устойчивой ремиссии.
Узнать больше – http://www.domen.ru
Многодневные алкогольные запои опасны не только для здоровья, но и для жизни. В этот период организм подвергается тяжелейшей интоксикации, страдают сердце, печень, нервная система, а психоэмоциональное состояние может выйти из-под контроля. Самостоятельно выйти из запоя очень трудно и опасно: любое промедление или попытка “перетерпеть” чреваты судорогами, галлюцинациями, инфарктом, тяжелой депрессией или делирием. Именно поэтому своевременное обращение к профессионалам — залог не только скорого, но и безопасного восстановления. В наркологической клинике «НаркоМедцентр» в Балашихе организован современный и медицински обоснованный вывод из запоя: здесь пациентов ждет индивидуальный подход, круглосуточное медицинское наблюдение и полная конфиденциальность.
Подробнее – вывод из запоя недорого
После поступления звонка специалисты нашей клиники оперативно выезжают по адресу пациента в Новосибирске. Врач начинает работу с детальной диагностики: измеряет пульс, артериальное давление, сатурацию (уровень кислорода в крови), оценивает состояние нервной и сердечно-сосудистой систем, уточняет наличие хронических заболеваний, аллергических реакций, длительность и тяжесть запоя.
Получить больше информации – http://vyvod-iz-zapoya-novosibirsk0.ru
Когда организм на пределе, важна срочная помощь в Екатеринбурге — это команда опытных наркологов, которые помогут быстро и мягко выйти из запоя без вреда для здоровья.
Узнать больше – екатеринбург.
Каждый день запоя увеличивает риск для жизни. Не рискуйте — специалисты в Екатеринбурге приедут на дом и окажут экстренную помощь. Без боли, стресса и ожидания.
Получить больше информации – вывод из запоя на дому
Услуга вызова нарколога на дом в Уфе разработана для оперативного вывода из запоя без необходимости госпитализации. Это особенно актуально для тех, кто столкнулся с алкогольной интоксикацией в условиях, когда каждая минута имеет значение. Своевременная помощь позволяет не только устранить негативное воздействие алкоголя на организм, но и предотвратить возможные осложнения, такие как нарушения работы сердца, печени и почек.
Углубиться в тему – http://narcolog-na-dom-ufa0.ru/narkolog-na-dom-ufa-czeny/
Группа препаратов
Получить дополнительные сведения – vyvod-iz-zapoya-klinika novosibirsk
Экстренный вызов нарколога на дом в Иркутске от «ТрезвоМед» при запое, интоксикации или кодировании – анонимно и удобно. Осмотр, детоксикация капельницей, индивидуальный план лечения – все это на дому! «ТрезвоМед» – круглосуточная помощь, анонимность и безопасность при отказе от алкоголя. Не можете бросить пить самостоятельно? Нужна помощь нарколога! Васильев: «Своевременная помощь при интоксикации – залог успешного выздоровления».
Углубиться в тему – вызов нарколога на дом цена в иркутске
Алкогольная зависимость – заболевание, при котором страдает не только тело, но и психика человека. При длительных запоях нарушается работа сердца, печени, почек, появляются острые психоэмоциональные расстройства: тревожность, страхи, агрессия, проблемы со сном. В стадии абстиненции часто отмечается учащённый пульс, скачки давления, дрожь в руках, галлюцинации. Это крайне опасное состояние, требующее профессионального вмешательства нарколога. Клиника «Решение+» в Ногинске предлагает квалифицированный вывод из запоя на дому и в стационаре — с индивидуальным подходом, круглосуточной поддержкой и полным соблюдением анонимности.
Исследовать вопрос подробнее – http://vyvod-iz-zapoya-noginsk5.ru
Основная терапия заключается в установке внутривенной капельницы, через которую вводятся специально подобранные растворы. Эти препараты помогают быстро вывести токсины, восстановить водно-электролитный баланс и нормализовать работу внутренних органов. При необходимости врач может дополнительно назначить медикаменты для поддержки печени, стабилизации сердечной деятельности и купирования симптомов абстинентного синдрома. По завершении процедуры специалист предоставляет рекомендации по дальнейшему восстановлению и профилактике повторных эпизодов зависимости.
Подробнее тут – https://kapelnica-ot-zapoya-nizhniy-novgorod000.ru/kapelnicza-ot-zapoya-na-domu-nizhnij-novgorod
После поступления звонка нарколог оперативно выезжает по указанному адресу и прибывает в течение 30–60 минут. Врач незамедлительно приступает к оказанию помощи по четко отработанному алгоритму, состоящему из следующих этапов:
Разобраться лучше – http://narcolog-na-dom-voronezh00.ru/narkolog-na-dom-anonimno-voronezh/
В таких случаях своевременное обращение за помощью позволяет быстро стабилизировать состояние и предотвратить развитие серьезных осложнений.
Получить дополнительную информацию – вызов нарколога на дом в воронеже
После обращения по телефону или через сайт оператор уточняет адрес, состояние пациента и срочность выезда. Врач прибывает в течение 1–2 часов, а в экстренных случаях — в течение часа. На месте специалист проводит первичный осмотр: измеряет давление, пульс, сатурацию, температуру, уточняет длительность запоя, сопутствующие заболевания, особенности реакции на лекарства.
Узнать больше – https://vyvod-iz-zapoya-himki5.ru/
При остром алкогольном отравлении появляются головокружение, рвота, сильная слабость, скачки давления, нарушение дыхания, обмороки и судороги. Это сигнал о том, что организм не справляется с интоксикацией, и без срочного медицинского вмешательства возможны опасные осложнения, вплоть до комы.
Получить дополнительную информацию – narcolog-na-dom-novokuznetsk00.ru/
Пациенты, которые обращаются в нашу клинику, получают целый комплекс преимуществ, благодаря которым лечение проходит максимально эффективно и комфортно:
Подробнее можно узнать тут – нарколог на дом новосибирская область
При длительном запое токсические вещества накапливаются в организме, нарушая работу сердца, печени, почек и других жизненно важных систем. Своевременное вмешательство помогает предотвратить необратимые повреждения и снизить риск развития хронических заболеваний. В Уфе вызов нарколога на дом позволяет начать лечение в самые критические моменты, когда каждая минута имеет решающее значение для сохранения здоровья и жизни пациента.
Узнать больше – narcolog-na-dom-ufa00.ru/
Близкий человек в запое? Не ждите ухудшения. Обратитесь в клинику — здесь проведут профессиональный вывод из запоя с последующим восстановлением организма.
Исследовать вопрос подробнее – вывод из запоя капельница в екатеринбурге
Комплексная терапия при выводе из запоя на дому включает в себя два основных направления: медикаментозную детоксикацию и психологическую поддержку. Такой подход позволяет добиться быстрого и устойчивого эффекта, минимизируя риск осложнений и обеспечивая долгосрочную ремиссию.
Разобраться лучше – нарколог на дом в уфе
По окончании курса детоксикации нарколог дает пациенту и его близким подробные рекомендации, помогающие быстрее восстановить здоровье и предотвратить повторные случаи запоев.
Разобраться лучше – вывод из запоя клиника в новосибирске
Сразу после вызова нарколог приезжает на дом для проведения первичного осмотра и диагностики. На этом этапе проводится сбор анамнеза, измеряются жизненно важные показатели (пульс, артериальное давление, температура) и определяется степень алкогольной интоксикации. Эти данные являются основой для разработки индивидуального плана лечения.
Разобраться лучше – https://kapelnica-ot-zapoya-tyumen0.ru/kapelnicza-ot-zapoya-na-domu-tyumen
Запой — это не просто временная слабость, а критическое состояние, требующее экстренного медицинского вмешательства. Особенно опасно откладывать обращение за помощью, если у человека наблюдаются такие симптомы:
Подробнее – https://vyvod-iz-zapoya-balashiha5.ru/anonimnyj-vyvod-iz-zapoya-v-balashihe
Затяжной запой опасен для жизни. Врачи наркологической клиники в Екатеринбурге проводят срочный вывод из запоя — на дому или в стационаре. Анонимно, безопасно, круглосуточно.
Разобраться лучше – вывод из запоя на дому круглосуточно
Сигналы, указывающие на потребность в наркологической помощи, часто игнорируются либо недооцениваются. Очень важно не пропустить тревожные симптомы, такие как:
Изучить вопрос глубже – narkologicheskaya-klinika-na-dom
Этот текст сочетает в себе элементы познавательного рассказа и аналитической подачи информации. Читатель получает доступ к уникальным данным, которые соединяют прошлое с настоящим и открывают двери в будущее.
Изучить аспект более тщательно – https://carlavegaseminario.com/como-saber-si-tienes-creencias-limitantes
Эта обзорная заметка содержит ключевые моменты и факты по актуальным вопросам. Она поможет читателям быстро ориентироваться в теме и узнать о самых важных аспектах сегодня. Получите краткий курс по современной информации и оставайтесь в курсе событий!
Заходи — там интересно – https://odontologiaeoc.cl/ortodonciainvisible
Эта статья предлагает живое освещение актуальной темы с множеством интересных фактов. Мы рассмотрим ключевые моменты, которые делают данную тему важной и актуальной. Подготовьтесь к насыщенному путешествию по неизвестным аспектам и узнайте больше о значимых событиях.
Детальнее – https://autoelektronik.rs/home/pattern
Услуга вызова нарколога на дом в Уфе разработана для оперативного вывода из запоя без необходимости госпитализации. Это особенно актуально для тех, кто столкнулся с алкогольной интоксикацией в условиях, когда каждая минута имеет значение. Своевременная помощь позволяет не только устранить негативное воздействие алкоголя на организм, но и предотвратить возможные осложнения, такие как нарушения работы сердца, печени и почек.
Детальнее – нарколог на дом уфа
В этой публикации мы предлагаем подробные объяснения по актуальным вопросам, чтобы помочь читателям глубже понять их. Четкость и структурированность материала сделают его удобным для усвоения и применения в повседневной жизни.
Обратитесь за информацией – https://www.abcconsulting-cr.com/2022/09/28/defensa-publica-de-san-joaquin-pisav
Осмотр начинается с диагностики: врач измеряет давление, пульс, температуру, проводит экспресс-оценку состояния, собирает медицинский анамнез, уточняет длительность употребления, наличие хронических болезней и аллергий. На основе данных разрабатывается индивидуальная программа лечения:
Узнать больше – vyzvat-narkologicheskuyu-pomoshch
При обращении в клинику «НаркоНет» пациенту предоставляется полный спектр мероприятий, направленных на восстановление организма после запоя. Сначала наш специалист приезжает на дом в течение 30–60 минут после вызова. На месте проводится детальный осмотр: измеряются основные жизненные показатели (давление, пульс, уровень кислорода в крови), собирается подробный анамнез и оценивается степень интоксикации. Полученные данные позволяют врачу разработать индивидуальный план лечения.
Узнать больше – https://kapelnica-ot-zapoya-nizhniy-novgorod000.ru/
Каждый пациент в «НаркоМедцентре» в Балашихе с самого начала окружён вниманием и заботой. Сразу после обращения по телефону или через сайт медицинский персонал консультирует родственников, уточняет детали состояния, даёт рекомендации по первой помощи и при необходимости отправляет бригаду наркологов на дом. В случае тяжёлых абстинентных проявлений возможно экстренное транспортирование пациента в стационар.
Узнать больше – врач вывод из запоя
Клиника «НаркологикПлюс» предоставляет квалифицированную помощь нарколога на дому в Воронеже. Если вы или ваши близкие столкнулись с последствиями длительного употребления алкоголя или наркотиков, наши специалисты готовы оперативно выехать и оказать экстренную помощь. Мы проводим детоксикацию организма, снимаем симптомы абстинентного синдрома и стабилизируем состояние пациента, обеспечивая высокий уровень безопасности, строгую анонимность и индивидуальный подход.
Исследовать вопрос подробнее – vyzov-narkologa-na-dom voronezh
Обращение за помощью на дому имеет ряд неоспоримых преимуществ, особенно для тех, кто ценит конфиденциальность и стремится избежать дополнительных стрессовых факторов, связанных с посещением клиники:
Изучить вопрос глубже – вызов нарколога на дом цена уфа
В этом обзорном материале представлены увлекательные детали, которые находят отражение в различных аспектах жизни. Мы исследуем непонятные и интересные моменты, позволяя читателю увидеть картину целиком. Погрузитесь в мир знаний и удивительных открытий!
Подробнее тут – https://www.nordingrakonstby.se/produkt/konstbykassen-2024-konstnar-karin-efraim
В этой публикации мы предлагаем подробные объяснения по актуальным вопросам, чтобы помочь читателям глубже понять их. Четкость и структурированность материала сделают его удобным для усвоения и применения в повседневной жизни.
Доступ к полной версии – http://www.brambillacarlocenter.com/news/prova-news
Этот информационный материал собраны данные, которые помогут лучше понять текущие тенденции и процессы в различных сферах жизни. Мы предоставляем четкий анализ, графики и примеры, чтобы информация была не только понятной, но и практичной для принятия решений.
Нажми и узнай всё – https://linoprost.abopharma.info/2016/02/12/markup-text-alignment
Предлагаем вашему вниманию интересную справочную статью, в которой собраны ключевые моменты и нюансы по актуальным вопросам. Эта информация будет полезна как для профессионалов, так и для тех, кто только начинает изучать тему. Узнайте ответы на важные вопросы и расширьте свои знания!
Изучить вопрос глубже – https://silverchestcreations.com/product/artistic-heart-fork-bracelets
Этот информативный текст отличается привлекательным содержанием и актуальными данными. Мы предлагаем читателям взглянуть на привычные вещи под новым углом, предоставляя интересный и доступный материал. Получите удовольствие от чтения и расширьте кругозор!
Как достичь результата? – https://diamondrvpark.com/hello-world
Этот информативный текст выделяется своими захватывающими аспектами, которые делают сложные темы доступными и понятными. Мы стремимся предложить читателям глубину знаний вместе с разнообразием интересных фактов. Откройте новые горизонты и развивайте свои способности познавать мир!
Переходите по ссылке ниже – http://www.delicatedetailsphotography.com/fowler-family-toccoa-ga-family-children-photography
Эта информационная статья содержит полезные факты, советы и рекомендации, которые помогут вам быть в курсе последних тенденций и изменений в выбранной области. Материал составлен так, чтобы быть полезным и понятным каждому.
Как достичь результата? – https://engagecleveland.org/best-clubs-in-cleveland
Эта публикация завернет вас в вихрь увлекательного контента, сбрасывая стереотипы и открывая двери к новым идеям. Каждый абзац станет для вас открытием, полным ярких примеров и впечатляющих достижений. Подготовьтесь быть вовлеченными и удивленными каждый раз, когда продолжите читать.
Практические советы ждут тебя – http://www.omfrisorer.se/c/hair_face_pk_huset_ab
Этот увлекательный информационный материал подарит вам массу новых знаний и ярких эмоций. Мы собрали для вас интересные факты и сведения, которые обогатят ваш опыт. Откройте для себя увлекательный мир информации и насладитесь процессом изучения!
Ознакомиться с полной информацией – https://zdrav-pro.cz/orteza1
В этой публикации мы предлагаем подробные объяснения по актуальным вопросам, чтобы помочь читателям глубже понять их. Четкость и структурированность материала сделают его удобным для усвоения и применения в повседневной жизни.
Углубить понимание вопроса – https://veteransintrucking.com/five-puppies-are-on-a-very-special-mission-to-help-veterans
Этот увлекательный информационный материал подарит вам массу новых знаний и ярких эмоций. Мы собрали для вас интересные факты и сведения, которые обогатят ваш опыт. Откройте для себя увлекательный мир информации и насладитесь процессом изучения!
Ознакомьтесь с аналитикой – https://www.farovilan.com/iv-certamen-de-pintura-al-aire-libre-camarinas-todo-arte-3/bases-iv-concurso-pintura-2
Этот обзорный материал предоставляет информационно насыщенные данные, касающиеся актуальных тем. Мы стремимся сделать информацию доступной и структурированной, чтобы читатели могли легко ориентироваться в наших выводах. Познайте новое с нашим обзором!
Подробнее можно узнать тут – https://highbrow-lowlife.com/uncategorized/2-new-albums-out-by-vanessa-sinclair-pete-murphy
Эта публикация завернет вас в вихрь увлекательного контента, сбрасывая стереотипы и открывая двери к новым идеям. Каждый абзац станет для вас открытием, полным ярких примеров и впечатляющих достижений. Подготовьтесь быть вовлеченными и удивленными каждый раз, когда продолжите читать.
Более того — здесь – https://andy-bourne.com/portfolio/idles-ultra-mono/trackreleaseposter-9900000000079e3c
Эта статья предлагает живое освещение актуальной темы с множеством интересных фактов. Мы рассмотрим ключевые моменты, которые делают данную тему важной и актуальной. Подготовьтесь к насыщенному путешествию по неизвестным аспектам и узнайте больше о значимых событиях.
Углубиться в тему – http://fsn.asgard-ab.com/?p=168
Этот увлекательный информационный материал подарит вам массу новых знаний и ярких эмоций. Мы собрали для вас интересные факты и сведения, которые обогатят ваш опыт. Откройте для себя увлекательный мир информации и насладитесь процессом изучения!
Подробнее – https://ilgiardinovivace.it/index.php/component/k2/item/4?start=890
Этот увлекательный информационный материал подарит вам массу новых знаний и ярких эмоций. Мы собрали для вас интересные факты и сведения, которые обогатят ваш опыт. Откройте для себя увлекательный мир информации и насладитесь процессом изучения!
Читать дальше – https://forexcomerciante.pe/finanzas/las-5-principales-acciones-de-diciembre
Обращение за помощью нарколога на дому имеет ряд преимуществ, способствующих быстрому и эффективному лечению:
Подробнее тут – https://vyvod-iz-zapoya-yaroslavl00.ru/vyvod-iz-zapoya-kruglosutochno-yaroslavl
Продолжительный запой приводит к накоплению токсинов в организме, нарушению работы внутренних органов и развитию серьезных осложнений. Чем дольше человек находится в состоянии алкогольной интоксикации, тем выше риск повреждения сердца, печени и почек. Экстренное вмешательство позволяет оперативно вывести токсины, восстановить нормальные обменные процессы и предотвратить развитие хронических заболеваний.
Детальнее – владимир вывод из запоя
Этот текст сочетает в себе элементы познавательного рассказа и аналитической подачи информации. Читатель получает доступ к уникальным данным, которые соединяют прошлое с настоящим и открывают двери в будущее.
Подробная информация доступна по запросу – https://www.zahorany.cz/cropped-erb_zahorany-png
Формирование цены на вызов нарколога с проведением капельничного вывода из запоя зависит от нескольких ключевых параметров:
Исследовать вопрос подробнее – вывод из запоя цена владимир
Специалист выясняет, как долго продолжается запой, какие симптомы наблюдаются, а также наличие сопутствующих заболеваний. Эти данные позволяют сформировать индивидуальный план лечения и выбрать оптимальные методы детоксикации.
Получить дополнительную информацию – наркология вывод из запоя владимир
Когда организм на пределе, важна срочная помощь в Екатеринбурге — это команда опытных наркологов, которые помогут быстро и мягко выйти из запоя без вреда для здоровья.
Получить дополнительные сведения – наркологический вывод из запоя
Каждый день запоя увеличивает риск для жизни. Не рискуйте — специалисты в Екатеринбурге приедут на дом и окажут экстренную помощь. Без боли, стресса и ожидания.
Изучить вопрос глубже – vyvod-iz-zapoya gorod ekaterinburg
Процесс вывода из запоя на дому в Ярославле строится по четко отлаженной схеме, включающей несколько последовательных этапов, направленных на максимально быстрое и безопасное восстановление здоровья пациента.
Ознакомиться с деталями – вывод из запоя цена ярославль
Параллельно с медицинской терапией начинается работа психотерапевта. В индивидуальных и семейных сессиях пациенты учатся распознавать механизмы зависимости, вырабатывать новые стратегии поведения и справляться со стрессовыми ситуациями без употребления. Последний этап — реабилитация и ресоциализация — включает трудотерапию, арт- и групповую терапию, помощь в восстановлении профессиональных навыков и возвращении к социально-активной жизни.
Подробнее можно узнать тут – http://narkologicheskaya-klinika-mytishchi1.ru
После оформления заявки по телефону или на сайте оператор уточняет адрес и текущее состояние пациента. В критических ситуациях врач может прибыть в течение 60 минут, в стандартном режиме — за 1–2 часа. На месте проводится сбор анамнеза и оценка жизненных показателей: артериального давления, пульса, сатурации и температуры тела. Затем выбирается оптимальный протокол детоксикации — «мягкий» метод для постепенного выведения токсинов или экспресс-методика при острой интоксикации. Процедура капельного введения комбинированного раствора длится от двух до четырёх часов: специалист контролирует состояние пациента, корректирует дозировки и при необходимости вводит корригирующие препараты. По окончании врач оставляет детальный план поддерживающей терапии, включающий рекомендации по питанию, приёму сорбентов и витаминов, а также график повторных осмотров.
Изучить вопрос глубже – выезд нарколога на дом раменское
Ниже представлен перечень основных направлений, используемых в современной наркологической помощи. Этот список отражает комплексный подход к лечению зависимостей.
Детальнее – https://narkologicheskaya-pomoshh-perm0.ru/narkologiya-perm-anonimno
Наркологическая клиника в Новосибирске — это специализированное медицинское учреждение, предоставляющее комплексную помощь пациентам с различными формами зависимости. Использование современных методов диагностики и терапии позволяет достигать устойчивых результатов в лечении алкогольной, наркотической и других зависимостей. В клинике «Преодоление» работают опытные специалисты, разрабатывающие индивидуальные программы с учётом особенностей каждого пациента.
Разобраться лучше – наркологическая клиника вывод из запоя
Для повышения эффективности терапии применяются физиотерапевтические процедуры и витаминные комплексы, которые ускоряют восстановление и повышают сопротивляемость организма стрессам.
Ознакомиться с деталями – http://narkologicheskaya-klinika-omsk0.ru/
Анонимная помощь при запое — врачи «Alco.Rehab» (Москва) приедут к вам в течение часа.
Подробнее можно узнать тут – вывод из запоя клиника
Лечение наркомании в Омске является сложным медицинским процессом, требующим комплексного подхода и участия квалифицированных специалистов. Современная наркологическая клиника «Ренессанс» предлагает полный спектр услуг, направленных на восстановление физического и психического здоровья пациентов с различными формами наркотической зависимости. В клинике используются доказанные методы терапии, которые обеспечивают стабильную ремиссию и помогают вернуться к полноценной жизни.
Разобраться лучше – https://lechenie-narkomanii-omsk0.ru/besplatnoe-lechenie-narkomanii-v-omske
Вывод из запоя без стресса — специалисты клиники «Alco.Rehab» в Москве знают, как помочь быстро и безопасно.
Получить дополнительную информацию – вывод из запоя на дому город москва
Кодирование основано на блокировке механизмов зависимости на биохимическом и поведенческом уровнях. Медикаментозные методы включают введение препаратов пролонгированного действия, которые нарушают метаболизм этанола: при попытке выпить даже небольшую дозу алкоголь вызывает выражённые неприятные реакции, что психологически отвращает от новой пробы спиртного. Психотерапевтические техники, такие как гипноз или метод Довженко, направлены на переустановку подсознательных программ, удаление эмоционального влечения к алкоголю и укрепление мотивации к здоровому образу жизни. Аппаратные методики (электроимпульсная стимуляция, транскраниальная микрополяризация) воздействуют на нейроны, участвующие в развитии зависимости, снижая их активность и уменьшая физиологический дискомфорт. В «Орион-Клиник» часто используют комбинированные программы: сначала проводится детоксикация организма, затем вводится медикаментозное средство, после чего реализуется психотерапевтический блок влияния на подсознание.
Получить дополнительные сведения – медицинский центр кодирование от алкоголизма
С момента начала лечения пациент получает доступ к круглосуточной линии поддержки. Врачи, психологи и координаторы готовы ответить на вопросы, помочь с корректировкой схемы лечения, поддержать в ситуации риска срыва. Эта функция особенно востребована в первые недели после выписки, когда человек сталкивается с триггерами в привычной среде и нуждается в дополнительной защите. Связь может осуществляться по телефону, через защищённый мессенджер или с помощью мобильного приложения клиники.
Разобраться лучше – https://lechenie-narkomanii-samara0.ru/reabilitacziya-narkomana-samara
После завершения основной инфузионной терапии врач наблюдает за состоянием пациента ещё в течение 30–60 минут. Если отсутствуют осложнения и параметры стабилизированы, врач даёт рекомендации по дальнейшему восстановлению, включая приём анксиолитиков, соблюдение питьевого режима, лёгкой диеты и исключение стрессов. Также составляется индивидуальный план наблюдения: возможны повторные визиты врача через сутки, двое или трое суток. При необходимости пациенту или его близким предоставляется контакт психотерапевта или проводится предварительное консультирование по дальнейшему лечению зависимости.
Выяснить больше – нарколог наркологическая помощь в новосибирске
Лечение не заканчивается после завершения курса. Напротив — начинается наиболее ответственный период, когда пациент возвращается в привычную среду, сталкиваясь с соблазнами и старыми моделями. В «РеабПермь» предусмотрен целый блок постлечебной адаптации. Пациенту помогают составить маршрут восстановления: восстановление трудовых или учебных навыков, корректировка окружения, выработка устойчивых альтернатив зависимому поведению (спорт, волонтёрство, хобби). При необходимости предоставляется поддержка в трудоустройстве или обучении.
Подробнее можно узнать тут – запой лечение наркомания в перми
В клинике «СамарМед» доступно несколько форм лечения: стационарная программа, дневной стационар, амбулаторное наблюдение и гибридные схемы. Пациенты могут выбрать комфортный вариант в зависимости от степени зависимости, текущего состояния и занятости. Внутри стационара предусмотрены как стандартные палаты, так и индивидуальные блоки повышенной комфортности с возможностью проживания совместно с сопровождающим лицом.
Получить дополнительные сведения – наркологическая клиника лечение алкоголизма самара
Описание
Углубиться в тему – частная наркологическая помощь в самаре
Процесс вывода из запоя на дому в Ярославле строится по четко отлаженной схеме, включающей несколько последовательных этапов, направленных на максимально быстрое и безопасное восстановление здоровья пациента.
Исследовать вопрос подробнее – vyvod-iz-zapoya-na-domu jaroslavl’
Вывод из запоя без стресса — специалисты клиники «Alco.Rehab» в Москве знают, как помочь быстро и безопасно.
Подробнее тут – vyvod-iz-zapoya-czena moskva
Самостоятельно выйти из запоя — почти невозможно. В Екатеринбурге врачи клиники проводят медикаментозный вывод из запоя с круглосуточным выездом. Доверяйте профессионалам.
Изучить вопрос глубже – наркологический вывод из запоя город екатеринбург
Незамедлительно после вызова нарколог прибывает на дом для проведения тщательного осмотра. На данном этапе специалист собирает анамнез, измеряет жизненно важные показатели — пульс, артериальное давление, температуру — и оценивает степень интоксикации. Эти данные являются основой для составления индивидуального плана лечения.
Детальнее – нарколог вывод из запоя владимир
Самостоятельно выйти из запоя — почти невозможно. В Екатеринбурге врачи клиники проводят медикаментозный вывод из запоя с круглосуточным выездом. Доверяйте профессионалам.
Изучить вопрос глубже – вывод из запоя капельница в екатеринбурге
Комплексное лечение на дому организовано по строго отлаженной схеме, позволяющей оперативно стабилизировать состояние пациента и провести качественную детоксикацию.
Углубиться в тему – https://vyvod-iz-zapoya-vladimir00.ru/srochnyj-vyvod-iz-zapoya-vladimir
Сразу после вызова нарколог приезжает для проведения детального осмотра. На этом этапе производится сбор анамнеза, измеряются жизненно важные показатели – пульс, артериальное давление, температура – и оценивается степень интоксикации.
Узнать больше – нарколог на дом вывод из запоя на дому
В зависимости от степени выраженности абстинентного синдрома и наличия сопутствующих осложнений клиника «Азимут Здоровья» предлагает два основных формата оказания помощи, позволяющих оптимально сочетать эффективность лечения и комфорт пациента. Каждый вариант тщательно продуман: мы учитываем не только медицинские показания, но и личные предпочтения, чтобы вы или ваш близкий чувствовали себя максимально защищённо и спокойно. Оба формата подразумевают строгий контроль жизненных показателей и сопровождение на всех этапах — от первой капельницы до завершения курса поддерживающей терапии.
Ознакомиться с деталями – narkolog na dom nedorogo
Ниже представлен перечень основных направлений, используемых в современной наркологической помощи. Этот список отражает комплексный подход к лечению зависимостей.
Подробнее можно узнать тут – http://narkologicheskaya-pomoshh-perm0.ru/narkologiya-perm-anonimno/
Для повышения эффективности терапии применяются физиотерапевтические процедуры и витаминные комплексы, которые ускоряют восстановление и повышают сопротивляемость организма стрессам.
Разобраться лучше – наркологическая клиника наркологический центр
Пациенты получают помощь при:
Разобраться лучше – наркологическая клиника нарколог
Когда запой угрожает здоровью, каждая минута имеет решающее значение. В Ярославле квалифицированные специалисты по наркологии оказывают помощь на дому, позволяя оперативно начать лечение алкогольной интоксикации и вывести токсины из организма. Такой формат терапии обеспечивает комфортные условия для пациента, максимальную конфиденциальность и индивидуальный подход, что особенно важно для быстрого и безопасного восстановления здоровья.
Узнать больше – вывод из запоя анонимно ярославль
После прохождения этапа детоксикации и стабилизации состояния начинается длительный период реабилитации, который направлен на укрепление достигнутых результатов и предотвращение рецидивов. Важно, что в наркологической клинике «Ренессанс» реализуется индивидуальный подход к каждому пациенту с учётом его психосоциального окружения.
Детальнее – лечение наркомании диспансер
На первом этапе проводится комплексное обследование, позволяющее выявить степень зависимости, определить физическое и психическое состояние пациента, а также выявить сопутствующие заболевания. Это позволяет составить индивидуальный план лечения.
Получить больше информации – https://lechenie-narkomanii-novosibirsk0.ru/lechenie-narkomanii-v-novosibirske-besplatno
Близкий человек в запое? Не ждите ухудшения. Обратитесь в клинику — здесь проведут профессиональный вывод из запоя с последующим восстановлением организма.
Узнать больше – срочный вывод из запоя
Перед кодированием важно снять острую интоксикацию и стабилизировать состояние. В «Орион-Клиник» пациенту проводят курс инфузионной терапии: капельницы с регидратационными растворами, гепатопротекторами и витаминно-минеральными комплексами. Это позволяет восстановить водно-электролитный баланс, поддержать функции печени и почек, нормализовать артериальное давление и работу сердца. Одновременно психолог проводит предварительные беседы для выяснения причин зависимости, уровня тревожности и мотивации. Подготовительный этап длится от одного до трёх дней в зависимости от тяжести состояния и поможет снизить риск побочных эффектов при введении кодирующего препарата.
Получить дополнительные сведения – кодирование от алкоголизма на дому
Первичная консультация в «РеабПермь» проводится конфиденциально, без постановки на учёт и без обязательств. Её задача — оценить текущее состояние пациента, установить мотивацию к лечению и подобрать оптимальный план терапии. На встрече специалист собирает анамнез, задаёт уточняющие вопросы, объясняет суть зависимости и предлагает возможные варианты вмешательства. Консультация может проходить очно или онлайн, с участием самого пациента или его родственников. Это особенно полезно на ранних стадиях, когда человек ещё не готов к госпитализации, но нуждается в грамотной поддержке и убеждении.
Подробнее можно узнать тут – https://lechenie-narkomanii-perm0.ru/besplatnoe-lechenie-narkomanii-v-permi/
После диагностики нарколог приступает к основному этапу — инфузионной детоксикации. Препараты подбираются индивидуально, с учётом тяжести интоксикации, анамнеза и сопутствующих заболеваний. Основу составляют водно-солевые растворы, глюкоза, витаминные комплексы, седативные препараты, гепатопротекторы и нейропротекторы. Инфузии выполняются капельно, медленно, в течение нескольких часов, с постоянным мониторингом состояния пациента. При необходимости используется оксигенотерапия, противорвотные, антиаритмические и противосудорожные препараты. Все растворы стерильны, а расходные материалы одноразовые и соответствуют стандартам качества.
Изучить вопрос глубже – https://narkologicheskaya-pomoshh-novosibirsk0.ru/narkologicheskaya-pomoshh-na-domu-novosibirsk
Современная наркологическая помощь требует не только эффективных методик лечения, но и гибкости в организации терапевтического процесса. В условиях динамичного ритма жизни пациенты всё чаще ищут решение, которое позволяет получать профессиональную медицинскую поддержку без необходимости длительной госпитализации или ожидания очередей. Именно такой подход реализуется в наркологической клинике «СамарМед». Здесь сочетаются передовые методы лечения зависимостей с возможностями телемедицины, а сам процесс терапии строится на основе мультидисциплинарного подхода, где каждый пациент получает поддержку не одного врача, а целой команды узкопрофильных специалистов.
Получить дополнительную информацию – http://narkologicheskaya-klinika-samara0.ru/narkologicheskij-dispanser-g-samara/
Описание
Выяснить больше – частная наркологическая помощь
Алкоголь стал проблемой? В клинике «Alco.Rehab» в Москве знают, как вернуть вас к нормальной жизни.
Детальнее – вывод из запоя клиника в москве
После оформления заявки по телефону или на сайте оператор уточняет адрес и текущее состояние пациента. В критических ситуациях врач может прибыть в течение 60 минут, в стандартном режиме — за 1–2 часа. На месте проводится сбор анамнеза и оценка жизненных показателей: артериального давления, пульса, сатурации и температуры тела. Затем выбирается оптимальный протокол детоксикации — «мягкий» метод для постепенного выведения токсинов или экспресс-методика при острой интоксикации. Процедура капельного введения комбинированного раствора длится от двух до четырёх часов: специалист контролирует состояние пациента, корректирует дозировки и при необходимости вводит корригирующие препараты. По окончании врач оставляет детальный план поддерживающей терапии, включающий рекомендации по питанию, приёму сорбентов и витаминов, а также график повторных осмотров.
Подробнее тут – https://narkolog-na-dom-ramenskoe4.ru/narkolog-na-dom-ceny-v-ramenskom
Близкий человек в запое? Не ждите ухудшения. Обратитесь в клинику — здесь проведут профессиональный вывод из запоя с последующим восстановлением организма.
Подробнее можно узнать тут – вывод из запоя
Когда запой угрожает здоровью, каждая минута имеет решающее значение. В Ярославле квалифицированные специалисты по наркологии оказывают помощь на дому, позволяя оперативно начать лечение алкогольной интоксикации и вывести токсины из организма. Такой формат терапии обеспечивает комфортные условия для пациента, максимальную конфиденциальность и индивидуальный подход, что особенно важно для быстрого и безопасного восстановления здоровья.
Подробнее тут – vyvod-iz-zapoya-czena jaroslavl’
Спокойный выход из кризиса — воспользуйтесь услугой вывода из запоя от «Alco.Rehab» в Москве.
Исследовать вопрос подробнее – вывод из запоя на дому
В обычных условиях цена услуги составляет от 1500 до 2500 рублей. Эта сумма включает выезд специалиста, первичный осмотр и базовую детоксикационную терапию.
Углубиться в тему – вывод из запоя недорого владимир
С момента начала лечения пациент получает доступ к круглосуточной линии поддержки. Врачи, психологи и координаторы готовы ответить на вопросы, помочь с корректировкой схемы лечения, поддержать в ситуации риска срыва. Эта функция особенно востребована в первые недели после выписки, когда человек сталкивается с триггерами в привычной среде и нуждается в дополнительной защите. Связь может осуществляться по телефону, через защищённый мессенджер или с помощью мобильного приложения клиники.
Узнать больше – лечение наркомании цена самара
Ниже представлен перечень основных направлений, используемых в современной наркологической помощи. Этот список отражает комплексный подход к лечению зависимостей.
Углубиться в тему – скорая наркологическая помощь пермь
Близкий человек в запое? Не ждите ухудшения. Обратитесь в клинику — здесь проведут профессиональный вывод из запоя с последующим восстановлением организма.
Получить дополнительную информацию – http://vyvod-iz-zapoya-ekaterinburg.ru
Ниже представлена таблица, отражающая основные направления медикаментозного лечения и сопутствующих процедур:
Изучить вопрос глубже – наркологическая клиника лечение алкоголизма в омске
Процесс лечения зависимости включает несколько последовательных этапов, каждый из которых важен для достижения стойкой ремиссии и возвращения к полноценной жизни. Для успешного результата необходима последовательная работа специалистов и активное участие пациента.
Углубиться в тему – http://lechenie-narkomanii-novosibirsk0.ru
Лечение наркомании в Омске является сложным медицинским процессом, требующим комплексного подхода и участия квалифицированных специалистов. Современная наркологическая клиника «Ренессанс» предлагает полный спектр услуг, направленных на восстановление физического и психического здоровья пациентов с различными формами наркотической зависимости. В клинике используются доказанные методы терапии, которые обеспечивают стабильную ремиссию и помогают вернуться к полноценной жизни.
Разобраться лучше – http://lechenie-narkomanii-omsk0.ru/
Сразу после вызова нарколог прибывает на дом для проведения тщательного первичного осмотра. На этом этапе специалист собирает краткий анамнез, измеряет жизненно важные показатели – пульс, артериальное давление, температуру – и оценивает степень алкогольной интоксикации. Полученные данные служат основой для составления индивидуального плана лечения, позволяющего подобрать оптимальные методы детоксикации.
Подробнее – https://vyvod-iz-zapoya-yaroslavl00.ru/vyvod-iz-zapoya-na-domu-yaroslavl
Каждый день запоя увеличивает риск для жизни. Не рискуйте — специалисты в Екатеринбурге приедут на дом и окажут экстренную помощь. Без боли, стресса и ожидания.
Подробнее можно узнать тут – вывод из запоя клиника
Пациенты получают помощь при:
Выяснить больше – вывод наркологическая клиника в новосибирске
Многие люди с зависимостью или их близкие начинают путь к избавлению от наркомании с самолечения или обращения к народным методам. К сожалению, такой путь почти всегда заканчивается рецидивом. Причина в том, что наркотическая зависимость формируется на нескольких уровнях — физиологическом, психологическом и социальном. Без системного подхода устойчивой ремиссии достичь невозможно. Профессиональное лечение в «РеабПермь» позволяет воздействовать на все механизмы заболевания, включая биохимические нарушения, искажённые модели мышления и нарушения в структуре личности, которые провоцируют употребление.
Узнать больше – центр анонимного лечения наркомании
Услуга
Изучить вопрос глубже – http://narkolog-na-dom-ramenskoe4.ru
После завершения детоксикации и подготовки организма врач-нарколог приступает к основной процедуре. В зависимости от выбранного метода это может быть внутримышечная или внутривенная инъекция препарата пролонгированного действия, гипнотическая сессия или подключение аппарата для электроимпульсного кодирования. Эта часть занимает от получаса до двух часов, включая время на объяснение техники и адаптацию пациента. Во время сеанса психолог присутствует для поддержки и контроля эмоционального состояния. По завершении врач остаётся рядом ещё один-два часа, внимательно наблюдая за общим состоянием, фиксируя показания давления и сердечного ритма, а при необходимости корректируя терапию. Пациент получает подробные письменные рекомендации: список запрещённых веществ и медикаментов, график приёма поддерживающих препаратов и расписание контрольных визитов для оценки эффективности кодирования.
Получить дополнительную информацию – kodirovanie ot alkogolizma na domu v pushkino
В «СамарМед» пациент рассматривается не как носитель диагноза, а как личность с уникальной историей, эмоциональным фоном, социальным окружением и индивидуальными триггерами зависимости. Именно поэтому с первого обращения к лечению подключаются сразу несколько специалистов. Стартовый консилиум позволяет сформировать целостную картину состояния, определить точки риска и создать персонализированную стратегию терапии, включающую медицинскую, психотерапевтическую и социальную составляющие.
Детальнее – наркологическая клиника наркологический центр
20
Исследовать вопрос подробнее – вывод из запоя на дому московская область
После завершения основной инфузионной терапии врач наблюдает за состоянием пациента ещё в течение 30–60 минут. Если отсутствуют осложнения и параметры стабилизированы, врач даёт рекомендации по дальнейшему восстановлению, включая приём анксиолитиков, соблюдение питьевого режима, лёгкой диеты и исключение стрессов. Также составляется индивидуальный план наблюдения: возможны повторные визиты врача через сутки, двое или трое суток. При необходимости пациенту или его близким предоставляется контакт психотерапевта или проводится предварительное консультирование по дальнейшему лечению зависимости.
Ознакомиться с деталями – http://narkologicheskaya-pomoshh-novosibirsk0.ru/narkologicheskaya-pomoshh-na-domu-novosibirsk/
В Екатеринбурге решение есть — наркологическая клиника. Здесь помогают людям выйти из запоя без страха и осуждения. Всё анонимно, грамотно и с заботой о каждом пациенте.
Получить дополнительные сведения – екатеринбург
Перед изложением таблицы следует отметить, что подбор методов лечения зависит от стадии и тяжести зависимости, а также индивидуальных особенностей пациента.
Ознакомиться с деталями – наркологическая психиатрическая помощь в самаре
20
Подробнее можно узнать тут – [url=https://vyvod-iz-zapoya-moskva13.ru/]вывод из запоя цена город москва[/url]
Медикаментозная терапия направлена на снятие симптомов абстиненции, нормализацию функций органов и систем, а также коррекцию психоэмоционального состояния пациента. Используются препараты, способствующие детоксикации, стабилизации работы нервной системы и улучшению общего самочувствия.
Ознакомиться с деталями – вызвать наркологическую помощь пермь
В зависимости от степени выраженности абстинентного синдрома и наличия сопутствующих осложнений клиника «Азимут Здоровья» предлагает два основных формата оказания помощи, позволяющих оптимально сочетать эффективность лечения и комфорт пациента. Каждый вариант тщательно продуман: мы учитываем не только медицинские показания, но и личные предпочтения, чтобы вы или ваш близкий чувствовали себя максимально защищённо и спокойно. Оба формата подразумевают строгий контроль жизненных показателей и сопровождение на всех этапах — от первой капельницы до завершения курса поддерживающей терапии.
Выяснить больше – https://narkolog-na-dom-ramenskoe4.ru/
Эта статья предлагает живое освещение актуальной темы с множеством интересных фактов. Мы рассмотрим ключевые моменты, которые делают данную тему важной и актуальной. Подготовьтесь к насыщенному путешествию по неизвестным аспектам и узнайте больше о значимых событиях.
Продолжить изучение – https://vistoweekly.com/dr-levy-psychologist-ornl
Этот интересный отчет представляет собой сборник полезных фактов, касающихся актуальных тем. Мы проанализируем данные, чтобы вы могли сделать обоснованные выводы. Читайте, чтобы узнать больше о последних трендах и значимых событиях!
Провести детальное исследование – https://ocskincancer.com/our-doctors/attachment/screen-shot-2021-01-15-at-2-48-43-pm-2
В этой информационной статье вы найдете интересное содержание, которое поможет вам расширить свои знания. Мы предлагаем увлекательный подход и уникальные взгляды на обсуждаемые темы, побуждая пользователей к активному мышлению и критическому анализу.
Узнай первым! – https://vistoweekly.com/domestic-violence-advocate-kim-wilso
Мы собрали для вас самые захватывающие факты из мира науки и истории. От малознакомых деталей до грандиозных событий — эта статья расширит ваш кругозор и подарит новое понимание того, как устроен наш мир.
Практические советы ждут тебя – https://gitedouiret.com/gite_raouf_accueil2_gitedouiret-com
Эта обзорная заметка содержит ключевые моменты и факты по актуальным вопросам. Она поможет читателям быстро ориентироваться в теме и узнать о самых важных аспектах сегодня. Получите краткий курс по современной информации и оставайтесь в курсе событий!
Узнай первым! – https://www.taylordentist.com/living-with-sensitive-teeth-during-the-holiday-season
Эта информационная статья содержит полезные факты, советы и рекомендации, которые помогут вам быть в курсе последних тенденций и изменений в выбранной области. Материал составлен так, чтобы быть полезным и понятным каждому.
Обратитесь за информацией – https://alfalhosah.com/%D9%84%D8%A8%D8%B4%D8%B1%D8%A9-%D8%A8%D9%8A%D8%B6%D8%A7%D8%A1-%D9%85%D8%AB%D9%84-%D8%A7%D9%84%D8%AB%D9%84%D8%AC-%D8%A7%D9%84%D8%AE%D9%84%D9%8A%D8%B7-%D8%A7%D9%84%D8%B3%D8%AD%D8%B1%D9%89-%D8%A8%D8%A7
Эта статья предлагает уникальную подборку занимательных фактов и необычных историй, которые вы, возможно, не знали. Мы постараемся вдохновить ваше воображение и разнообразить ваш кругозор, погружая вас в мир, полный интересных открытий. Читайте и открывайте для себя новое!
Ознакомиться с деталями – https://tecnocalvalparaiso.cl/2020/hola-mundo
Эта статья для ознакомления предлагает читателям общее представление об актуальной теме. Мы стремимся представить ключевые факты и идеи, которые помогут читателям получить представление о предмете и решить, стоит ли углубляться в изучение.
Изучить аспект более тщательно – https://unltdafrica.com/2024/03/12/the-best-pork-kebabs-with-grilled-plums-and-couscous-is-found-in-poland
Публикация предлагает уникальную подборку информации, которая будет интересна как специалистам, так и широкому кругу читателей. Здесь вы найдете ответы на часто задаваемые вопросы и полезные инсайты для дальнейшего применения.
Смотрите также… – https://educateur-liberal-marseille.fr/2019/12/18/bonjour-tout-le-monde
В рамках работы клиники проводятся диагностические процедуры и различные виды терапии, включающие:
Разобраться лучше – [url=https://narkologicheskaya-klinika-vladimir0.ru/]запой наркологическая клиника владимир[/url]
В этой статье вы найдете познавательную и занимательную информацию, которая поможет вам лучше понять мир вокруг. Мы собрали интересные данные, которые вдохновляют на размышления и побуждают к действиям. Открывайте новую информацию и получайте удовольствие от чтения!
Ознакомьтесь с аналитикой – https://www.nswr.it/prime-day-2021
Этот увлекательный информационный материал подарит вам массу новых знаний и ярких эмоций. Мы собрали для вас интересные факты и сведения, которые обогатят ваш опыт. Откройте для себя увлекательный мир информации и насладитесь процессом изучения!
Обратитесь за информацией – https://f5fashion.vn/cap-nhat-65-ve-tranh-to-mau-qua-cam-hay-nhat
В этой публикации мы предлагаем подробные объяснения по актуальным вопросам, чтобы помочь читателям глубже понять их. Четкость и структурированность материала сделают его удобным для усвоения и применения в повседневной жизни.
Подробнее – https://cosmicdreamcatchers.com/neptune-in-pisces-mystical-dreams
Эта информационная заметка содержит увлекательные сведения, которые могут вас удивить! Мы собрали интересные факты, которые сделают вашу жизнь ярче и полнее. Узнайте нечто новое о привычных аспектах повседневности и откройте для себя удивительный мир информации.
Получить исчерпывающие сведения – http://solariaopere.eu/cropped-logo-def-10×10-jpg
В этой публикации мы предлагаем подробные объяснения по актуальным вопросам, чтобы помочь читателям глубже понять их. Четкость и структурированность материала сделают его удобным для усвоения и применения в повседневной жизни.
Обратитесь за информацией – https://www.ruimteaanleren.nl/sustainable-education
Этот информативный текст выделяется своими захватывающими аспектами, которые делают сложные темы доступными и понятными. Мы стремимся предложить читателям глубину знаний вместе с разнообразием интересных фактов. Откройте новые горизонты и развивайте свои способности познавать мир!
Подробнее тут – https://www.bloos.nu/favicon1
Эта публикация завернет вас в вихрь увлекательного контента, сбрасывая стереотипы и открывая двери к новым идеям. Каждый абзац станет для вас открытием, полным ярких примеров и впечатляющих достижений. Подготовьтесь быть вовлеченными и удивленными каждый раз, когда продолжите читать.
Более того — здесь – http://art-e-lit.ru
Эта обзорная заметка содержит ключевые моменты и факты по актуальным вопросам. Она поможет читателям быстро ориентироваться в теме и узнать о самых важных аспектах сегодня. Получите краткий курс по современной информации и оставайтесь в курсе событий!
Ознакомиться с деталями – https://www.wif.malopolska.pl/info
Мы предлагаем вам подробное руководство, основанное на проверенных источниках и реальных примерах. Каждая часть публикации направлена на то, чтобы помочь вам разобраться в сложных вопросах и применить знания на практике.
Обратитесь за информацией – https://www.capitalrent.eu/we-are-actively-looking-for-an-employee
В этой статье представлен занимательный и актуальный контент, который заставит вас задуматься. Мы обсуждаем насущные вопросы и проблемы, а также освещаем истории, которые вдохновляют на действия и изменения. Узнайте, что стоит за событиями нашего времени!
Ознакомьтесь с аналитикой – https://themonamarshall.com/indian-bride-traditions
Мы собрали для вас самые захватывающие факты из мира науки и истории. От малознакомых деталей до грандиозных событий — эта статья расширит ваш кругозор и подарит новое понимание того, как устроен наш мир.
Более того — здесь – https://gb-sk.de/baumfall-und-forstarbeiten
В этой публикации мы предлагаем подробные объяснения по актуальным вопросам, чтобы помочь читателям глубже понять их. Четкость и структурированность материала сделают его удобным для усвоения и применения в повседневной жизни.
Читать дальше – https://www.orcaretirement.com/retirement-home/glynnwood-retirement-residence
Эта публикация завернет вас в вихрь увлекательного контента, сбрасывая стереотипы и открывая двери к новым идеям. Каждый абзац станет для вас открытием, полным ярких примеров и впечатляющих достижений. Подготовьтесь быть вовлеченными и удивленными каждый раз, когда продолжите читать.
Ознакомиться с деталями – https://addictionsupportpodcast.com/asp-004-4-easy-nutrition-tips-for-more-happiness-from-terra-rose-ganem-of-body-brilliance/body-brilliant-grey-sea-salt
Эта публикация завернет вас в вихрь увлекательного контента, сбрасывая стереотипы и открывая двери к новым идеям. Каждый абзац станет для вас открытием, полным ярких примеров и впечатляющих достижений. Подготовьтесь быть вовлеченными и удивленными каждый раз, когда продолжите читать.
Практические советы ждут тебя – https://www.ehg-kaunitz.de/2016/08/neue-webseite-der-ehg-kaunitz
Этот информативный текст отличается привлекательным содержанием и актуальными данными. Мы предлагаем читателям взглянуть на привычные вещи под новым углом, предоставляя интересный и доступный материал. Получите удовольствие от чтения и расширьте кругозор!
Получить дополнительную информацию – http://izbaszczepankowo.pl/flexi/slub
В этой статье представлен занимательный и актуальный контент, который заставит вас задуматься. Мы обсуждаем насущные вопросы и проблемы, а также освещаем истории, которые вдохновляют на действия и изменения. Узнайте, что стоит за событиями нашего времени!
Изучить вопрос глубже – https://aircopengineers.com/simple-steps-for-replacing-old-tiling
Правильный подбор лекарственных средств позволяет не только уменьшить проявления синдрома отмены, но и стабилизировать эмоциональное состояние пациента, снижая риск срывов. Реабилитационные программы включают физиотерапию, спортивные занятия и коррекцию образа жизни, что способствует полноценному восстановлению организма.
Получить дополнительную информацию – центр анонимного лечения наркомании в твери
Наркологическая клиника в Твери представляет собой современное медицинское учреждение, специализирующееся на диагностике и лечении алкогольной, наркотической и других видов зависимости. В клинике «Гелиос» применяются инновационные методы терапии, направленные на полное восстановление физического и психологического состояния пациентов.
Получить дополнительные сведения – наркологическая клиника вывод из запоя
В клинике «Альтернатива» применяются современные методы терапии, включающие медикаментозное лечение, психотерапию и социальную реабилитацию.
Исследовать вопрос подробнее – анонимная наркологическая помощь
Преимущество
Детальнее – капельница от запоя на дому краснодар
Абстинентный синдром развивается после прекращения приёма наркотических веществ или алкоголя, и сопровождается комплексом тяжёлых симптомов:
Узнать больше – снятие ломки в краснодаре
Одним из ключевых факторов успешного лечения наркомании является психотерапия. В клинике «Сибирский Доктор» применяются различные методы психотерапии, включая когнитивно-поведенческую терапию, групповые и индивидуальные занятия, которые помогают пациентам осознать причины зависимости, научиться справляться с эмоциональными и психологическими трудностями.
Получить дополнительную информацию – https://lechenie-narkomanii-novosibirsk0.ru/
Pretty section of content. I just stumbled upon your blog and in accession capital to assert that I acquire in fact enjoyed account your blog posts. Any way I will be subscribing to your feeds and even I achievement you access consistently rapidly.
cat casino
Во многих случаях пациент или его родственники не решаются сразу вызвать врача. Для таких ситуаций предусмотрена услуга онлайн-консультации. Она проводится через защищённую видеосвязь, при желании — анонимно. На связи — врач-нарколог или психиатр, который отвечает на вопросы, оценивает ситуацию по визуальным и вербальным признакам, рекомендует план действий. Консультация может стать отправной точкой для дальнейшего вызова врача на дом или записи в клинику. Это особенно удобно для родственников, которые не знают, как подступиться к проблеме и убедить человека в необходимости помощи.
Получить дополнительную информацию – наркологическая психиатрическая помощь
20
Ознакомиться с деталями – вывод из запоя клиника
Диагностика в клинике «КузбассМед» проводится комплексно: используются лабораторные, инструментальные и психологические методы. Благодаря применению цифровых систем и алгоритмов обработки данных, результаты анализов доступны уже в течение первого часа. Оценка проводится по нескольким направлениям: токсикологический статус, состояние печени и почек, электролитный баланс, нейровегетативное состояние, когнитивные функции и уровень стресса. Это позволяет врачам составлять максимально точную картину заболевания и подбирать индивидуальные методы терапии.
Исследовать вопрос подробнее – http://narkologicheskaya-klinika-novokuzneczk0.ru/narkolog-novokuzneczk-na-dom/
Attractive section of content. I just stumbled upon your website and in accession capital to assert that I acquire actually enjoyed account your blog posts. Any way I will be subscribing to your feeds and even I achievement you access consistently fast.
зеркало zooma casino
Нужна срочная помощь? Центр «Alco.Rehab» в Москве предлагает круглосуточный вывод из запоя с выездом на дом.
Подробнее можно узнать тут – vyvod-iz-zapoya gorod moskva
Пациенты клиники «НаркоМед» полностью застрахованы от утечки личной информации. Приём и лечение оформляются по псевдониму, документы не передаются в другие организации.
Исследовать вопрос подробнее – наркологическая клиника нарколог в екатеринбурге
Наркозависимость — это не просто вредная привычка, а тяжёлое хроническое заболевание, требующее комплексного и последовательного лечения. В клинике «РеабКузбасс» в Новокузнецке разработаны персонализированные программы помощи, учитывающие медицинские, психологические и социальные аспекты проблемы. Каждому пациенту подбирается уникальный маршрут восстановления, начиная с первичной диагностики и заканчивая адаптацией к жизни без наркотиков. Поддержка оказывается круглосуточно, с полным соблюдением конфиденциальности. Психотерапевты и врачи работают в тесной связке, чтобы не только устранить физическую зависимость, но и восстановить личность пациента, вернуть ему мотивацию к жизни и уверенность в будущем.
Выяснить больше – лечение наркомании на дому
Врач самостоятельно оценивает тяжесть интоксикации и назначает необходимый курс инфузий, физиопроцедур и приём препаратов. Варианты терапии включают детокс-комплекс, коррекцию водно-электролитного баланса и витаминотерапию.
Детальнее – наркологическая клиника в архангельске
Преимущество
Подробнее – https://vyvod-iz-zapoya-sochi777.ru/
Игнорирование этих симптомов опасно для жизни и здоровья. Своевременное обращение в клинику «Рестарт» позволит оперативно и безопасно облегчить симптомы ломки и избежать серьезных последствий.
Выяснить больше – снять ломку
После прибытия на место врач проводит тщательное обследование пациента. Измеряются основные физиологические параметры — артериальное давление, частота пульса, сатурация кислорода, температура тела. Проводится экспресс-анализ крови на сахар и кислотно-щелочной баланс. Также врач проводит оценку неврологического и психического статуса пациента, проверяет уровень сознания по шкале Глазго, выявляет признаки возможных осложнений: отёка мозга, энцефалопатии, алкогольного делирия. При необходимости принимается решение о дополнительной поддержке (например, вызов реанимационной бригады или немедленный перевод в стационар).
Узнать больше – платная наркологическая помощь
Преимущество
Подробнее – вызвать капельницу от запоя краснодар
Hello, yeah this article is genuinely good and I have learned lot of things from it on the topic of blogging. thanks.
bestgoogle
Hi there! This post couldn’t be written any better! Reading through this post reminds me of my previous room mate! He always kept chatting about this. I will forward this article to him. Pretty sure he will have a good read. Many thanks for sharing!
зеркало либет казино
Для многих пациентов страх быть поставленным на учёт или потерять работу становится серьёзным барьером на пути к выздоровлению. В «ПермьМедСервис» данные пациента остаются строго внутри клиники: ни в какие внешние базы информация не передаётся. При оформлении документов не указывается диагноз, а возможна подача под псевдонимом. Консультации, процедуры и ведение истории болезни проходят в полностью закрытом режиме. Это позволяет пациенту сосредоточиться на выздоровлении, не опасаясь последствий для своей личной или профессиональной жизни.
Изучить вопрос глубже – http://narkologicheskaya-klinika-perm0.ru/
Абстинентный синдром, или ломка, – это тяжелое состояние, которое развивается у зависимых после отказа от наркотиков или алкоголя. Он сопровождается сильными физическими болями, судорогами, повышенной тревожностью, бессонницей и эмоциональными перепадами, что может привести к серьезным осложнениям для здоровья. Наркологическая клиника «Здравица» в Ростове-на-Дону предлагает комплексное лечение абстинентного синдрома, используя передовые методики и индивидуальный подход для быстрого восстановления здоровья.
Получить больше информации – https://snyatie-lomki-rnd77.ru/snyatie-lomki-na-domu-v-rnd/
Круглосуточная помощь
Подробнее – врача капельницу от запоя
В «Гелиосе» уделяется особое внимание конфиденциальности и психологическому комфорту пациентов. Анонимность процедур и доброжелательная атмосфера способствуют снижению стресса и улучшению результатов лечения.
Подробнее – наркологическая клиника стационар
Для понимания ключевых компонентов лечения ниже представлена таблица, в которой систематизированы основные методы и их назначение.
Выяснить больше – http://narkologicheskaya-pomoshh-novokuzneczk0.ru
Лечение наркомании в клинике начинается с диагностики, позволяющей определить степень зависимости, выявить сопутствующие заболевания и выбрать оптимальную тактику терапии. Важным этапом является детоксикация — очищение организма от токсинов и продуктов распада наркотических веществ, что снижает риск осложнений и облегчает последующее восстановление.
Получить больше информации – лечение наркомании реабилитация тверь
Запой — это состояние, при котором человек на протяжении нескольких дней или недель регулярно употребляет алкоголь, теряя контроль над собой. При этом организм накапливает этанол и его токсичные метаболиты, печень и сердце работают на износ, нарушается сон, развивается психоэмоциональная нестабильность. Главный риск — абстинентный синдром, который может проявляться тремором, судорогами, повышением давления, паникой и даже галлюцинациями.
Получить дополнительные сведения – https://vyvod-iz-zapoya-v-himki1.ru/narkolog-vyvod-iz-zapoya-v-himkah/
Круглосуточная помощь
Детальнее – выезд на дом капельница от запоя краснодар
Преимущество
Подробнее – vyvod-iz-zapoya-czena sochi
Абстинентный синдром, или ломка, — одно из наиболее тяжелых состояний, возникающих у зависимого человека после прекращения употребления наркотиков или алкоголя. Это состояние сопровождается физическими и психическими симптомами, которые становятся практически невыносимыми для пациента и могут привести к серьезным осложнениям без квалифицированной медицинской помощи. Наркологическая клиника «Рестарт» в Ростове-на-Дону специализируется на эффективном и безопасном снятии ломки, предлагая комплексный подход и индивидуальное лечение, направленное на быстрое облегчение состояния и восстановление организма пациента.
Получить дополнительные сведения – снятие ломок
В случаях запоя, острого отравления или абстинентного синдрома выездная наркологическая бригада оказывает помощь прямо на месте. Специалисты приезжают в течение 30 минут после обращения и проводят оценку состояния пациента, экстренное введение лекарств, инфузионную терапию и психологическую поддержку. Благодаря специальной комплектации мобильной бригады, лечение на дому возможно даже при умеренной степени осложнений. Врач также может при необходимости провести экспресс-анализы и дать рекомендации родственникам по дальнейшему уходу.
Выяснить больше – http://narkologicheskaya-klinika-novokuzneczk0.ru
Анонимная помощь при запое — врачи «Alco.Rehab» (Москва) приедут к вам в течение часа.
Подробнее можно узнать тут – вывод из запоя капельница в москве
Нужен срочный вывод из запоя в Королёве? Обратитесь в Narcology Clinic. Опытные врачи приедут на дом, проведут детоксикацию и поддержат пациента на этапе восстановления. Помощь доступна круглосуточно и анонимно.
Ознакомиться с деталями – вывод из запоя клиника город Королев
Клиника «НаркоМед» в Екатеринбурге предоставляет полный спектр наркологической помощи круглосуточно и анонимно. Благодаря мобильным бригадам и выездам на дом, пациенты получают профессиональное лечение прямо в комфортной обстановке, без стресса, связанного с госпитализацией. В статье подробно рассматриваются услуги клиники, этапы терапии и ключевые преимущества обращения в «НаркоМед».
Ознакомиться с деталями – http://
Все обращения в клинику «РеабКузбасс» обрабатываются в рамках строгой анонимности. Пациент может проходить лечение без паспорта, под вымышленным именем, если это важно для психологического комфорта. Ни одна медицинская процедура или консультация не фиксируется в государственных базах без согласия. Персонал подписывает документы о неразглашении. Также предлагается анонимная оплата и оформление без упоминания диагноза в документах. При необходимости пациент может получить справку с нейтральной формулировкой для работы или страховой компании.
Ознакомиться с деталями – лечение наркомании цена
Самостоятельно выйти из запоя сложно и опасно. В Narcology Clinic (Королёв) вам помогут вернуться в трезвое состояние без боли, страха и последствий. Эффективный и безопасный метод с возможностью круглосуточного выезда.
Получить дополнительную информацию – вывод из запоя на дому круглосуточно город Королев
Для оказания полноценной помощи вне стен клиники специалисты «ТверьМед» используют портативные устройства: инфузоматы, ЭКГ-мониторы, глюкометры, пульсоксиметры, небулайзеры и наборы медикаментов. Все врачи обучены работе в полевых условиях и готовы к экстренным ситуациям. Отдельное внимание уделяется стерильности и безопасности: используются одноразовые расходники, врач носит маску, перчатки и защитный халат. При необходимости на выезд направляется параллельно медсестра или ассистент с расширенным функционалом.
Ознакомиться с деталями – https://narkologicheskaya-pomoshh-tver0.ru/
— Растворы с глюкозой и витаминами для коррекции энергетического обмена. — Минеральные комплексы для нормализации электролитов. — Антиоксиданты и гепатопротекторы для защиты печени. — Спазмолитики для снятия болевого синдрома. — Противорвотные препараты при тошноте.
Узнать больше – наркологическая клиника цены архангельск
Абстинентный синдром развивается после прекращения приёма наркотических веществ или алкоголя, и сопровождается комплексом тяжёлых симптомов:
Детальнее – http://snyatie-lomki-rnd7.ru/snyatie-lomki-narkomana-v-rnd/https://snyatie-lomki-rnd7.ru
Сделайте первый шаг к трезвости. Круглосуточный вывод из запоя в Москве от «Alco.Rehab» — безопасно, надёжно, профессионально.
Углубиться в тему – московская область
После прибытия на место врач проводит тщательное обследование пациента. Измеряются основные физиологические параметры — артериальное давление, частота пульса, сатурация кислорода, температура тела. Проводится экспресс-анализ крови на сахар и кислотно-щелочной баланс. Также врач проводит оценку неврологического и психического статуса пациента, проверяет уровень сознания по шкале Глазго, выявляет признаки возможных осложнений: отёка мозга, энцефалопатии, алкогольного делирия. При необходимости принимается решение о дополнительной поддержке (например, вызов реанимационной бригады или немедленный перевод в стационар).
Подробнее – https://narkologicheskaya-pomoshh-novosibirsk0.ru/
Сделайте первый шаг к трезвости. Круглосуточный вывод из запоя в Москве от «Alco.Rehab» — безопасно, надёжно, профессионально.
Получить дополнительную информацию – вывод из запоя цена
Своевременная установка капельницы поможет быстро восстановить организм и избежать развития тяжёлых осложнений.
Разобраться лучше – врача капельницу от запоя краснодар
20
Подробнее можно узнать тут – москва.
В «Гелиосе» уделяется особое внимание конфиденциальности и психологическому комфорту пациентов. Анонимность процедур и доброжелательная атмосфера способствуют снижению стресса и улучшению результатов лечения.
Подробнее тут – наркологическая клиника вывод из запоя тверь
Раннее обращение к специалистам позволяет провести качественную диагностику, подобрать адекватное лечение и обеспечить комплексную поддержку пациента.
Получить дополнительные сведения – платная наркологическая помощь новокузнецк
После детоксикации пациенту назначается медикаментозная терапия, направленная на стабилизацию работы нервной системы и снижение тяги к наркотикам. Медикаменты подбираются индивидуально, учитывая особенности состояния каждого пациента.
Ознакомиться с деталями – лечение наркомании цена в твери
Преимущество
Ознакомиться с деталями – https://snyatie-lomki-rnd7.ru
Обращение к специалистам становится необходимым, если наблюдаются следующие симптомы, указывающие на тяжелую интоксикацию:
Исследовать вопрос подробнее – http://vyvod-iz-zapoya-sochi777.ru/
Второй важный этап лечения — назначение лекарственных средств, направленных на нормализацию работы нервной системы, снижение симптомов абстиненции и профилактику срывов. Применение медикаментов подбирается индивидуально с учётом типа зависимости и общего состояния пациента.
Подробнее можно узнать тут – лечение наркомании на дому
20
Исследовать вопрос подробнее – http://vyvod-iz-zapoya-korolev12.ru/
Сделайте первый шаг к трезвости с профессиональной помощью. В Narcology Clinic (г. Королёв) осуществляют вывод из запоя на дому и в клинике. Индивидуальный подход, анонимность, сопровождение пациента и семьи на всех этапах.
Выяснить больше – вывод из запоя московская область
Современная наркологическая клиника — это не просто учреждение для экстренной помощи, а центр комплексной поддержки человека, столкнувшегося с зависимостью. В «КузбассМед» в Новокузнецке реализуется модель интенсивного вмешательства, где используются новейшие медицинские технологии, мультидисциплинарный подход и мобильные выездные службы. Специалисты готовы прибыть на дом за 30 минут с полным набором оборудования и медикаментов, обеспечив пациенту помощь в привычной и безопасной среде. Наркология здесь строится на индивидуализации: каждый случай рассматривается отдельно, с учётом психофизического состояния, анамнеза и жизненного контекста пациента.
Выяснить больше – http://narkologicheskaya-klinika-novokuzneczk0.ru/narkolog-novokuzneczk-na-dom/
Каждый пациент получает персонализированный план лечения, разработанный с учётом анамнеза, общего состояния и психоэмоционального фона. В «ПермьМедСервис» нет универсальных шаблонов — используется модульная модель терапии, при которой программы состоят из комбинированных блоков: медикаментозное лечение, психотерапия, физиотерапия, семейное консультирование. Это позволяет гибко адаптировать курс, вносить изменения по ходу лечения и учитывать динамику состояния пациента.
Получить дополнительные сведения – вывод наркологическая клиника
Круглосуточная помощь
Разобраться лучше – https://kapelnica-ot-zapoya-krasnodar777.ru/kapelnicza-ot-zapoya-czena-v-krasnodare
Надёжный способ прервать запой — услуги клиники «Alco.Rehab» в Москве. Профессиональный подход и анонимность гарантированы.
Подробнее – нарколог вывод из запоя в москве
После прохождения основной программы пациенту предлагается поддерживающее наблюдение. Оно может включать дистанционные консультации, участие в группе профилактики срывов, повторные осмотры нарколога и психолога, корректировку медикаментозной схемы. В рамках реабилитации формируются планы действий при возникновении тяги, обучаются навыки сопротивления стрессу и внешнему давлению. При желании можно подключить родственников к процессу постлечебной адаптации, чтобы укрепить результат и снизить риски рецидивов. Таким образом, пациент не остаётся один даже после выписки.
Изучить вопрос глубже – https://lechenie-narkomanii-novokuzneczk0.ru/reabilitacziya-narkomana-novokuzneczk/
Помощь врача-нарколога становится жизненно важной, когда симптомы абстинентного синдрома становятся невыносимыми и угрожают жизни пациента. К числу основных признаков, требующих срочного вмешательства, относятся:
Узнать больше – снятие наркотической ломки
Капельница от запоя в Краснодаре рекомендуется при первых признаках алкогольной интоксикации или тяжелого похмелья. Без своевременного медицинского вмешательства состояние человека может резко ухудшиться, привести к развитию осложнений и даже стать угрозой для жизни. Срочная помощь необходима в таких случаях:
Узнать больше – капельница от запоя недорого краснодар
Для пациентов, требующих круглосуточного наблюдения, клиника «Полярис» предлагает стационар VIP-класса. Здесь созданы все условия для быстрого восстановления: удобные палаты, индивидуальное меню, зоны отдыха и консультации профильных специалистов.
Ознакомиться с деталями – наркологическая клиника архангельск.
Игнорирование этих признаков приводит к резкому ухудшению здоровья и тяжелым последствиям, которые можно предотвратить своевременным обращением к специалисту.
Подробнее можно узнать тут – вызвать капельницу от запоя в краснодаре
Для оказания полноценной помощи вне стен клиники специалисты «ТверьМед» используют портативные устройства: инфузоматы, ЭКГ-мониторы, глюкометры, пульсоксиметры, небулайзеры и наборы медикаментов. Все врачи обучены работе в полевых условиях и готовы к экстренным ситуациям. Отдельное внимание уделяется стерильности и безопасности: используются одноразовые расходники, врач носит маску, перчатки и защитный халат. При необходимости на выезд направляется параллельно медсестра или ассистент с расширенным функционалом.
Исследовать вопрос подробнее – скорая наркологическая помощь в твери
Преимущество
Узнать больше – снятие наркологической ломки на дому краснодар
Оперативное вмешательство позволяет быстро начать детоксикацию и предотвратить развитие опасных осложнений.
Выяснить больше – http://vyvod-iz-zapoya-sochi777.ru
20
Выяснить больше – срочный вывод из запоя
После завершения основной инфузионной терапии врач наблюдает за состоянием пациента ещё в течение 30–60 минут. Если отсутствуют осложнения и параметры стабилизированы, врач даёт рекомендации по дальнейшему восстановлению, включая приём анксиолитиков, соблюдение питьевого режима, лёгкой диеты и исключение стрессов. Также составляется индивидуальный план наблюдения: возможны повторные визиты врача через сутки, двое или трое суток. При необходимости пациенту или его близким предоставляется контакт психотерапевта или проводится предварительное консультирование по дальнейшему лечению зависимости.
Подробнее – вызвать наркологическую помощь в новосибирске
Запой — состояние, характеризующееся неконтролируемым и продолжительным употреблением алкоголя, что вызывает сильную интоксикацию организма и нарушения в работе жизненно важных органов. При длительном запое организм испытывает колоссальную нагрузку, страдает сердечно-сосудистая система, печень, почки, а нервная система работает на пределе. Одним из наиболее эффективных методов быстрого и безопасного выхода из запоя является капельница. Наркологическая клиника «Анти-Кризис» в Краснодаре оказывает срочную помощь и вывод из запоя за 24 часа, обеспечивая индивидуальный подход, полную анонимность и доступные цены.
Детальнее – https://kapelnica-ot-zapoya-krasnodar777.ru/kapelnicza-ot-zapoya-czena-v-krasnodare/
Зависимость разрушает семью? Не медлите — обратитесь в московский центр «Alco.Rehab» за квалифицированной помощью.
Выяснить больше – вывод из запоя на дому цена город москва
20
Детальнее – vyvod-iz-zapoya gorod korolev
Вывод из запоя в Королёве от Narcology Clinic — квалифицированная помощь на дому и в клинике. Индивидуальный подбор препаратов, поддержка психики и организма, круглосуточный приём и сопровождение пациента.
Разобраться лучше – вывод из запоя клиника в королеве
Психологическая поддержка играет ключевую роль в лечении наркомании в Твери. В клинике «Ренессанс» применяются различные методы психотерапии, включая когнитивно-поведенческую терапию, групповые и семейные сессии, арт-терапию. Эти методы помогают осознать причины зависимости, развить навыки преодоления стрессов и поддержать мотивацию к выздоровлению.
Подробнее тут – лечение наркомании наркология в твери
Наркологическая клиника в Твери обеспечивает круглосуточное медицинское наблюдение, что позволяет своевременно выявлять и устранять возможные осложнения. Высококвалифицированные специалисты проводят регулярные обследования и корректируют терапию, обеспечивая безопасность и эффективность лечения.
Углубиться в тему – https://narkologicheskaya-klinika-tver0.ru/
В клинике «Альтернатива» применяются современные методы терапии, включающие медикаментозное лечение, психотерапию и социальную реабилитацию.
Узнать больше – http://narkologicheskaya-pomoshh-novokuzneczk0.ru/
Описание
Изучить вопрос глубже – снятие ломки на дому цена краснодар
Одним из ключевых преимуществ «КузбассМед» является современная материально-техническая база. В клинике задействованы устройства для точного мониторинга жизненных функций, автоматические инфузионные системы, экспресс-диагностические модули и оборудование для неотложной терапии. Врачи используют программируемые дозаторы, портативные анализаторы крови и аппараты для оценки дыхательной функции, что позволяет своевременно корректировать тактику лечения без потерь времени. Все процедуры соответствуют национальным стандартам безопасности и рекомендациям ВОЗ.
Подробнее можно узнать тут – https://narkologicheskaya-klinika-novokuzneczk0.ru/narkolog-v-gorode-novokuzneczke
После прохождения основной программы пациенту предлагается поддерживающее наблюдение. Оно может включать дистанционные консультации, участие в группе профилактики срывов, повторные осмотры нарколога и психолога, корректировку медикаментозной схемы. В рамках реабилитации формируются планы действий при возникновении тяги, обучаются навыки сопротивления стрессу и внешнему давлению. При желании можно подключить родственников к процессу постлечебной адаптации, чтобы укрепить результат и снизить риски рецидивов. Таким образом, пациент не остаётся один даже после выписки.
Изучить вопрос глубже – наркологическое лечение наркомания
Запой — состояние, характеризующееся неконтролируемым и продолжительным употреблением алкоголя, что вызывает сильную интоксикацию организма и нарушения в работе жизненно важных органов. При длительном запое организм испытывает колоссальную нагрузку, страдает сердечно-сосудистая система, печень, почки, а нервная система работает на пределе. Одним из наиболее эффективных методов быстрого и безопасного выхода из запоя является капельница. Наркологическая клиника «Анти-Кризис» в Краснодаре оказывает срочную помощь и вывод из запоя за 24 часа, обеспечивая индивидуальный подход, полную анонимность и доступные цены.
Получить дополнительную информацию – сколько стоит капельница от запоя краснодар
Описание
Разобраться лучше – https://snyatie-lomki-rnd7.ru/snyatie-lomki-na-domu-v-rnd/
Анонимная помощь при запое — врачи «Alco.Rehab» (Москва) приедут к вам в течение часа.
Изучить вопрос глубже – https://https://vyvod-iz-zapoya-moskva11.ru/
— Растворы с глюкозой и витаминами для коррекции энергетического обмена. — Минеральные комплексы для нормализации электролитов. — Антиоксиданты и гепатопротекторы для защиты печени. — Спазмолитики для снятия болевого синдрома. — Противорвотные препараты при тошноте.
Подробнее – бесплатная наркологическая клиника в архангельске
Клиника «Доктор Трезвость» в Сочи предлагает современное лечение запоя, основанное на комплексном подходе и индивидуальной программе для каждого пациента. Наши лицензированные специалисты используют передовые методы терапии, что позволяет достичь быстрого и безопасного вывода из запоя, а также создать надежную основу для дальнейшей реабилитации.
Подробнее тут – http://vyvod-iz-zapoya-sochi777.ru
Одним из ключевых факторов успешного лечения наркомании является психотерапия. В клинике «Сибирский Доктор» применяются различные методы психотерапии, включая когнитивно-поведенческую терапию, групповые и индивидуальные занятия, которые помогают пациентам осознать причины зависимости, научиться справляться с эмоциональными и психологическими трудностями.
Получить больше информации – центр анонимного лечения наркомании
В клинике Narcology Clinic (Королёв) вывод из запоя проводится по современным протоколам. Медикаментозная капельница, восстановление сна и давления, сопровождение до полной стабилизации. Безопасная и безосуждающая помощь.
Разобраться лучше – наркологический вывод из запоя в королеве
Да, клиника работает в закрытом формате. Пациент вправе отказаться от передачи данных третьим лицам, а документы оформляются без указания диагноза.
Узнать больше – наркологическая клиника вывод из запоя
Если близкий оказался в запое — не откладывайте помощь. В Королёве специалисты Narcology Clinic предлагают срочный и безопасный вывод из запоя с выездом на дом или в стационаре. Анонимно и с гарантией результата.
Ознакомиться с деталями – срочный вывод из запоя в королеве
«ТверьМед» — частная лицензированная клиника, специализирующаяся на наркологической помощи любой степени сложности. Здесь работают неравнодушные врачи-наркологи, психиатры, терапевты и психологи с многолетним стажем. Медицинская команда настроена на оперативную диагностику и проведение первичных мероприятий в течение первого часа после обращения. Упор сделан на доступность: клиника открыта 24/7, приём возможен как на территории медучреждения, так и на выезде — дома, в офисе, гостинице, санатории или любом удобном месте.
Исследовать вопрос подробнее – платная наркологическая скорая помощь в твери
Обращение за наркологической помощью на дом целесообразно в самых разных ситуациях. Запой, продолжающийся более двух суток, особенно у людей старше 40 лет, может спровоцировать резкое ухудшение самочувствия и развитие тяжёлых осложнений. При выраженной алкогольной или наркотической интоксикации, сопровождающейся тошнотой, рвотой, тахикардией, головокружением и нарушением координации, крайне важно не оставлять пациента без квалифицированного медицинского наблюдения. Также обращение за домашней помощью актуально при отказе пациента от стационара, наличии хронических заболеваний, невозможности оставить семью или работу, а также при первичных признаках срыва на фоне ремиссии. Дополнительно выезд на дом позволяет обеспечить анонимность, исключить психоэмоциональную нагрузку, связанную с пребыванием в больнице, и сохранить привычный уклад жизни.
Углубиться в тему – оказание наркологической помощи новосибирск
Преимущество
Углубиться в тему – https://kapelnica-ot-zapoya-krasnodar777.ru/kapelnicza-ot-zapoya-czena-v-krasnodare/
Нужна срочная помощь? Центр «Alco.Rehab» в Москве предлагает круглосуточный вывод из запоя с выездом на дом.
Выяснить больше – вывод из запоя на дому московская область
Клиника «Здравица» в Ростове-на-Дону предлагает современный комплексный подход к лечению абстинентного синдрома. Наши пациенты получают помощь от высококвалифицированных специалистов, которые используют передовые методики и индивидуально подбирают программу лечения для каждого. Среди ключевых преимуществ клиники «Здравица» можно выделить:
Подробнее – https://snyatie-lomki-rnd77.ru/snyatie-lomki-narkomana-v-rnd/
Надёжный способ прервать запой — услуги клиники «Alco.Rehab» в Москве. Профессиональный подход и анонимность гарантированы.
Подробнее тут – вывод из запоя клиника в москве
Для понимания ключевых компонентов лечения ниже представлена таблица, в которой систематизированы основные методы и их назначение.
Углубиться в тему – https://narkologicheskaya-pomoshh-novokuzneczk0.ru/narkologicheskaya-klinika-novokuzneczk/
В «Гелиосе» уделяется особое внимание конфиденциальности и психологическому комфорту пациентов. Анонимность процедур и доброжелательная атмосфера способствуют снижению стресса и улучшению результатов лечения.
Получить дополнительную информацию – http://
Лечение наркомании в Твери представляет собой сложный и многоэтапный процесс, направленный на полное восстановление здоровья и социальной адаптации пациентов, страдающих от зависимости. В наркологической клинике «Ренессанс» применяется комплексный подход, который учитывает как физиологические, так и психологические аспекты заболевания, что обеспечивает максимальную эффективность терапии.
Подробнее тут – http://lechenie-narkomanii-tver0.ru/lechenie-zavisimosti-ot-narkotikov-v-tveri/
Наша наркологическая клиника успешно помогает пациентам с различной степенью алкогольной зависимости. Преимущества клиники «Перспектива» представлены в таблице ниже:
Получить дополнительную информацию – врач на дом капельница от запоя
Современная наркологическая клиника — это не просто учреждение для экстренной помощи, а центр комплексной поддержки человека, столкнувшегося с зависимостью. В «КузбассМед» в Новокузнецке реализуется модель интенсивного вмешательства, где используются новейшие медицинские технологии, мультидисциплинарный подход и мобильные выездные службы. Специалисты готовы прибыть на дом за 30 минут с полным набором оборудования и медикаментов, обеспечив пациенту помощь в привычной и безопасной среде. Наркология здесь строится на индивидуализации: каждый случай рассматривается отдельно, с учётом психофизического состояния, анамнеза и жизненного контекста пациента.
Получить больше информации – анонимная наркологическая клиника в новокузнецке
Длительный запой – это опасное состояние, при котором организм не успевает вывести токсины алкоголя, что приводит к серьезной интоксикации и нарушению работы жизненно важных органов. Без своевременного вмешательства риск развития осложнений существенно возрастает. Наркологическая клиника «Доктор Трезвость» в Сочи предлагает комплексную поддержку и профессиональное лечение запоя, используя передовые методы терапии и индивидуальный подход для скорейшего восстановления здоровья пациента.
Исследовать вопрос подробнее – вывод из запоя цена сочи.
После прохождения основной программы пациенту предлагается поддерживающее наблюдение. Оно может включать дистанционные консультации, участие в группе профилактики срывов, повторные осмотры нарколога и психолога, корректировку медикаментозной схемы. В рамках реабилитации формируются планы действий при возникновении тяги, обучаются навыки сопротивления стрессу и внешнему давлению. При желании можно подключить родственников к процессу постлечебной адаптации, чтобы укрепить результат и снизить риски рецидивов. Таким образом, пациент не остаётся один даже после выписки.
Выяснить больше – http://lechenie-narkomanii-novokuzneczk0.ru
Если близкий оказался в запое — не откладывайте помощь. В Королёве специалисты Narcology Clinic предлагают срочный и безопасный вывод из запоя с выездом на дом или в стационаре. Анонимно и с гарантией результата.
Получить дополнительные сведения – наркология вывод из запоя в королеве
Запой — тревожный сигнал для семьи. В Narcology Clinic (Королёв) предлагают срочную помощь: вывод из запоя в домашних условиях или в стационаре, медикаментозная поддержка и контроль состояния. Конфиденциально и эффективно.
Подробнее тут – вывод из запоя на дому цена в королеве
Запой — состояние, характеризующееся неконтролируемым и продолжительным употреблением алкоголя, что вызывает сильную интоксикацию организма и нарушения в работе жизненно важных органов. При длительном запое организм испытывает колоссальную нагрузку, страдает сердечно-сосудистая система, печень, почки, а нервная система работает на пределе. Одним из наиболее эффективных методов быстрого и безопасного выхода из запоя является капельница. Наркологическая клиника «Анти-Кризис» в Краснодаре оказывает срочную помощь и вывод из запоя за 24 часа, обеспечивая индивидуальный подход, полную анонимность и доступные цены.
Подробнее – http://kapelnica-ot-zapoya-krasnodar777.ru
Преимущество
Подробнее можно узнать тут – http://snyatie-lomki-rnd7.ru
Вывод из запоя без стресса — специалисты клиники «Alco.Rehab» в Москве знают, как помочь быстро и безопасно.
Углубиться в тему – московская область
Для пациентов, требующих круглосуточного наблюдения, клиника «Полярис» предлагает стационар VIP-класса. Здесь созданы все условия для быстрого восстановления: удобные палаты, индивидуальное меню, зоны отдыха и консультации профильных специалистов.
Узнать больше – наркологическая клиника архангельская область
После завершения основной инфузионной терапии врач наблюдает за состоянием пациента ещё в течение 30–60 минут. Если отсутствуют осложнения и параметры стабилизированы, врач даёт рекомендации по дальнейшему восстановлению, включая приём анксиолитиков, соблюдение питьевого режима, лёгкой диеты и исключение стрессов. Также составляется индивидуальный план наблюдения: возможны повторные визиты врача через сутки, двое или трое суток. При необходимости пациенту или его близким предоставляется контакт психотерапевта или проводится предварительное консультирование по дальнейшему лечению зависимости.
Ознакомиться с деталями – https://narkologicheskaya-pomoshh-novosibirsk0.ru/narkologiya-novosibirsk-kruglosutochno/
Диагностика в клинике «КузбассМед» проводится комплексно: используются лабораторные, инструментальные и психологические методы. Благодаря применению цифровых систем и алгоритмов обработки данных, результаты анализов доступны уже в течение первого часа. Оценка проводится по нескольким направлениям: токсикологический статус, состояние печени и почек, электролитный баланс, нейровегетативное состояние, когнитивные функции и уровень стресса. Это позволяет врачам составлять максимально точную картину заболевания и подбирать индивидуальные методы терапии.
Узнать больше – платная наркологическая клиника в новокузнецке
В основе работы наркологической клиники лежит комплексный подход, включающий медицинскую детоксикацию, психотерапевтическую поддержку и социальную реабилитацию. Такой подход позволяет не только снять острые симптомы интоксикации, но и сформировать устойчивую мотивацию к трезвому образу жизни.
Подробнее можно узнать тут – https://narkologicheskaya-klinika-tver0.ru/
Круглосуточная помощь
Подробнее – вызвать капельницу от запоя
Во многих случаях пациент или его родственники не решаются сразу вызвать врача. Для таких ситуаций предусмотрена услуга онлайн-консультации. Она проводится через защищённую видеосвязь, при желании — анонимно. На связи — врач-нарколог или психиатр, который отвечает на вопросы, оценивает ситуацию по визуальным и вербальным признакам, рекомендует план действий. Консультация может стать отправной точкой для дальнейшего вызова врача на дом или записи в клинику. Это особенно удобно для родственников, которые не знают, как подступиться к проблеме и убедить человека в необходимости помощи.
Выяснить больше – http://narkologicheskaya-pomoshh-tver0.ru
Метод лечения
Подробнее – http://narkologicheskaya-pomoshh-novokuzneczk0.ru
20
Изучить вопрос глубже – срочный вывод из запоя
Длительный запой – это опасное состояние, при котором организм не успевает вывести токсины алкоголя, что приводит к серьезной интоксикации и нарушению работы жизненно важных органов. Без своевременного вмешательства риск развития осложнений существенно возрастает. Наркологическая клиника «Доктор Трезвость» в Сочи предлагает комплексную поддержку и профессиональное лечение запоя, используя передовые методы терапии и индивидуальный подход для скорейшего восстановления здоровья пациента.
Детальнее – http://www.domen.ru
Зависимость разрушает семью? Не медлите — обратитесь в московский центр «Alco.Rehab» за квалифицированной помощью.
Узнать больше – вывод из запоя на дому московская область
В клинике Narcology Clinic (Королёв) вывод из запоя проводится по современным протоколам. Медикаментозная капельница, восстановление сна и давления, сопровождение до полной стабилизации. Безопасная и безосуждающая помощь.
Выяснить больше – наркология вывод из запоя в королеве
Сделайте первый шаг к трезвости с профессиональной помощью. В Narcology Clinic (г. Королёв) осуществляют вывод из запоя на дому и в клинике. Индивидуальный подход, анонимность, сопровождение пациента и семьи на всех этапах.
Углубиться в тему – вывод из запоя на дому круглосуточно в королеве
Второй важный этап лечения — назначение лекарственных средств, направленных на нормализацию работы нервной системы, снижение симптомов абстиненции и профилактику срывов. Применение медикаментов подбирается индивидуально с учётом типа зависимости и общего состояния пациента.
Выяснить больше – http://lechenie-narkomanii-novosibirsk0.ru/novosibirsk-lechenie-narkozavisimosti/
Каждый пациент получает персонализированный план лечения, разработанный с учётом анамнеза, общего состояния и психоэмоционального фона. В «ПермьМедСервис» нет универсальных шаблонов — используется модульная модель терапии, при которой программы состоят из комбинированных блоков: медикаментозное лечение, психотерапия, физиотерапия, семейное консультирование. Это позволяет гибко адаптировать курс, вносить изменения по ходу лечения и учитывать динамику состояния пациента.
Разобраться лучше – http://narkologicheskaya-klinika-perm0.ru/perm-narkologicheskij-dispanser/https://narkologicheskaya-klinika-perm0.ru
После прохождения основной программы пациенту предлагается поддерживающее наблюдение. Оно может включать дистанционные консультации, участие в группе профилактики срывов, повторные осмотры нарколога и психолога, корректировку медикаментозной схемы. В рамках реабилитации формируются планы действий при возникновении тяги, обучаются навыки сопротивления стрессу и внешнему давлению. При желании можно подключить родственников к процессу постлечебной адаптации, чтобы укрепить результат и снизить риски рецидивов. Таким образом, пациент не остаётся один даже после выписки.
Подробнее можно узнать тут – лечение наркомании кодирование новокузнецк
Описание
Исследовать вопрос подробнее – снятие ломки цена в краснодаре
После поступления вызова диспетчер передаёт заявку на смартфон врача, который оперативно завершает подготовительные мероприятия и выезжает к пациенту. На дороге применяется GPS-маршрутизация для выбора оптимального пути и снижения времени в пути.
Выяснить больше – наркологические клиники алкоголизм архангельск
Процедура капельницы назначается врачом-наркологом в ситуациях, когда состояние пациента становится критическим и организм нуждается в немедленном очищении от токсинов. Рекомендуется обратиться за срочной медицинской помощью, если отмечаются следующие признаки:
Получить больше информации – капельница от запоя на дому недорого в краснодаре
Сделайте первый шаг к трезвости с профессиональной помощью. В Narcology Clinic (г. Королёв) осуществляют вывод из запоя на дому и в клинике. Индивидуальный подход, анонимность, сопровождение пациента и семьи на всех этапах.
Получить дополнительные сведения – вывод из запоя круглосуточно
Нужен срочный вывод из запоя в Королёве? Обратитесь в Narcology Clinic. Опытные врачи приедут на дом, проведут детоксикацию и поддержат пациента на этапе восстановления. Помощь доступна круглосуточно и анонимно.
Получить больше информации – вывод из запоя на дому город Королев
Преимущество
Детальнее – вывод из запоя на дому сочи.
Абстинентный синдром развивается после прекращения приёма наркотических веществ или алкоголя, и сопровождается комплексом тяжёлых симптомов:
Получить дополнительные сведения – снятие ломок на дому в краснодаре
Тем, кто нуждается в длительной терапии, «КузбассМед» предлагает комфортные условия стационара с круглосуточным наблюдением. Здесь пациенты размещаются в индивидуальных палатах, проходят курсы терапии, реабилитации и психокоррекции. Обстановка в клинике напоминает оздоровительный центр: мягкое освещение, тишина, доступ к библиотеке, возможность общения с психологом и ежедневное участие в восстановительных мероприятиях. Медицинские сестры и врачи находятся на дежурстве 24/7, что позволяет немедленно реагировать на любые изменения в состоянии пациента.
Изучить вопрос глубже – анонимная наркологическая клиника новокузнецк
20
Углубиться в тему – вывод из запоя на дому цена город Королев
Наркологическая клиника в Твери обеспечивает круглосуточное медицинское наблюдение, что позволяет своевременно выявлять и устранять возможные осложнения. Высококвалифицированные специалисты проводят регулярные обследования и корректируют терапию, обеспечивая безопасность и эффективность лечения.
Выяснить больше – наркологическая клиника клиника помощь в твери
После прибытия на место врач проводит тщательное обследование пациента. Измеряются основные физиологические параметры — артериальное давление, частота пульса, сатурация кислорода, температура тела. Проводится экспресс-анализ крови на сахар и кислотно-щелочной баланс. Также врач проводит оценку неврологического и психического статуса пациента, проверяет уровень сознания по шкале Глазго, выявляет признаки возможных осложнений: отёка мозга, энцефалопатии, алкогольного делирия. При необходимости принимается решение о дополнительной поддержке (например, вызов реанимационной бригады или немедленный перевод в стационар).
Углубиться в тему – http://narkologicheskaya-pomoshh-novosibirsk0.ru/narkologicheskaya-pomoshh-na-domu-novosibirsk/
Постановка капельницы от запоя специалистами клиники «Пульс» в Воронеже обеспечивает пациентам оперативную помощь и быстрое облегчение состояния благодаря экстренному выезду врача на дом. Наши услуги доступны круглосуточно, включая ночное время и праздничные дни, что особенно важно при внезапных и критических ситуациях. Мы гарантируем полную конфиденциальность и защиту персональных данных пациентов, что позволяет получить необходимую помощь без риска огласки. Индивидуальный подход к каждому случаю обеспечивает максимальную эффективность лечения, а наши опытные наркологи используют только сертифицированные препараты, которые безопасно и быстро выводят токсины и стабилизируют состояние здоровья. Прозрачность ценообразования, предварительное согласование всех расходов и отсутствие скрытых доплат делают услуги клиники «Пульс» удобными и доступными для всех жителей Воронежа.
Изучить вопрос глубже – капельница от запоя анонимно на дому в краснодаре
20
Получить дополнительные сведения – москва.
«ТверьМед» — частная лицензированная клиника, специализирующаяся на наркологической помощи любой степени сложности. Здесь работают неравнодушные врачи-наркологи, психиатры, терапевты и психологи с многолетним стажем. Медицинская команда настроена на оперативную диагностику и проведение первичных мероприятий в течение первого часа после обращения. Упор сделан на доступность: клиника открыта 24/7, приём возможен как на территории медучреждения, так и на выезде — дома, в офисе, гостинице, санатории или любом удобном месте.
Подробнее тут – скорая наркологическая помощь в твери
Анонимная помощь при запое — врачи «Alco.Rehab» (Москва) приедут к вам в течение часа.
Подробнее – vyvod-iz-zapoya gorod moskva
Для понимания ключевых компонентов лечения ниже представлена таблица, в которой систематизированы основные методы и их назначение.
Подробнее тут – http://narkologicheskaya-pomoshh-novokuzneczk0.ru/
Наркозависимость — это не просто вредная привычка, а тяжёлое хроническое заболевание, требующее комплексного и последовательного лечения. В клинике «РеабКузбасс» в Новокузнецке разработаны персонализированные программы помощи, учитывающие медицинские, психологические и социальные аспекты проблемы. Каждому пациенту подбирается уникальный маршрут восстановления, начиная с первичной диагностики и заканчивая адаптацией к жизни без наркотиков. Поддержка оказывается круглосуточно, с полным соблюдением конфиденциальности. Психотерапевты и врачи работают в тесной связке, чтобы не только устранить физическую зависимость, но и восстановить личность пациента, вернуть ему мотивацию к жизни и уверенность в будущем.
Выяснить больше – http://lechenie-narkomanii-novokuzneczk0.ru/lechenie-zavisimosti-ot-narkotikov-novokuzneczk/
Самостоятельно выйти из запоя сложно и опасно. В Narcology Clinic (Королёв) вам помогут вернуться в трезвое состояние без боли, страха и последствий. Эффективный и безопасный метод с возможностью круглосуточного выезда.
Подробнее тут – срочный вывод из запоя город Королев
Сделайте первый шаг к трезвости с профессиональной помощью. В Narcology Clinic (г. Королёв) осуществляют вывод из запоя на дому и в клинике. Индивидуальный подход, анонимность, сопровождение пациента и семьи на всех этапах.
Разобраться лучше – вывод из запоя на дому цена город Королев
После поступления вызова диспетчер передаёт заявку на смартфон врача, который оперативно завершает подготовительные мероприятия и выезжает к пациенту. На дороге применяется GPS-маршрутизация для выбора оптимального пути и снижения времени в пути.
Исследовать вопрос подробнее – https://narkologicheskaya-klinika-arkhangelsk0.ru/platnaya-narkologicheskaya-klinika-arkhangelsk/
Клиника «Доктор Трезвость» в Сочи предлагает современное лечение запоя, основанное на комплексном подходе и индивидуальной программе для каждого пациента. Наши лицензированные специалисты используют передовые методы терапии, что позволяет достичь быстрого и безопасного вывода из запоя, а также создать надежную основу для дальнейшей реабилитации.
Получить дополнительные сведения – срочный вывод из запоя сочи
Самостоятельно выйти из запоя сложно и опасно. В Narcology Clinic (Королёв) вам помогут вернуться в трезвое состояние без боли, страха и последствий. Эффективный и безопасный метод с возможностью круглосуточного выезда.
Узнать больше – наркология вывод из запоя город Королев
Современная наркологическая клиника — это не просто учреждение для экстренной помощи, а центр комплексной поддержки человека, столкнувшегося с зависимостью. В «КузбассМед» в Новокузнецке реализуется модель интенсивного вмешательства, где используются новейшие медицинские технологии, мультидисциплинарный подход и мобильные выездные службы. Специалисты готовы прибыть на дом за 30 минут с полным набором оборудования и медикаментов, обеспечив пациенту помощь в привычной и безопасной среде. Наркология здесь строится на индивидуализации: каждый случай рассматривается отдельно, с учётом психофизического состояния, анамнеза и жизненного контекста пациента.
Узнать больше – запой наркологическая клиника в новокузнецке
Для многих пациентов страх быть поставленным на учёт или потерять работу становится серьёзным барьером на пути к выздоровлению. В «ПермьМедСервис» данные пациента остаются строго внутри клиники: ни в какие внешние базы информация не передаётся. При оформлении документов не указывается диагноз, а возможна подача под псевдонимом. Консультации, процедуры и ведение истории болезни проходят в полностью закрытом режиме. Это позволяет пациенту сосредоточиться на выздоровлении, не опасаясь последствий для своей личной или профессиональной жизни.
Ознакомиться с деталями – http://narkologicheskaya-klinika-perm0.ru
Запой — это опасное состояние, при котором организм человека подвергается сильной алкогольной интоксикации, а внутренние органы, такие как печень, сердце и почки, начинают работать в аварийном режиме. В такой момент самостоятельное лечение становится невозможным, и необходима оперативная помощь специалистов. Наркологическая клиника «Детоксика» в Сочи предлагает комплексный вывод из запоя с использованием современных методов терапии и индивидуального подхода, что позволяет быстро восстановить здоровье пациента и предотвратить серьезные осложнения.
Подробнее – https://vyvod-iz-zapoya-sochi7.ru/vyvod-iz-zapoya-na-domu-v-sochi/
На первом этапе проводится комплексное обследование, позволяющее выявить степень зависимости, определить физическое и психическое состояние пациента, а также выявить сопутствующие заболевания. Это позволяет составить индивидуальный план лечения.
Подробнее можно узнать тут – лечение наркомании на дому новосибирск
Наркологическая клиника в Твери представляет собой современное медицинское учреждение, специализирующееся на диагностике и лечении алкогольной, наркотической и других видов зависимости. В клинике «Гелиос» применяются инновационные методы терапии, направленные на полное восстановление физического и психологического состояния пациентов.
Исследовать вопрос подробнее – http://narkologicheskaya-klinika-tver0.ru
Помощь врача-нарколога становится жизненно важной, когда симптомы абстинентного синдрома становятся невыносимыми и угрожают жизни пациента. К числу основных признаков, требующих срочного вмешательства, относятся:
Подробнее тут – снятие ломки нарколог
После прибытия на место врач проводит тщательное обследование пациента. Измеряются основные физиологические параметры — артериальное давление, частота пульса, сатурация кислорода, температура тела. Проводится экспресс-анализ крови на сахар и кислотно-щелочной баланс. Также врач проводит оценку неврологического и психического статуса пациента, проверяет уровень сознания по шкале Глазго, выявляет признаки возможных осложнений: отёка мозга, энцефалопатии, алкогольного делирия. При необходимости принимается решение о дополнительной поддержке (например, вызов реанимационной бригады или немедленный перевод в стационар).
Выяснить больше – срочная наркологическая помощь в новосибирске
Запой — тяжелое состояние, связанное с длительным и бесконтрольным употреблением алкоголя, когда человек не может самостоятельно остановиться. В результате алкогольной интоксикации страдают внутренние органы, нарушается работа сердечно-сосудистой и нервной систем. Чем дольше длится запой, тем выше риск серьезных осложнений. Капельница от запоя — быстрый и надежный способ вывести человека из опасного состояния, снять симптомы интоксикации и восстановить нормальное самочувствие. В наркологической клинике «Перспектива» в Краснодаре вы можете воспользоваться данной услугой круглосуточно, как в стационаре, так и с выездом врача на дом.
Получить дополнительные сведения – капельница от запоя вызов в краснодаре
Клиника Narcology Clinic в Королёве оказывает профессиональную помощь при запое: выезд нарколога на дом, капельницы, детокс, поддержка круглосуточно. Безопасный вывод из запоя с учётом состояния пациента и полной конфиденциальностью.
Разобраться лучше – наркологический вывод из запоя
Нужна срочная помощь? Центр «Alco.Rehab» в Москве предлагает круглосуточный вывод из запоя с выездом на дом.
Углубиться в тему – вывод из запоя в стационаре город москва
В клинике Narcology Clinic (Королёв) вывод из запоя проводится по современным протоколам. Медикаментозная капельница, восстановление сна и давления, сопровождение до полной стабилизации. Безопасная и безосуждающая помощь.
Подробнее можно узнать тут – срочный вывод из запоя
Преимущество
Разобраться лучше – вывод из запоя на дому сочи
В наркологической клинике «Рестарт» используется комплексный подход к лечению абстинентного синдрома. Наши преимущества:
Разобраться лучше – снятие ломки наркомана краснодар
Во время онлайн-сессии специалист может использовать шкалы оценки состояния (CIWA-Ar, CAGE, AUDIT), психодиагностические опросники, видеоанализ мимики и речи. Это позволяет провести достаточно точную первичную дифференцировку между алкогольной абстиненцией, тревожным расстройством, интоксикацией и психотическим состоянием. При необходимости пациенту предлагается записаться на очный приём или воспользоваться услугой «стационар на дому» — с ежедневными визитами и наблюдением.
Детальнее – наркологическая помощь на дому в твери
Все обращения в клинику «РеабКузбасс» обрабатываются в рамках строгой анонимности. Пациент может проходить лечение без паспорта, под вымышленным именем, если это важно для психологического комфорта. Ни одна медицинская процедура или консультация не фиксируется в государственных базах без согласия. Персонал подписывает документы о неразглашении. Также предлагается анонимная оплата и оформление без упоминания диагноза в документах. При необходимости пациент может получить справку с нейтральной формулировкой для работы или страховой компании.
Разобраться лучше – лечение наркомании и алкоголизма новокузнецк
Надёжный способ прервать запой — услуги клиники «Alco.Rehab» в Москве. Профессиональный подход и анонимность гарантированы.
Исследовать вопрос подробнее – вывод из запоя в стационаре
Раннее обращение к специалистам позволяет провести качественную диагностику, подобрать адекватное лечение и обеспечить комплексную поддержку пациента.
Подробнее можно узнать тут – экстренная наркологическая помощь новокузнецк
— Растворы с глюкозой и витаминами для коррекции энергетического обмена. — Минеральные комплексы для нормализации электролитов. — Антиоксиданты и гепатопротекторы для защиты печени. — Спазмолитики для снятия болевого синдрома. — Противорвотные препараты при тошноте.
Выяснить больше – наркологические клиники алкоголизм
Программа лечения строится по принципу последовательного воздействия на физическое и психологическое состояние. Начинается она с детоксикации: инфузионная терапия с применением сбалансированных растворов, антиоксидантов, гепатопротекторов и витаминов. Затем — стабилизация состояния, коррекция сна, восстановление когнитивных функций и купирование абстинентного синдрома. В зависимости от диагноза используются такие методы, как заместительная терапия, нейрометаболическая поддержка, противотревожные и антидепрессивные схемы.
Узнать больше – https://narkologicheskaya-klinika-novokuzneczk0.ru/narkologicheskij-czentr-novokuzneczk
Наркологическая клиника в Твери представляет собой современное медицинское учреждение, специализирующееся на диагностике и лечении алкогольной, наркотической и других видов зависимости. В клинике «Гелиос» применяются инновационные методы терапии, направленные на полное восстановление физического и психологического состояния пациентов.
Получить дополнительные сведения – narkologicheskaya-klinika-tver0.ru/
Если близкий оказался в запое — не откладывайте помощь. В Королёве специалисты Narcology Clinic предлагают срочный и безопасный вывод из запоя с выездом на дом или в стационаре. Анонимно и с гарантией результата.
Получить дополнительную информацию – в королеве
Клиника Narcology Clinic в Королёве оказывает профессиональную помощь при запое: выезд нарколога на дом, капельницы, детокс, поддержка круглосуточно. Безопасный вывод из запоя с учётом состояния пациента и полной конфиденциальностью.
Детальнее – vyvod-iz-zapoya-czena korolev
Постановка капельницы от запоя специалистами клиники «Пульс» в Воронеже обеспечивает пациентам оперативную помощь и быстрое облегчение состояния благодаря экстренному выезду врача на дом. Наши услуги доступны круглосуточно, включая ночное время и праздничные дни, что особенно важно при внезапных и критических ситуациях. Мы гарантируем полную конфиденциальность и защиту персональных данных пациентов, что позволяет получить необходимую помощь без риска огласки. Индивидуальный подход к каждому случаю обеспечивает максимальную эффективность лечения, а наши опытные наркологи используют только сертифицированные препараты, которые безопасно и быстро выводят токсины и стабилизируют состояние здоровья. Прозрачность ценообразования, предварительное согласование всех расходов и отсутствие скрытых доплат делают услуги клиники «Пульс» удобными и доступными для всех жителей Воронежа.
Углубиться в тему – вызов на дом капельницы от запоя
Самостоятельно выйти из запоя сложно и опасно. В Narcology Clinic (Королёв) вам помогут вернуться в трезвое состояние без боли, страха и последствий. Эффективный и безопасный метод с возможностью круглосуточного выезда.
Подробнее можно узнать тут – Королев.
Длительный запой – это опасное состояние, при котором организм не успевает вывести токсины алкоголя, что приводит к серьезной интоксикации и нарушению работы жизненно важных органов. Без своевременного вмешательства риск развития осложнений существенно возрастает. Наркологическая клиника «Доктор Трезвость» в Сочи предлагает комплексную поддержку и профессиональное лечение запоя, используя передовые методы терапии и индивидуальный подход для скорейшего восстановления здоровья пациента.
Получить больше информации – http://vyvod-iz-zapoya-sochi777.ru/vyvod-iz-zapoya-anonimno-v-sochi/
Своевременная наркологическая помощь способна не только предотвратить тяжёлые осложнения, но и спасти жизнь. В Новосибирске услуга выезда нарколога на дом востребована у пациентов, которые оказались в состоянии запоя или острой интоксикации, но по разным причинам не могут или не хотят обращаться в стационар. Клиника «Наркосфера» предлагает быструю, квалифицированную и полностью анонимную медицинскую помощь прямо на дому. Такой подход минимизирует стресс, сохраняет социальную репутацию и позволяет начать лечение без задержек и потерь времени.
Разобраться лучше – анонимная наркологическая помощь
Наркозависимость — это не просто вредная привычка, а тяжёлое хроническое заболевание, требующее комплексного и последовательного лечения. В клинике «РеабКузбасс» в Новокузнецке разработаны персонализированные программы помощи, учитывающие медицинские, психологические и социальные аспекты проблемы. Каждому пациенту подбирается уникальный маршрут восстановления, начиная с первичной диагностики и заканчивая адаптацией к жизни без наркотиков. Поддержка оказывается круглосуточно, с полным соблюдением конфиденциальности. Психотерапевты и врачи работают в тесной связке, чтобы не только устранить физическую зависимость, но и восстановить личность пациента, вернуть ему мотивацию к жизни и уверенность в будущем.
Разобраться лучше – лечение наркомании цена
Цены в «ПермьМедСервис» формируются исходя из состава процедур, срочности и длительности лечения. Все тарифы озвучиваются заранее, прозрачны и не содержат скрытых пунктов. Пациент может выбрать подходящий пакет, а также оплатить услуги поэтапно или в рассрочку. Доступна оплата наличными, банковской картой, онлайн-переводом. Для постоянных клиентов предусмотрены скидки, а при прохождении полного курса — бесплатное сопровождение в течение месяца после выписки.
Узнать больше – запой наркологическая клиника в перми
— Растворы с глюкозой и витаминами для коррекции энергетического обмена. — Минеральные комплексы для нормализации электролитов. — Антиоксиданты и гепатопротекторы для защиты печени. — Спазмолитики для снятия болевого синдрома. — Противорвотные препараты при тошноте.
Изучить вопрос глубже – http://narkologicheskaya-klinika-arkhangelsk0.ru/platnaya-narkologicheskaya-klinika-arkhangelsk/
Основные направления помощи включают:
Углубиться в тему – анонимная наркологическая помощь в новокузнецке
Выезд нарколога на дом в Москве — услуга вывода из запоя от центра «Alco.Rehab». Работают круглосуточно.
Получить больше информации – москва
Выезд нарколога на дом в Москве — услуга вывода из запоя от центра «Alco.Rehab». Работают круглосуточно.
Ознакомиться с деталями – нарколог вывод из запоя
Современная наркологическая клиника — это не просто учреждение для экстренной помощи, а центр комплексной поддержки человека, столкнувшегося с зависимостью. В «КузбассМед» в Новокузнецке реализуется модель интенсивного вмешательства, где используются новейшие медицинские технологии, мультидисциплинарный подход и мобильные выездные службы. Специалисты готовы прибыть на дом за 30 минут с полным набором оборудования и медикаментов, обеспечив пациенту помощь в привычной и безопасной среде. Наркология здесь строится на индивидуализации: каждый случай рассматривается отдельно, с учётом психофизического состояния, анамнеза и жизненного контекста пациента.
Получить дополнительные сведения – http://narkologicheskaya-klinika-novokuzneczk0.ru/narkolog-novokuzneczk-na-dom/
Современные реалии требуют от медицинских учреждений гибкости, скорости и чуткости. Наркологическая помощь — одна из сфер, где промедление может стоить человеку здоровья или жизни. В наркологической клинике «ТверьМед» разработаны оперативные механизмы реагирования: выезд врача по адресу в течение 30 минут, круглосуточная поддержка и возможность получения онлайн-консультации, не покидая дом. Такой подход позволяет вовремя оказать помощь, даже если пациент отказывается ехать в стационар или не осознаёт всю серьёзность своего состояния.
Исследовать вопрос подробнее – срочная наркологическая помощь в твери
Описание
Узнать больше – снятие ломки краснодар
Для успешного и безопасного очищения организма от наркотиков применяются методы медикаментозной поддержки, что способствует уменьшению риска осложнений и облегчению состояния пациента.
Углубиться в тему – лечение наркомании наркология в новосибирске
Запой — тревожный сигнал для семьи. В Narcology Clinic (Королёв) предлагают срочную помощь: вывод из запоя в домашних условиях или в стационаре, медикаментозная поддержка и контроль состояния. Конфиденциально и эффективно.
Выяснить больше – вывод из запоя анонимно
20
Изучить вопрос глубже – http://vyvod-iz-zapoya-korolev12.ru/
Наркологическая клиника в Твери представляет собой современное медицинское учреждение, специализирующееся на диагностике и лечении алкогольной, наркотической и других видов зависимости. В клинике «Гелиос» применяются инновационные методы терапии, направленные на полное восстановление физического и психологического состояния пациентов.
Получить больше информации – частная наркологическая клиника
Игнорирование этих симптомов опасно для жизни и здоровья. Своевременное обращение в клинику «Рестарт» позволит оперативно и безопасно облегчить симптомы ломки и избежать серьезных последствий.
Подробнее можно узнать тут – http://snyatie-lomki-rnd7.ru/
Запой — тяжелое состояние, связанное с длительным и бесконтрольным употреблением алкоголя, когда человек не может самостоятельно остановиться. В результате алкогольной интоксикации страдают внутренние органы, нарушается работа сердечно-сосудистой и нервной систем. Чем дольше длится запой, тем выше риск серьезных осложнений. Капельница от запоя — быстрый и надежный способ вывести человека из опасного состояния, снять симптомы интоксикации и восстановить нормальное самочувствие. В наркологической клинике «Перспектива» в Краснодаре вы можете воспользоваться данной услугой круглосуточно, как в стационаре, так и с выездом врача на дом.
Получить дополнительную информацию – http://kapelnica-ot-zapoya-krasnodar77.ru
Клиника Narcology Clinic в Королёве оказывает профессиональную помощь при запое: выезд нарколога на дом, капельницы, детокс, поддержка круглосуточно. Безопасный вывод из запоя с учётом состояния пациента и полной конфиденциальностью.
Подробнее тут – нарколог вывод из запоя город Королев
Обращение к специалистам становится необходимым, если наблюдаются следующие симптомы, указывающие на тяжелую интоксикацию:
Углубиться в тему – вывод из запоя круглосуточно
Помощь специалиста по выводу из запоя требуется, когда симптомы интоксикации становятся критическими. Обратите внимание на следующие признаки:
Углубиться в тему – вывод из запоя на дому в сочи
Круглосуточная наркологическая помощь в Королёве: вывод из запоя от Narcology Clinic. Врачи выезжают на дом, стабилизируют состояние, проводят мягкую детоксикацию и помогают вернуться к трезвому образу жизни.
Разобраться лучше – вывод из запоя город Королев
После прохождения основной программы пациенту предлагается поддерживающее наблюдение. Оно может включать дистанционные консультации, участие в группе профилактики срывов, повторные осмотры нарколога и психолога, корректировку медикаментозной схемы. В рамках реабилитации формируются планы действий при возникновении тяги, обучаются навыки сопротивления стрессу и внешнему давлению. При желании можно подключить родственников к процессу постлечебной адаптации, чтобы укрепить результат и снизить риски рецидивов. Таким образом, пациент не остаётся один даже после выписки.
Получить больше информации – https://lechenie-narkomanii-novokuzneczk0.ru
После диагностики нарколог приступает к основному этапу — инфузионной детоксикации. Препараты подбираются индивидуально, с учётом тяжести интоксикации, анамнеза и сопутствующих заболеваний. Основу составляют водно-солевые растворы, глюкоза, витаминные комплексы, седативные препараты, гепатопротекторы и нейропротекторы. Инфузии выполняются капельно, медленно, в течение нескольких часов, с постоянным мониторингом состояния пациента. При необходимости используется оксигенотерапия, противорвотные, антиаритмические и противосудорожные препараты. Все растворы стерильны, а расходные материалы одноразовые и соответствуют стандартам качества.
Получить дополнительные сведения – платная наркологическая скорая помощь
Вывод из запоя в Королёве от Narcology Clinic — квалифицированная помощь на дому и в клинике. Индивидуальный подбор препаратов, поддержка психики и организма, круглосуточный приём и сопровождение пациента.
Детальнее – вывод из запоя недорого
Врач самостоятельно оценивает тяжесть интоксикации и назначает необходимый курс инфузий, физиопроцедур и приём препаратов. Варианты терапии включают детокс-комплекс, коррекцию водно-электролитного баланса и витаминотерапию.
Подробнее – частная наркологическая клиника архангельск.
Тем, кто нуждается в длительной терапии, «КузбассМед» предлагает комфортные условия стационара с круглосуточным наблюдением. Здесь пациенты размещаются в индивидуальных палатах, проходят курсы терапии, реабилитации и психокоррекции. Обстановка в клинике напоминает оздоровительный центр: мягкое освещение, тишина, доступ к библиотеке, возможность общения с психологом и ежедневное участие в восстановительных мероприятиях. Медицинские сестры и врачи находятся на дежурстве 24/7, что позволяет немедленно реагировать на любые изменения в состоянии пациента.
Выяснить больше – частная наркологическая клиника новокузнецк
Выезд нарколога на дом в Москве — услуга вывода из запоя от центра «Alco.Rehab». Работают круглосуточно.
Подробнее тут – вывод из запоя в стационаре
Анонимная помощь при запое — врачи «Alco.Rehab» (Москва) приедут к вам в течение часа.
Углубиться в тему – вывод из запоя город москва
Капельница от запоя в Краснодаре рекомендуется при первых признаках алкогольной интоксикации или тяжелого похмелья. Без своевременного медицинского вмешательства состояние человека может резко ухудшиться, привести к развитию осложнений и даже стать угрозой для жизни. Срочная помощь необходима в таких случаях:
Изучить вопрос глубже – выезд на дом капельница от запоя
Наркологическая клиника в Твери представляет собой современное медицинское учреждение, специализирующееся на диагностике и лечении алкогольной, наркотической и других видов зависимости. В клинике «Гелиос» применяются инновационные методы терапии, направленные на полное восстановление физического и психологического состояния пациентов.
Ознакомиться с деталями – https://narkologicheskaya-klinika-tver0.ru
Во многих случаях пациент или его родственники не решаются сразу вызвать врача. Для таких ситуаций предусмотрена услуга онлайн-консультации. Она проводится через защищённую видеосвязь, при желании — анонимно. На связи — врач-нарколог или психиатр, который отвечает на вопросы, оценивает ситуацию по визуальным и вербальным признакам, рекомендует план действий. Консультация может стать отправной точкой для дальнейшего вызова врача на дом или записи в клинику. Это особенно удобно для родственников, которые не знают, как подступиться к проблеме и убедить человека в необходимости помощи.
Детальнее – https://narkologicheskaya-pomoshh-tver0.ru/narkolog-v-tveri-czeny
Самостоятельно выйти из запоя сложно и опасно. В Narcology Clinic (Королёв) вам помогут вернуться в трезвое состояние без боли, страха и последствий. Эффективный и безопасный метод с возможностью круглосуточного выезда.
Узнать больше – наркологический вывод из запоя
Да, клиника работает в закрытом формате. Пациент вправе отказаться от передачи данных третьим лицам, а документы оформляются без указания диагноза.
Получить больше информации – лечение в наркологической клинике
Клиника «Доктор Трезвость» в Сочи предлагает современное лечение запоя, основанное на комплексном подходе и индивидуальной программе для каждого пациента. Наши лицензированные специалисты используют передовые методы терапии, что позволяет достичь быстрого и безопасного вывода из запоя, а также создать надежную основу для дальнейшей реабилитации.
Подробнее тут – вывод из запоя сочи
Самостоятельно выйти из запоя сложно и опасно. В Narcology Clinic (Королёв) вам помогут вернуться в трезвое состояние без боли, страха и последствий. Эффективный и безопасный метод с возможностью круглосуточного выезда.
Выяснить больше – вывод из запоя цена
Преимущество
Углубиться в тему – снятие ломки капельницей
Процесс лечения зависимости включает несколько последовательных этапов, каждый из которых важен для достижения стойкой ремиссии и возвращения к полноценной жизни. Для успешного результата необходима последовательная работа специалистов и активное участие пациента.
Получить дополнительные сведения – лечение наркомании реабилитация
Абстинентный синдром развивается после прекращения приёма наркотических веществ или алкоголя, и сопровождается комплексом тяжёлых симптомов:
Подробнее можно узнать тут – снятие ломки нарколог
Сделайте первый шаг к трезвости с профессиональной помощью. В Narcology Clinic (г. Королёв) осуществляют вывод из запоя на дому и в клинике. Индивидуальный подход, анонимность, сопровождение пациента и семьи на всех этапах.
Подробнее тут – вывод из запоя на дому круглосуточно
Наша наркологическая клиника успешно помогает пациентам с различной степенью алкогольной зависимости. Преимущества клиники «Перспектива» представлены в таблице ниже:
Детальнее – https://kapelnica-ot-zapoya-krasnodar77.ru/
Наркозависимость — это не просто вредная привычка, а тяжёлое хроническое заболевание, требующее комплексного и последовательного лечения. В клинике «РеабКузбасс» в Новокузнецке разработаны персонализированные программы помощи, учитывающие медицинские, психологические и социальные аспекты проблемы. Каждому пациенту подбирается уникальный маршрут восстановления, начиная с первичной диагностики и заканчивая адаптацией к жизни без наркотиков. Поддержка оказывается круглосуточно, с полным соблюдением конфиденциальности. Психотерапевты и врачи работают в тесной связке, чтобы не только устранить физическую зависимость, но и восстановить личность пациента, вернуть ему мотивацию к жизни и уверенность в будущем.
Углубиться в тему – лечение наркомании кодирование новокузнецк
Диагностика в клинике «КузбассМед» проводится комплексно: используются лабораторные, инструментальные и психологические методы. Благодаря применению цифровых систем и алгоритмов обработки данных, результаты анализов доступны уже в течение первого часа. Оценка проводится по нескольким направлениям: токсикологический статус, состояние печени и почек, электролитный баланс, нейровегетативное состояние, когнитивные функции и уровень стресса. Это позволяет врачам составлять максимально точную картину заболевания и подбирать индивидуальные методы терапии.
Исследовать вопрос подробнее – http://narkologicheskaya-klinika-novokuzneczk0.ru
Клиника «Полярис» предлагает круглосуточную наркологическую помощь в Архангельске и области. Главные преимущества — выезд врача на дом в течение 30 минут и условия VIP-уровня в стационаре. Здесь используются передовые методы детоксикации, индивидуальный подход и комплексная психотерапевтическая поддержка, что позволяет пациенту максимально быстро и безопасно справиться с алкогольной зависимостью.
Получить дополнительную информацию – [url=https://narkologicheskaya-klinika-arkhangelsk0.ru/]наркологическая клиника нарколог[/url]
Вывод из запоя в Королёве от Narcology Clinic — квалифицированная помощь на дому и в клинике. Индивидуальный подбор препаратов, поддержка психики и организма, круглосуточный приём и сопровождение пациента.
Подробнее можно узнать тут – вывод из запоя город Королев
Длительный запой – это опасное состояние, при котором организм не успевает вывести токсины алкоголя, что приводит к серьезной интоксикации и нарушению работы жизненно важных органов. Без своевременного вмешательства риск развития осложнений существенно возрастает. Наркологическая клиника «Доктор Трезвость» в Сочи предлагает комплексную поддержку и профессиональное лечение запоя, используя передовые методы терапии и индивидуальный подход для скорейшего восстановления здоровья пациента.
Подробнее можно узнать тут – http://vyvod-iz-zapoya-sochi777.ru/vyvod-iz-zapoya-cena-v-sochi/
В основе работы наркологической клиники лежит комплексный подход, включающий медицинскую детоксикацию, психотерапевтическую поддержку и социальную реабилитацию. Такой подход позволяет не только снять острые симптомы интоксикации, но и сформировать устойчивую мотивацию к трезвому образу жизни.
Подробнее – https://narkologicheskaya-klinika-tver0.ru/narkolog-tver-telefon
Анонимная помощь при запое — врачи «Alco.Rehab» (Москва) приедут к вам в течение часа.
Углубиться в тему – вывод из запоя цена
Выезд нарколога на дом в Москве — услуга вывода из запоя от центра «Alco.Rehab». Работают круглосуточно.
Выяснить больше – вывод из запоя анонимно
Нужен срочный вывод из запоя в Королёве? Обратитесь в Narcology Clinic. Опытные врачи приедут на дом, проведут детоксикацию и поддержат пациента на этапе восстановления. Помощь доступна круглосуточно и анонимно.
Углубиться в тему – vyvod-iz-zapoya gorod korolev
Во время онлайн-сессии специалист может использовать шкалы оценки состояния (CIWA-Ar, CAGE, AUDIT), психодиагностические опросники, видеоанализ мимики и речи. Это позволяет провести достаточно точную первичную дифференцировку между алкогольной абстиненцией, тревожным расстройством, интоксикацией и психотическим состоянием. При необходимости пациенту предлагается записаться на очный приём или воспользоваться услугой «стационар на дому» — с ежедневными визитами и наблюдением.
Получить дополнительную информацию – платная наркологическая скорая помощь
Вывод из запоя в Королёве от Narcology Clinic — квалифицированная помощь на дому и в клинике. Индивидуальный подбор препаратов, поддержка психики и организма, круглосуточный приём и сопровождение пациента.
Подробнее тут – вывод из запоя цена город Королев
Помощь специалиста по выводу из запоя требуется, когда симптомы интоксикации становятся критическими. Обратите внимание на следующие признаки:
Узнать больше – вывод из запоя недорого
Игнорирование этих симптомов может привести к тяжелым последствиям для здоровья, включая алкогольный психоз и повреждение внутренних органов.
Изучить вопрос глубже – капельница от запоя на дому в краснодаре
Тем, кто нуждается в длительной терапии, «КузбассМед» предлагает комфортные условия стационара с круглосуточным наблюдением. Здесь пациенты размещаются в индивидуальных палатах, проходят курсы терапии, реабилитации и психокоррекции. Обстановка в клинике напоминает оздоровительный центр: мягкое освещение, тишина, доступ к библиотеке, возможность общения с психологом и ежедневное участие в восстановительных мероприятиях. Медицинские сестры и врачи находятся на дежурстве 24/7, что позволяет немедленно реагировать на любые изменения в состоянии пациента.
Детальнее – наркологическая клиника нарколог новокузнецк
Многие методы лечения наркозависимости не дают устойчивого результата именно потому, что применяются шаблонно, без учёта особенностей конкретного человека. В «РеабКузбасс» отказались от универсальных схем: каждый случай рассматривается как уникальный. При составлении программы учитываются возраст, стаж употребления, тип вещества, психическое состояние, наличие сопутствующих заболеваний, мотивация к лечению и даже уровень поддержки со стороны близких. Такой подход позволяет не просто временно снять симптомы, а добиться реального внутреннего изменения и стойкой ремиссии.
Подробнее можно узнать тут – https://lechenie-narkomanii-novokuzneczk0.ru/reabilitacziya-narkomana-novokuzneczk
Каждый пациент получает персонализированный план лечения, разработанный с учётом анамнеза, общего состояния и психоэмоционального фона. В «ПермьМедСервис» нет универсальных шаблонов — используется модульная модель терапии, при которой программы состоят из комбинированных блоков: медикаментозное лечение, психотерапия, физиотерапия, семейное консультирование. Это позволяет гибко адаптировать курс, вносить изменения по ходу лечения и учитывать динамику состояния пациента.
Детальнее – наркологическая клиника клиника помощь
Если близкий оказался в запое — не откладывайте помощь. В Королёве специалисты Narcology Clinic предлагают срочный и безопасный вывод из запоя с выездом на дом или в стационаре. Анонимно и с гарантией результата.
Подробнее – наркологический вывод из запоя в королеве
Оперативное вмешательство позволяет быстро начать детоксикацию и предотвратить развитие опасных осложнений.
Углубиться в тему – вывод из запоя в стационаре
Абстинентный синдром, или ломка, – это тяжелое состояние, которое развивается у зависимых после отказа от наркотиков или алкоголя. Он сопровождается сильными физическими болями, судорогами, повышенной тревожностью, бессонницей и эмоциональными перепадами, что может привести к серьезным осложнениям для здоровья. Наркологическая клиника «Здравица» в Ростове-на-Дону предлагает комплексное лечение абстинентного синдрома, используя передовые методики и индивидуальный подход для быстрого восстановления здоровья.
Узнать больше – снятие ломки в краснодаре
— Растворы с глюкозой и витаминами для коррекции энергетического обмена. — Минеральные комплексы для нормализации электролитов. — Антиоксиданты и гепатопротекторы для защиты печени. — Спазмолитики для снятия болевого синдрома. — Противорвотные препараты при тошноте.
Ознакомиться с деталями – бесплатная наркологическая клиника
20
Углубиться в тему – вывод из запоя цена московская область
Игнорирование этих симптомов опасно для жизни и здоровья. Своевременное обращение в клинику «Рестарт» позволит оперативно и безопасно облегчить симптомы ломки и избежать серьезных последствий.
Углубиться в тему – http://snyatie-lomki-rnd7.ru/snyatie-lomki-na-domu-v-rnd/
Второй важный этап лечения — назначение лекарственных средств, направленных на нормализацию работы нервной системы, снижение симптомов абстиненции и профилактику срывов. Применение медикаментов подбирается индивидуально с учётом типа зависимости и общего состояния пациента.
Исследовать вопрос подробнее – принудительное лечение наркомании
Ниже приведены основные преимущества лечения в наркологической клинике «Гелиос», которые делают её одним из ведущих центров в Твери:
Исследовать вопрос подробнее – [url=https://narkologicheskaya-klinika-tver0.ru/]наркологическая клиника лечение алкоголизма тверь[/url]
Круглосуточная наркологическая помощь в Королёве: вывод из запоя от Narcology Clinic. Врачи выезжают на дом, стабилизируют состояние, проводят мягкую детоксикацию и помогают вернуться к трезвому образу жизни.
Разобраться лучше – вывод из запоя московская область
Вывод из запоя без стресса — специалисты клиники «Alco.Rehab» в Москве знают, как помочь быстро и безопасно.
Изучить вопрос глубже – вывод из запоя город москва
Зависимость разрушает семью? Не медлите — обратитесь в московский центр «Alco.Rehab» за квалифицированной помощью.
Подробнее можно узнать тут – [url=https://vyvod-iz-zapoya-moskva13.ru/]вывод из запоя недорого город москва[/url]
Запой — тяжелое состояние, связанное с длительным и бесконтрольным употреблением алкоголя, когда человек не может самостоятельно остановиться. В результате алкогольной интоксикации страдают внутренние органы, нарушается работа сердечно-сосудистой и нервной систем. Чем дольше длится запой, тем выше риск серьезных осложнений. Капельница от запоя — быстрый и надежный способ вывести человека из опасного состояния, снять симптомы интоксикации и восстановить нормальное самочувствие. В наркологической клинике «Перспектива» в Краснодаре вы можете воспользоваться данной услугой круглосуточно, как в стационаре, так и с выездом врача на дом.
Исследовать вопрос подробнее – сколько стоит капельница на дому от запоя
Современные реалии требуют от медицинских учреждений гибкости, скорости и чуткости. Наркологическая помощь — одна из сфер, где промедление может стоить человеку здоровья или жизни. В наркологической клинике «ТверьМед» разработаны оперативные механизмы реагирования: выезд врача по адресу в течение 30 минут, круглосуточная поддержка и возможность получения онлайн-консультации, не покидая дом. Такой подход позволяет вовремя оказать помощь, даже если пациент отказывается ехать в стационар или не осознаёт всю серьёзность своего состояния.
Исследовать вопрос подробнее – наркологическая психиатрическая помощь
Одним из ключевых преимуществ «КузбассМед» является современная материально-техническая база. В клинике задействованы устройства для точного мониторинга жизненных функций, автоматические инфузионные системы, экспресс-диагностические модули и оборудование для неотложной терапии. Врачи используют программируемые дозаторы, портативные анализаторы крови и аппараты для оценки дыхательной функции, что позволяет своевременно корректировать тактику лечения без потерь времени. Все процедуры соответствуют национальным стандартам безопасности и рекомендациям ВОЗ.
Выяснить больше – наркологическая клиника нарколог в новокузнецке
Вывод из запоя в Королёве от Narcology Clinic — квалифицированная помощь на дому и в клинике. Индивидуальный подбор препаратов, поддержка психики и организма, круглосуточный приём и сопровождение пациента.
Разобраться лучше – вывод из запоя в стационаре в королеве
Все обращения в клинику «РеабКузбасс» обрабатываются в рамках строгой анонимности. Пациент может проходить лечение без паспорта, под вымышленным именем, если это важно для психологического комфорта. Ни одна медицинская процедура или консультация не фиксируется в государственных базах без согласия. Персонал подписывает документы о неразглашении. Также предлагается анонимная оплата и оформление без упоминания диагноза в документах. При необходимости пациент может получить справку с нейтральной формулировкой для работы или страховой компании.
Изучить вопрос глубже – лечение наркомании клиника в новокузнецке
Передовые методики
Подробнее можно узнать тут – https://vyvod-iz-zapoya-sochi777.ru/vyvod-iz-zapoya-anonimno-v-sochi/
Запой — тревожный сигнал для семьи. В Narcology Clinic (Королёв) предлагают срочную помощь: вывод из запоя в домашних условиях или в стационаре, медикаментозная поддержка и контроль состояния. Конфиденциально и эффективно.
Детальнее – вывод из запоя клиника
Для пациентов, требующих круглосуточного наблюдения, клиника «Полярис» предлагает стационар VIP-класса. Здесь созданы все условия для быстрого восстановления: удобные палаты, индивидуальное меню, зоны отдыха и консультации профильных специалистов.
Углубиться в тему – chastnaya narkologicheskaya klinika arhangel’sk
В основе работы наркологической клиники лежит комплексный подход, включающий медицинскую детоксикацию, психотерапевтическую поддержку и социальную реабилитацию. Такой подход позволяет не только снять острые симптомы интоксикации, но и сформировать устойчивую мотивацию к трезвому образу жизни.
Узнать больше – http://narkologicheskaya-klinika-tver0.ru/narkolog-v-tveri-czeny/https://narkologicheskaya-klinika-tver0.ru
Игнорирование этих симптомов может привести к тяжелым последствиям для здоровья, включая алкогольный психоз и повреждение внутренних органов.
Получить дополнительную информацию – капельница от запоя на дому недорого
В клинике Narcology Clinic (Королёв) вывод из запоя проводится по современным протоколам. Медикаментозная капельница, восстановление сна и давления, сопровождение до полной стабилизации. Безопасная и безосуждающая помощь.
Получить дополнительные сведения – вывод из запоя
Для многих пациентов страх быть поставленным на учёт или потерять работу становится серьёзным барьером на пути к выздоровлению. В «ПермьМедСервис» данные пациента остаются строго внутри клиники: ни в какие внешние базы информация не передаётся. При оформлении документов не указывается диагноз, а возможна подача под псевдонимом. Консультации, процедуры и ведение истории болезни проходят в полностью закрытом режиме. Это позволяет пациенту сосредоточиться на выздоровлении, не опасаясь последствий для своей личной или профессиональной жизни.
Получить дополнительную информацию – платная наркологическая клиника в перми
Абстинентный синдром развивается после прекращения приёма наркотических веществ или алкоголя, и сопровождается комплексом тяжёлых симптомов:
Выяснить больше – http://snyatie-lomki-rnd7.ru/snyatie-lomki-na-domu-v-rnd/
Спокойный выход из кризиса — воспользуйтесь услугой вывода из запоя от «Alco.Rehab» в Москве.
Детальнее – московская область
Зависимость разрушает семью? Не медлите — обратитесь в московский центр «Alco.Rehab» за квалифицированной помощью.
Получить дополнительную информацию – вывод из запоя капельница город москва
Современная наркологическая клиника — это не просто учреждение для экстренной помощи, а центр комплексной поддержки человека, столкнувшегося с зависимостью. В «КузбассМед» в Новокузнецке реализуется модель интенсивного вмешательства, где используются новейшие медицинские технологии, мультидисциплинарный подход и мобильные выездные службы. Специалисты готовы прибыть на дом за 30 минут с полным набором оборудования и медикаментов, обеспечив пациенту помощь в привычной и безопасной среде. Наркология здесь строится на индивидуализации: каждый случай рассматривается отдельно, с учётом психофизического состояния, анамнеза и жизненного контекста пациента.
Узнать больше – наркологические клиники алкоголизм
Клиника «Здравица» в Ростове-на-Дону предлагает современный комплексный подход к лечению абстинентного синдрома. Наши пациенты получают помощь от высококвалифицированных специалистов, которые используют передовые методики и индивидуально подбирают программу лечения для каждого. Среди ключевых преимуществ клиники «Здравица» можно выделить:
Ознакомиться с деталями – снятие ломки капельницей краснодар
На первом этапе проводится комплексное обследование, позволяющее выявить степень зависимости, определить физическое и психическое состояние пациента, а также выявить сопутствующие заболевания. Это позволяет составить индивидуальный план лечения.
Получить больше информации – http://
Описание
Ознакомиться с деталями – https://vyvod-iz-zapoya-sochi7.ru/
При получении заявки по телефону или через сайт администратор передаёт её врачу-дежуранту, который немедленно выезжает по указанному адресу. По прибытии специалист проводит первичный осмотр: измеряются артериальное давление, пульс, температура, сатурация. Затем осуществляется экспресс-оценка состояния ЦНС и метаболизма. При необходимости берутся анализы, подключается инфузионная система, проводятся противотревожные и детоксикационные мероприятия. Врач остаётся с пациентом до полной стабилизации состояния, а при тяжёлых симптомах организует транспортировку в стационар.
Получить больше информации – платная наркологическая скорая помощь в твери
Все обращения в клинику «РеабКузбасс» обрабатываются в рамках строгой анонимности. Пациент может проходить лечение без паспорта, под вымышленным именем, если это важно для психологического комфорта. Ни одна медицинская процедура или консультация не фиксируется в государственных базах без согласия. Персонал подписывает документы о неразглашении. Также предлагается анонимная оплата и оформление без упоминания диагноза в документах. При необходимости пациент может получить справку с нейтральной формулировкой для работы или страховой компании.
Исследовать вопрос подробнее – http://lechenie-narkomanii-novokuzneczk0.ru/lechenie-zavisimosti-ot-narkotikov-novokuzneczk/
В клинике Narcology Clinic (Королёв) вывод из запоя проводится по современным протоколам. Медикаментозная капельница, восстановление сна и давления, сопровождение до полной стабилизации. Безопасная и безосуждающая помощь.
Получить дополнительные сведения – вывод из запоя на дому цена в королеве
Передовые методики
Получить больше информации – вывод из запоя на дому цена в сочи
Этот текст призван помочь читателю расширить кругозор и получить практические знания. Мы используем простой язык, наглядные примеры и структурированное изложение, чтобы сделать обучение максимально эффективным и увлекательным.
Смотри, что ещё есть – https://spacev.be/2022/10/30/bonjour-tout-le-monde
Этот информативный текст отличается привлекательным содержанием и актуальными данными. Мы предлагаем читателям взглянуть на привычные вещи под новым углом, предоставляя интересный и доступный материал. Получите удовольствие от чтения и расширьте кругозор!
Это стоит прочитать полностью – https://104box.com/hola-mundo
Круглосуточная наркологическая помощь в Королёве: вывод из запоя от Narcology Clinic. Врачи выезжают на дом, стабилизируют состояние, проводят мягкую детоксикацию и помогают вернуться к трезвому образу жизни.
Подробнее – вывод из запоя в королеве
Предлагаем вашему вниманию интересную справочную статью, в которой собраны ключевые моменты и нюансы по актуальным вопросам. Эта информация будет полезна как для профессионалов, так и для тех, кто только начинает изучать тему. Узнайте ответы на важные вопросы и расширьте свои знания!
Нажмите, чтобы узнать больше – https://ipfonline.org/ipf-medicon-2-proclaimed
В этой статье представлен занимательный и актуальный контент, который заставит вас задуматься. Мы обсуждаем насущные вопросы и проблемы, а также освещаем истории, которые вдохновляют на действия и изменения. Узнайте, что стоит за событиями нашего времени!
Изучить вопрос глубже – https://fitnesdomaonline.ru/krasota/lechenie-narkomanii-s-chego-vsyo-nachinaetsya
В этой статье представлен занимательный и актуальный контент, который заставит вас задуматься. Мы обсуждаем насущные вопросы и проблемы, а также освещаем истории, которые вдохновляют на действия и изменения. Узнайте, что стоит за событиями нашего времени!
Обратитесь за информацией – https://teramus.gr/index.php/services3/item/39-services?start=3910
В этой информационной статье вы найдете интересное содержание, которое поможет вам расширить свои знания. Мы предлагаем увлекательный подход и уникальные взгляды на обсуждаемые темы, побуждая пользователей к активному мышлению и критическому анализу.
Узнай первым! – https://63med.ru/52970
Публикация предлагает уникальную подборку информации, которая будет интересна как специалистам, так и широкому кругу читателей. Здесь вы найдете ответы на часто задаваемые вопросы и полезные инсайты для дальнейшего применения.
Обратиться к источнику – https://predportgorelovo.ru/lechenie-narkozavisimosti-v-volgograde
Эта публикация завернет вас в вихрь увлекательного контента, сбрасывая стереотипы и открывая двери к новым идеям. Каждый абзац станет для вас открытием, полным ярких примеров и впечатляющих достижений. Подготовьтесь быть вовлеченными и удивленными каждый раз, когда продолжите читать.
Нажми и узнай всё – https://63med.ru/52970
В этой статье вы найдете познавательную и занимательную информацию, которая поможет вам лучше понять мир вокруг. Мы собрали интересные данные, которые вдохновляют на размышления и побуждают к действиям. Открывайте новую информацию и получайте удовольствие от чтения!
Почему это важно? – https://taxguruzz.com/2024/08/12/art-building-your-instagram-empire-insider
Этот увлекательный информационный материал подарит вам массу новых знаний и ярких эмоций. Мы собрали для вас интересные факты и сведения, которые обогатят ваш опыт. Откройте для себя увлекательный мир информации и насладитесь процессом изучения!
Ознакомиться с полной информацией – https://vitalady.ru/bolezni/effektivnoe-lechenie-alkogolizma.html
Этот информативный текст отличается привлекательным содержанием и актуальными данными. Мы предлагаем читателям взглянуть на привычные вещи под новым углом, предоставляя интересный и доступный материал. Получите удовольствие от чтения и расширьте кругозор!
Доступ к полной версии – https://www.kynologiasala.sk/sop_skuska
Эта информационная статья содержит полезные факты, советы и рекомендации, которые помогут вам быть в курсе последних тенденций и изменений в выбранной области. Материал составлен так, чтобы быть полезным и понятным каждому.
Практические советы ждут тебя – https://louisvilledailyjournal.com/regina-kings-son-ian-alexander-jr-has-died-by-suicide-he-cared-so-deeply-about-the-happiness-of-others
В этой статье представлен занимательный и актуальный контент, который заставит вас задуматься. Мы обсуждаем насущные вопросы и проблемы, а также освещаем истории, которые вдохновляют на действия и изменения. Узнайте, что стоит за событиями нашего времени!
Узнать больше – https://2022nq.co.uk
В этой статье собраны факты, которые освещают целый ряд важных вопросов. Мы стремимся предложить читателям четкую, достоверную информацию, которая поможет сформировать собственное мнение и лучше понять сложные аспекты рассматриваемой темы.
Узнать больше – https://pjcmediamagnet.com/the-dos-and-donts-of-seo-common-mistakes-to-avoid
В этой статье представлен занимательный и актуальный контент, который заставит вас задуматься. Мы обсуждаем насущные вопросы и проблемы, а также освещаем истории, которые вдохновляют на действия и изменения. Узнайте, что стоит за событиями нашего времени!
Ознакомьтесь с аналитикой – http://an-ve.co.uk/conbox-stackable-electric-fan
Предлагаем вашему вниманию интересную справочную статью, в которой собраны ключевые моменты и нюансы по актуальным вопросам. Эта информация будет полезна как для профессионалов, так и для тех, кто только начинает изучать тему. Узнайте ответы на важные вопросы и расширьте свои знания!
Выяснить больше – https://www.osteo.cz/post-3
Этот текст призван помочь читателю расширить кругозор и получить практические знания. Мы используем простой язык, наглядные примеры и структурированное изложение, чтобы сделать обучение максимально эффективным и увлекательным.
Более подробно об этом – https://slcs.edu.in/15
Описание
Изучить вопрос глубже – снять ломку
Клиника «Доктор Трезвость» в Сочи предлагает современное лечение запоя, основанное на комплексном подходе и индивидуальной программе для каждого пациента. Наши лицензированные специалисты используют передовые методы терапии, что позволяет достичь быстрого и безопасного вывода из запоя, а также создать надежную основу для дальнейшей реабилитации.
Подробнее – https://vyvod-iz-zapoya-sochi777.ru/vyvod-iz-zapoya-cena-v-sochi
Преимущество
Получить дополнительную информацию – срочный вывод из запоя
В наркологической клинике «Рестарт» используется комплексный подход к лечению абстинентного синдрома. Наши преимущества:
Узнать больше – http://snyatie-lomki-rnd7.ru/
В нашем центре доступны следующие виды помощи:
Углубиться в тему – https://narko-zakodirovat.ru/vivod-iz-zapoya-v-kruglosutochno-v-tveri/
Алкоголь оказывает глубокое воздействие на здоровье: психоэмоциональное и физическое состояние человека значительно ухудшаются, если злоупотребление продолжается долго. Даже небольшие дозы алкоголя, употребляемые регулярно, вызывают накопление токсинов, которые приводят к расстройствам в работе сердечно-сосудистой системы, печени, почек и других жизненно важных органов.
Разобраться лучше – http://алко-ребцентр.рф/kruglosutochnyj-vyvod-iz-zapoya-nizhnij-novgorod/
Индивидуальный подход к каждому пациенту: Учитываются уникальные характеристики, включая медицинскую историю, психологическое состояние и социальные факторы. Это позволяет разработать максимально эффективный план терапии.
Изучить вопрос глубже – https://alko-lechebnica.ru/lechenie-alkogolizma-v-Sankt-Peterburge/
Мы уделяем особое внимание индивидуальному подходу к каждому пациенту, понимая, что причины и проявления зависимости у всех разные. Тщательная диагностика позволяет учитывать медицинские, психологические и социальные аспекты каждого случая, на основе чего разрабатываются персонализированные программы лечения. Они включают медикаментозную терапию, психотерапевтические методы и мероприятия по социальной адаптации.
Узнать больше – https://срочно-вывод-из-запоя.рф/
Передовые методики
Исследовать вопрос подробнее – https://vyvod-iz-zapoya-sochi777.ru/vyvod-iz-zapoya-anonimno-v-sochi/
Абстинентный синдром развивается после прекращения приёма наркотических веществ или алкоголя, и сопровождается комплексом тяжёлых симптомов:
Углубиться в тему – ломка от наркотиков город
Основные направления нашей работы
Разобраться лучше – вывод из запоя на дому круглосуточно в омске
Выбор места лечения зависит от состояния пациента. Если симптомы умеренные и пациент способен самостоятельно поддерживать контакт с врачом, возможно лечение на дому. Однако при более сложных случаях, когда необходим постоянный контроль и интенсивная терапия, рекомендуется госпитализация.
Подробнее тут – http://наркология-помощь.рф/
Сделайте первый шаг к трезвости. Круглосуточный вывод из запоя в Москве от «Alco.Rehab» — безопасно, надёжно, профессионально.
Выяснить больше – moskva
Вывод из запоя в Королёве от Narcology Clinic — квалифицированная помощь на дому и в клинике. Индивидуальный подбор препаратов, поддержка психики и организма, круглосуточный приём и сопровождение пациента.
Изучить вопрос глубже – вывод из запоя на дому московская область
Анонимная помощь при запое — врачи «Alco.Rehab» (Москва) приедут к вам в течение часа.
Получить больше информации – наркология вывод из запоя
Кроме того, клиника “Ресурс здоровья” делает акцент на профилактике рецидивов. Мы обучаем пациентов навыкам управления стрессом, эмоциональному регулированию и формированию здорового образа жизни. Наша цель — обеспечить долгосрочное восстановление и снизить риск возвращения к пагубным привычкам.
Ознакомиться с деталями – вывод из запоя краснодар
Основными направлениями работы нашей клиники являются.
Исследовать вопрос подробнее – https://нарко-специалист.рф/vivod-iz-zapoya-v-stacionare-v-Ekaterinburge
Преимущество
Выяснить больше – снятие ломки на дому цена в краснодаре
Клиника «Детоксика» в Сочи предлагает эффективное лечение запоя по доступным ценам с использованием современных методов и индивидуального подхода. Наши основные преимущества:
Выяснить больше – https://vyvod-iz-zapoya-sochi77.ru
Зависимость — коварное хроническое заболевание, поражающее не только физическое, но и психическое здоровье человека. Она захватывает волю, разум, искажает восприятие реальности, разрушает семьи и судьбы. Алкоголизм, наркомания, игровая зависимость — всё это грани одной проблемы, требующей комплексного и профессионального подхода.
Подробнее – http://alko-reabcentr.ru/vivod-iz-zapoya-cena-v-Sankt-Peterburge/
В условиях современного общества наркомания и алкоголизм стали актуальными и серьезными проблемами, затрагивающими не только индивидуумов, но и их семьи, сообщества. Эти заболевания не просто влияют на физическое здоровье, они наносят урон психоэмоциональному состоянию, нарушают социальные связи и ухудшают качество жизни. Наркологический центр “Новый горизонт” предлагает целостный и научно обоснованный подход к лечению зависимостей от психоактивных веществ. Мы применяем современные методы диагностики и терапии, чтобы помочь каждому пациенту обрести здоровье и вернуть себе полноценную жизнь.
Изучить вопрос глубже – http://alko-specialist.ru
Самостоятельно выйти из запоя сложно и опасно. В Narcology Clinic (Королёв) вам помогут вернуться в трезвое состояние без боли, страха и последствий. Эффективный и безопасный метод с возможностью круглосуточного выезда.
Изучить вопрос глубже – московская область
Запой — это опасное состояние, при котором организм человека подвергается сильной алкогольной интоксикации, а внутренние органы, такие как печень, сердце и почки, начинают работать в аварийном режиме. В такой момент самостоятельное лечение становится невозможным, и необходима оперативная помощь специалистов. Наркологическая клиника «Детоксика» в Сочи предлагает комплексный вывод из запоя с использованием современных методов терапии и индивидуального подхода, что позволяет быстро восстановить здоровье пациента и предотвратить серьезные осложнения.
Исследовать вопрос подробнее – https://vyvod-iz-zapoya-sochi7.ru/vyvod-iz-zapoya-cena-v-sochi
Запой — тревожный сигнал для семьи. В Narcology Clinic (Королёв) предлагают срочную помощь: вывод из запоя в домашних условиях или в стационаре, медикаментозная поддержка и контроль состояния. Конфиденциально и эффективно.
Получить дополнительные сведения – вывод из запоя недорого город Королев
Спокойный выход из кризиса — воспользуйтесь услугой вывода из запоя от «Alco.Rehab» в Москве.
Подробнее можно узнать тут – moskva
Запой — это не просто злоупотребление алкоголем, а опасное состояние, при котором организм уже не может самостоятельно справиться с токсинами. Чем дольше продолжается запой, тем сложнее выход из него и тем выше риск осложнений.
Изучить вопрос глубже – http://наркология-дома.рф/
Сделайте первый шаг к трезвости. Круглосуточный вывод из запоя в Москве от «Alco.Rehab» — безопасно, надёжно, профессионально.
Узнать больше – нарколог вывод из запоя в москве
Длительный запой – это опасное состояние, при котором организм не успевает вывести токсины алкоголя, что приводит к серьезной интоксикации и нарушению работы жизненно важных органов. Без своевременного вмешательства риск развития осложнений существенно возрастает. Наркологическая клиника «Доктор Трезвость» в Сочи предлагает комплексную поддержку и профессиональное лечение запоя, используя передовые методы терапии и индивидуальный подход для скорейшего восстановления здоровья пациента.
Углубиться в тему – срочный вывод из запоя в сочи
Описание
Детальнее – снятие ломки краснодар
Когда следует немедленно обращаться за помощью:
Подробнее можно узнать тут – https://алко-ребцентр.рф/kruglosutochnyj-vyvod-iz-zapoya-nizhnij-novgorod/
Абстинентный синдром развивается после прекращения приёма наркотических веществ или алкоголя, и сопровождается комплексом тяжёлых симптомов:
Узнать больше – http://snyatie-lomki-rnd7.ru/snyatie-lomki-na-domu-v-rnd/
Мы работаем по следующим основным направлениям.
Разобраться лучше – вывод из запоя анонимно
Таким образом, мы создаём систему поддержки, позволяющую каждому пациенту успешно справляться с зависимостью и вернуться к полноценной жизни.
Получить больше информации – срочный вывод из запоя санкт-петербург
В клинике Narcology Clinic (Королёв) вывод из запоя проводится по современным протоколам. Медикаментозная капельница, восстановление сна и давления, сопровождение до полной стабилизации. Безопасная и безосуждающая помощь.
Исследовать вопрос подробнее – vyvod-iz-zapoya-kruglosutochno korolev
Клиника Narcology Clinic в Королёве оказывает профессиональную помощь при запое: выезд нарколога на дом, капельницы, детокс, поддержка круглосуточно. Безопасный вывод из запоя с учётом состояния пациента и полной конфиденциальностью.
Углубиться в тему – вывод из запоя капельница в королеве
Наши специалисты всегда относятся к пациентам с уважением и вниманием, создавая атмосферу доверия и поддержки. Они проводят всестороннее обследование, выявляют причины зависимости и разрабатывают индивидуальные стратегии лечения. Профессионализм и компетентность врачей являются основой успешного восстановления наших пациентов.
Детальнее – https://срочно-вывод-из-запоя.рф/vyvod-iz-zapoya-cena-v-chelyabinske.xn--p1ai/
Врачебный состав клиники “Ресурс здоровья” состоит из высококвалифицированных специалистов в области наркологии. Наши врачи-наркологи имеют обширный опыт работы с зависимыми пациентами и постоянно совершенствуют свои навыки.
Углубиться в тему – https://narco-vivod.ru/vivod-iz-zapoya-v-stacionare-v-krasnodare
Зависимости от психоактивных веществ, таких как алкоголь, наркотики и азартные игры, представляют собой серьёзные проблемы, с которыми сталкиваются многие люди. Эти состояния не только негативно влияют на здоровье, но также разрушительно сказываются на межличностных отношениях, социальной адаптации и профессиональной деятельности. Наркологическая клиника “Новый путь” предлагает комплексное решение для пациентов, нуждающихся в помощи, ориентируясь на индивидуальный подход и использование современных медицинских технологий.
Узнать больше – http://нарко-специалист.рф
Наши ключевые принципы.
Получить больше информации – http://alko-reabcentr.ru
Индивидуализация лечения: Каждый случай рассматривается отдельно, учитывая уникальные особенности пациента, его физическое состояние, предшествующий опыт лечения и социальные факторы. Такой подход позволяет создать максимально эффективный план терапии.
Получить дополнительные сведения – вывод из запоя в стационаре симферополь
Передовые методики
Разобраться лучше – вывод из запоя на дому цена
Каждому пациенту уделяется внимание в зависимости от его уникальных потребностей, что способствует достижению максимальных результатов.
Получить больше информации – срочный вывод из запоя в омске
Нужна срочная помощь? Центр «Alco.Rehab» в Москве предлагает круглосуточный вывод из запоя с выездом на дом.
Ознакомиться с деталями – вывод из запоя капельница в москве
Описание
Изучить вопрос глубже – https://vyvod-iz-zapoya-sochi7.ru/vyvod-iz-zapoya-na-domu-v-sochi
В наркологической клинике «Рестарт» используется комплексный подход к лечению абстинентного синдрома. Наши преимущества:
Выяснить больше – https://snyatie-lomki-rnd7.ru/snyatie-lomki-narkomana-v-rnd
Вывод из запоя в Королёве от Narcology Clinic — квалифицированная помощь на дому и в клинике. Индивидуальный подбор препаратов, поддержка психики и организма, круглосуточный приём и сопровождение пациента.
Изучить вопрос глубже – narkolog-vyvod-iz-zapoya korolev
Описание
Исследовать вопрос подробнее – вывод из запоя на дому цена
Запой не проходит самостоятельно, и если он длится несколько дней, организм начинает страдать от накопления токсинов. В этом случае необходимо немедленно обратиться за помощью к профессионалам, чтобы предотвратить развитие опасных осложнений.
Узнать больше – http://наркология-помощь.рф/vyvod-iz-zapoya-anonimno-rostov-na-donu/
В клинике Narcology Clinic (Королёв) вывод из запоя проводится по современным протоколам. Медикаментозная капельница, восстановление сна и давления, сопровождение до полной стабилизации. Безопасная и безосуждающая помощь.
Подробнее можно узнать тут – вывод из запоя анонимно
Когда следует немедленно обращаться за помощью:
Выяснить больше – http://алко-ребцентр.рф
Самостоятельно выйти из запоя сложно и опасно. В Narcology Clinic (Королёв) вам помогут вернуться в трезвое состояние без боли, страха и последствий. Эффективный и безопасный метод с возможностью круглосуточного выезда.
Получить больше информации – вывод из запоя круглосуточно
Выезд нарколога на дом в Москве — услуга вывода из запоя от центра «Alco.Rehab». Работают круглосуточно.
Выяснить больше – вывод из запоя круглосуточно город москва
В нашем центре доступны следующие виды помощи:
Ознакомиться с деталями – http://narko-zakodirovat.ru/vivod-iz-zapoya-v-kruglosutochno-v-tveri/
Таким образом, мы создаём систему поддержки, позволяющую каждому пациенту успешно справляться с зависимостью и вернуться к полноценной жизни.
Изучить вопрос глубже – вывод из запоя цена
Надёжный способ прервать запой — услуги клиники «Alco.Rehab» в Москве. Профессиональный подход и анонимность гарантированы.
Изучить вопрос глубже – вывод из запоя клиника
Наркологическая клиника “Ресурс здоровья” — специализированное медицинское учреждение, предназначенное для оказания профессиональной помощи лицам, страдающим от алкогольной и наркотической зависимости. Наша цель — предоставить эффективные методы лечения и поддержку, чтобы помочь пациентам преодолеть пагубное пристрастие и восстановить контроль над своей жизнью.
Получить дополнительную информацию – вывод из запоя на дому круглосуточно краснодар
Описание
Подробнее – http://vyvod-iz-zapoya-sochi77.ru/
Следующий этап — медикаментозная поддержка, которая включает препараты для защиты печени, улучшения работы сердечно-сосудистой системы и снижения симптомов абстиненции. В зависимости от состояния пациента могут применяться седативные и ноотропные препараты, позволяющие стабилизировать психоэмоциональный фон и устранить тревожность.
Подробнее – https://наркология-дома.рф/vyvod-iz-zapoya-czena-v-krasnodare
сервисный ремонт кофемашин сервисный ремонт кофемашин
Преимущество
Детальнее – снятие ломки нарколог
Наши ключевые принципы.
Получить дополнительные сведения – http://alko-reabcentr.ru
Основными направлениями работы нашей клиники являются.
Исследовать вопрос подробнее – https://нарко-специалист.рф/
Таким образом, наш подход ориентирован на создание комплексной системы поддержки, позволяющей каждому пациенту справиться с проблемой зависимости и вернуться к нормальной жизни.
Узнать больше – vyvod-iz-zapoya-klinika simferopol’
Оперативное вмешательство позволяет быстро начать детоксикацию и предотвратить развитие опасных осложнений.
Получить дополнительную информацию – https://vyvod-iz-zapoya-sochi777.ru/
база 1с в облаке 1с бух облако
центр ремонта швейных машин ремонт старых швейных машин
Своевременная помощь позволяет снизить риск осложнений и ускорить процесс детоксикации организма.
Изучить вопрос глубже – снятие ломок
Вывод из запоя в Королёве от Narcology Clinic — квалифицированная помощь на дому и в клинике. Индивидуальный подбор препаратов, поддержка психики и организма, круглосуточный приём и сопровождение пациента.
Изучить вопрос глубже – наркология вывод из запоя в королеве
В клинике Narcology Clinic (Королёв) вывод из запоя проводится по современным протоколам. Медикаментозная капельница, восстановление сна и давления, сопровождение до полной стабилизации. Безопасная и безосуждающая помощь.
Подробнее можно узнать тут – вывод из запоя цена в королеве
Самостоятельно выйти из запоя сложно и опасно. В Narcology Clinic (Королёв) вам помогут вернуться в трезвое состояние без боли, страха и последствий. Эффективный и безопасный метод с возможностью круглосуточного выезда.
Узнать больше – в королеве
Зависимость разрушает семью? Не медлите — обратитесь в московский центр «Alco.Rehab» за квалифицированной помощью.
Исследовать вопрос подробнее – vyvod-iz-zapoya-na-domu moskva
Запой может быть не только физически тяжёлым, но и психологически разрушительным. Поэтому важно вовремя обратиться за помощью. Вывод из запоя в Нижнем Новгороде — это необходимая медицинская процедура, которая помогает победить алкогольную зависимость и восстановить здоровье. Мы в клинике «АнтиЗависимость» предлагаем круглосуточную помощь в комфортных условиях — на дому или в стационаре.
Получить дополнительные сведения – https://алко-ребцентр.рф/vyvod-iz-zapoya-na-domu-nizhnij-novgorod
Эта обзорная заметка содержит ключевые моменты и факты по актуальным вопросам. Она поможет читателям быстро ориентироваться в теме и узнать о самых важных аспектах сегодня. Получите краткий курс по современной информации и оставайтесь в курсе событий!
Следуйте по ссылке – http://www.careyauctioneers.ie/contacts
Этот информационный материал собраны данные, которые помогут лучше понять текущие тенденции и процессы в различных сферах жизни. Мы предоставляем четкий анализ, графики и примеры, чтобы информация была не только понятной, но и практичной для принятия решений.
Узнать напрямую – https://delindekloosterzande.nl/cropped-voorkant-hotel-de-linde-2-jpg
Основные направления нашей работы
Подробнее тут – вывод из запоя капельница в омске
Мы работаем по следующим основным направлениям.
Подробнее – вывод из запоя в стационаре в твери
Таким образом, мы создаём систему поддержки, позволяющую каждому пациенту успешно справляться с зависимостью и вернуться к полноценной жизни.
Подробнее – вывод из запоя цена санкт-петербург.
Врачебный состав клиники “Ресурс здоровья” состоит из высококвалифицированных специалистов в области наркологии. Наши врачи-наркологи имеют обширный опыт работы с зависимыми пациентами и постоянно совершенствуют свои навыки.
Разобраться лучше – http://narco-vivod.ru
Передовые методики
Узнать больше – вывод из запоя в сочи
Таким образом, наша миссия направлена на создание устойчивых изменений в жизни каждого пациента, поддерживая его на всех этапах пути к выздоровлению.
Подробнее можно узнать тут – https://нарко-специалист.рф/vivod-iz-zapoya-v-stacionare-v-Ekaterinburge
Надёжный способ прервать запой — услуги клиники «Alco.Rehab» в Москве. Профессиональный подход и анонимность гарантированы.
Узнать больше – vyvod-iz-zapoya-klinika moskva
Клиника «Детоксика» в Сочи специализируется на комплексном лечении запоя и восстановления здоровья пациентов с индивидуальным подходом. Наши преимущества:
Получить дополнительную информацию – наркологический вывод из запоя в сочи
Процедура занимает от 1,5 до 3 часов, после чего пациент остаётся под наблюдением для оценки эффективности лечения.
Детальнее – http://наркология-помощь.рф
Таким образом, наш подход ориентирован на создание комплексной системы поддержки, позволяющей каждому пациенту справиться с проблемой зависимости и вернуться к нормальной жизни.
Получить дополнительные сведения – https://alko-specialist.ru/
В нашем центре ведут приём врачи-наркологи высшей категории, обладающие многолетним опытом лечения различных видов зависимостей. Они владеют всеми современными методиками детоксикации, купирования абстинентного синдрома, кодирования, фармакотерапии.
Углубиться в тему – http://alko-reabcentr.ru
Клиника Narcology Clinic в Королёве оказывает профессиональную помощь при запое: выезд нарколога на дом, капельницы, детокс, поддержка круглосуточно. Безопасный вывод из запоя с учётом состояния пациента и полной конфиденциальностью.
Ознакомиться с деталями – https://vyvod-iz-zapoya-korolev12.ru
В клинике Narcology Clinic (Королёв) вывод из запоя проводится по современным протоколам. Медикаментозная капельница, восстановление сна и давления, сопровождение до полной стабилизации. Безопасная и безосуждающая помощь.
Детальнее – наркологический вывод из запоя
Предлагаем вашему вниманию интересную справочную статью, в которой собраны ключевые моменты и нюансы по актуальным вопросам. Эта информация будет полезна как для профессионалов, так и для тех, кто только начинает изучать тему. Узнайте ответы на важные вопросы и расширьте свои знания!
Обратитесь за информацией – http://www.evebot.co.za/qw1-jpg
Публикация предлагает уникальную подборку информации, которая будет интересна как специалистам, так и широкому кругу читателей. Здесь вы найдете ответы на часто задаваемые вопросы и полезные инсайты для дальнейшего применения.
Ознакомьтесь с аналитикой – https://mgeservice.com/building-on-your-priorities
В клинике Narcology Clinic (Королёв) вывод из запоя проводится по современным протоколам. Медикаментозная капельница, восстановление сна и давления, сопровождение до полной стабилизации. Безопасная и безосуждающая помощь.
Разобраться лучше – вывод из запоя в стационаре в королеве
В этой статье вы найдете познавательную и занимательную информацию, которая поможет вам лучше понять мир вокруг. Мы собрали интересные данные, которые вдохновляют на размышления и побуждают к действиям. Открывайте новую информацию и получайте удовольствие от чтения!
Смотрите также – https://www.sportsentry.in/fruit-bowl-1600003_1280-1-1
Запой может быть не только физически тяжёлым, но и психологически разрушительным. Поэтому важно вовремя обратиться за помощью. Вывод из запоя в Нижнем Новгороде — это необходимая медицинская процедура, которая помогает победить алкогольную зависимость и восстановить здоровье. Мы в клинике «АнтиЗависимость» предлагаем круглосуточную помощь в комфортных условиях — на дому или в стационаре.
Подробнее тут – http://алко-ребцентр.рф/
Предлагаем вашему вниманию интересную справочную статью, в которой собраны ключевые моменты и нюансы по актуальным вопросам. Эта информация будет полезна как для профессионалов, так и для тех, кто только начинает изучать тему. Узнайте ответы на важные вопросы и расширьте свои знания!
Изучить аспект более тщательно – https://ledimage.it/it/component/k2/item/9-nemo-enim-ipsam-voluptatem?start=250
Зависимости часто сопровождаются физическими и психологическими расстройствами, которые требуют комплексного подхода. Мы понимаем, что успешное лечение невозможно без индивидуального подхода, что делает нашу клинику идеальным местом для тех, кто ищет помощь.
Разобраться лучше – вывод из запоя на дому
Каждый врач клиники обладает глубокими знаниями фармакологии, психофармакологии и психотерапии. Они регулярно посещают профессиональные конференции, семинары и мастер-классы, чтобы быть в курсе новейших достижений в области лечения зависимостей. Такой подход позволяет нашим специалистам применять наиболее эффективные и современные методы терапии.
Подробнее – наркология вывод из запоя краснодар
Публикация предлагает уникальную подборку информации, которая будет интересна как специалистам, так и широкому кругу читателей. Здесь вы найдете ответы на часто задаваемые вопросы и полезные инсайты для дальнейшего применения.
Читать дальше – https://homevoltconcept.be/product/dewalt-dcf620b-20-volt
Таким образом, мы создаём систему поддержки, позволяющую каждому пациенту успешно справляться с зависимостью и вернуться к полноценной жизни.
Разобраться лучше – нарколог вывод из запоя
Мы предлагаем широкий спектр услуг для автовладельцев Оперативность принятия решения о покупке — от покупки новых автомобилей до удобного обмена и быстрого выкупа вашего старого автомобиля. Наша команда профессионалов гарантирует честную оценку, оперативное снятие с учета и быстрое получение расчета прямо на месте всего за 10–20 минут!
В этой статье вы найдете познавательную и занимательную информацию, которая поможет вам лучше понять мир вокруг. Мы собрали интересные данные, которые вдохновляют на размышления и побуждают к действиям. Открывайте новую информацию и получайте удовольствие от чтения!
Изучить вопрос глубже – https://espigaoalerta.com.br/2024/12/07/pat-disponibiliza-548-oportunidades-de-emprego
Таким образом, наша миссия направлена на создание устойчивых изменений в жизни каждого пациента, поддерживая его на всех этапах пути к выздоровлению.
Подробнее – http://нарко-специалист.рф/vivod-iz-zapoya-v-stacionare-v-Ekaterinburge/
Этот информационный материал привлекает внимание множеством интересных деталей и необычных ракурсов. Мы предлагаем уникальные взгляды на привычные вещи и рассматриваем вопросы, которые волнуют общество. Будьте в курсе актуальных тем и расширяйте свои знания!
Получить дополнительные сведения – https://espigaoalerta.com.br/2023/05/25/barretos-sedia-25a-edicao-dos-jogos-da-melhor-idade-jomi-do-estado-de-sp-governo-do-estado-de-sao-paulo-maua-agora
Эта публикация дает возможность задействовать различные источники информации и представить их в удобной форме. Читатели смогут быстро найти нужные данные и получить ответы на интересующие их вопросы. Мы стремимся к четкости и доступности материала для всех!
Подробнее – https://phelionline.co.za/tag/sony-xperia-xz
В этой публикации мы предлагаем подробные объяснения по актуальным вопросам, чтобы помочь читателям глубже понять их. Четкость и структурированность материала сделают его удобным для усвоения и применения в повседневной жизни.
Доступ к полной версии – https://espigaoalerta.com.br/2024/03/25/eua-aprovam-tecnologia-da-ionic-health-empresa-sediada-no-pit
Эта статья для ознакомления предлагает читателям общее представление об актуальной теме. Мы стремимся представить ключевые факты и идеи, которые помогут читателям получить представление о предмете и решить, стоит ли углубляться в изучение.
Информация доступна здесь – https://blog.ricardoarturocabral.com/eletronica-avancada
Индивидуализация лечения: Каждый случай рассматривается отдельно, учитывая уникальные особенности пациента, его физическое состояние, предшествующий опыт лечения и социальные факторы. Такой подход позволяет создать максимально эффективный план терапии.
Получить дополнительные сведения – https://alko-specialist.ru/vivod-iz-zapoya-anonimno-v-simferopole
Зависимость — коварное хроническое заболевание, поражающее не только физическое, но и психическое здоровье человека. Она захватывает волю, разум, искажает восприятие реальности, разрушает семьи и судьбы. Алкоголизм, наркомания, игровая зависимость — всё это грани одной проблемы, требующей комплексного и профессионального подхода.
Углубиться в тему – http://alko-reabcentr.ru/vivod-iz-zapoya-v-stacionare-v-Sankt-Peterburge/
В этой информационной статье вы найдете интересное содержание, которое поможет вам расширить свои знания. Мы предлагаем увлекательный подход и уникальные взгляды на обсуждаемые темы, побуждая пользователей к активному мышлению и критическому анализу.
Заходи — там интересно – https://www.jowasbarbers.co.uk/testimonial/itweb
Этот информационный материал собраны данные, которые помогут лучше понять текущие тенденции и процессы в различных сферах жизни. Мы предоставляем четкий анализ, графики и примеры, чтобы информация была не только понятной, но и практичной для принятия решений.
Расширить кругозор по теме – https://viadiagonalis.nl/via-diagonalis-logo
В нашем центре доступны следующие виды помощи:
Подробнее можно узнать тут – анонимный вывод из запоя
Эта информационная заметка содержит увлекательные сведения, которые могут вас удивить! Мы собрали интересные факты, которые сделают вашу жизнь ярче и полнее. Узнайте нечто новое о привычных аспектах повседневности и откройте для себя удивительный мир информации.
Обратитесь за информацией – https://www.frann.me/?p=4636
Помощь врача-нарколога становится жизненно важной, когда симптомы абстинентного синдрома становятся невыносимыми и угрожают жизни пациента. К числу основных признаков, требующих срочного вмешательства, относятся:
Подробнее – https://snyatie-lomki-rnd77.ru/snyatie-lomki-narkomana-v-rnd
Клиника «Детоксика» в Сочи специализируется на комплексном лечении запоя и восстановления здоровья пациентов с индивидуальным подходом. Наши преимущества:
Узнать больше – помощь вывод из запоя сочи
Алкоголь оказывает глубокое воздействие на здоровье: психоэмоциональное и физическое состояние человека значительно ухудшаются, если злоупотребление продолжается долго. Даже небольшие дозы алкоголя, употребляемые регулярно, вызывают накопление токсинов, которые приводят к расстройствам в работе сердечно-сосудистой системы, печени, почек и других жизненно важных органов.
Подробнее – https://алко-ребцентр.рф/kruglosutochnyj-vyvod-iz-zapoya-nizhnij-novgorod/
Клиника «Доктор Трезвость» в Сочи предлагает современное лечение запоя, основанное на комплексном подходе и индивидуальной программе для каждого пациента. Наши лицензированные специалисты используют передовые методы терапии, что позволяет достичь быстрого и безопасного вывода из запоя, а также создать надежную основу для дальнейшей реабилитации.
Подробнее – вывод из запоя на дому цена сочи
Ниже представлен перечень основных направлений, используемых в современной наркологической помощи. Этот список отражает комплексный подход к лечению зависимостей.
Выяснить больше – скорая наркологическая помощь пермь
Психологическая помощь сопровождает медикаментозное лечение, способствуя преодолению эмоциональных и поведенческих трудностей. Важным элементом является мотивационная работа, направленная на формирование устойчивого стремления к жизни без зависимости.
Ознакомиться с деталями – http://narkologicheskaya-klinika-omsk0.ru
Алкогольный запой является тяжёлым состоянием, требующим срочного медицинского вмешательства. Наркологическая клиника «Пульс» в Краснодаре предлагает эффективную помощь в борьбе с алкогольной зависимостью, используя проверенный метод — капельницу от запоя на дому. Наши специалисты оперативно выезжают по указанному адресу и обеспечивают качественную медицинскую помощь с гарантией конфиденциальности и безопасности.
Узнать больше – капельница от запоя вызов в краснодаре
Лечение наркомании в Омске является сложным медицинским процессом, требующим комплексного подхода и участия квалифицированных специалистов. Современная наркологическая клиника «Ренессанс» предлагает полный спектр услуг, направленных на восстановление физического и психического здоровья пациентов с различными формами наркотической зависимости. В клинике используются доказанные методы терапии, которые обеспечивают стабильную ремиссию и помогают вернуться к полноценной жизни.
Получить дополнительные сведения – лечение наркомании кодирование в омске
Абстинентный синдром, или ломка, — одно из наиболее тяжелых состояний, возникающих у зависимого человека после прекращения употребления наркотиков или алкоголя. Это состояние сопровождается физическими и психическими симптомами, которые становятся практически невыносимыми для пациента и могут привести к серьезным осложнениям без квалифицированной медицинской помощи. Наркологическая клиника «Рестарт» в Ростове-на-Дону специализируется на эффективном и безопасном снятии ломки, предлагая комплексный подход и индивидуальное лечение, направленное на быстрое облегчение состояния и восстановление организма пациента.
Исследовать вопрос подробнее – http://snyatie-lomki-rnd7.ru
Thank you a lot for sharing this with all of us you actually recognize what you’re talking approximately! Bookmarked. Kindly additionally talk over with my site =). We will have a hyperlink change agreement among us
покер румы каталог
maorou k8m maorou_k8m
Описание
Выяснить больше – http://vyvod-iz-zapoya-sochi77.ru
Наркологическая клиника в Твери представляет собой современное медицинское учреждение, специализирующееся на диагностике и лечении алкогольной, наркотической и других видов зависимости. В клинике «Гелиос» применяются инновационные методы терапии, направленные на полное восстановление физического и психологического состояния пациентов.
Выяснить больше – http://narkologicheskaya-klinika-tver0.ru/narkolog-tver-anonimno/
Абстинентный синдром, или ломка, – это тяжелое состояние, которое развивается у зависимых после отказа от наркотиков или алкоголя. Он сопровождается сильными физическими болями, судорогами, повышенной тревожностью, бессонницей и эмоциональными перепадами, что может привести к серьезным осложнениям для здоровья. Наркологическая клиника «Здравица» в Ростове-на-Дону предлагает комплексное лечение абстинентного синдрома, используя передовые методики и индивидуальный подход для быстрого восстановления здоровья.
Детальнее – снятие ломок на дому
Капельница от запоя рекомендуется врачами-наркологами в тех случаях, когда организм уже не может самостоятельно справляться с последствиями алкогольной интоксикации. Особенно важно оперативно обратиться за помощью, если отмечаются следующие симптомы:
Углубиться в тему – http://kapelnica-ot-zapoya-krasnodar777.ru/kapelnicza-ot-zapoya-czena-v-krasnodare/
Многие люди с зависимостью или их близкие начинают путь к избавлению от наркомании с самолечения или обращения к народным методам. К сожалению, такой путь почти всегда заканчивается рецидивом. Причина в том, что наркотическая зависимость формируется на нескольких уровнях — физиологическом, психологическом и социальном. Без системного подхода устойчивой ремиссии достичь невозможно. Профессиональное лечение в «РеабПермь» позволяет воздействовать на все механизмы заболевания, включая биохимические нарушения, искажённые модели мышления и нарушения в структуре личности, которые провоцируют употребление.
Исследовать вопрос подробнее – лечение наркомании на дому в перми
Лечение начинается с всестороннего обследования, которое позволяет оценить стадию зависимости и общее состояние пациента. Это обследование помогает сформировать персонализированную программу терапии, учитывающую все особенности конкретного случая. Медикаментозное лечение направлено на детоксикацию, устранение абстинентного синдрома и поддержку функций жизненно важных органов.
Получить больше информации – наркологическая клиника лечение алкоголизма в омске
В зависимости от состояния пациента и пожеланий семьи наркологическая помощь может быть оказана в одном из нескольких форматов: на дому, в стационаре или дистанционно. Каждый из форматов обеспечивает доступ к медицинской помощи без бюрократии и с сохранением полной конфиденциальности.
Подробнее тут – экстренная наркологическая помощь омск
Наши усилия направлены на то, чтобы вернуть пациентам уверенность в себе, здоровье и качество жизни.
Углубиться в тему – наркологический вывод из запоя омск
Right now it looks like Movable Type is the top blogging platform available right now. (from what I’ve read) Is that what you are using on your blog?
https://telegra.ph/Sklo-fari-z-nanopokrittyam-chi-varte-vono-%D1%96nvestic%D1%96j-08-12
Преимущество
Детальнее – http://kapelnica-ot-zapoya-krasnodar77.ru/
Алкогольный запой является тяжёлым состоянием, требующим срочного медицинского вмешательства. Наркологическая клиника «Пульс» в Краснодаре предлагает эффективную помощь в борьбе с алкогольной зависимостью, используя проверенный метод — капельницу от запоя на дому. Наши специалисты оперативно выезжают по указанному адресу и обеспечивают качественную медицинскую помощь с гарантией конфиденциальности и безопасности.
Получить дополнительную информацию – капельница от запоя на дому цена в краснодаре
В период восстановления пациент получает психологическую поддержку, работает с психотерапевтом, осваивает навыки самоконтроля, учится противостоять стрессу без возвращения к прежним привычкам. После выписки возможно амбулаторное сопровождение, дистанционные консультации и поддержка для всей семьи.
Углубиться в тему – https://narkologicheskaya-klinika-balashiha5.ru/chastnaya-narkologicheskaya-klinika-v-balashihe
Каждый пациент в «НаркоМедцентре» в Балашихе с самого начала окружён вниманием и заботой. Сразу после обращения по телефону или через сайт медицинский персонал консультирует родственников, уточняет детали состояния, даёт рекомендации по первой помощи и при необходимости отправляет бригаду наркологов на дом. В случае тяжёлых абстинентных проявлений возможно экстренное транспортирование пациента в стационар.
Подробнее – нарколог вывод из запоя
Ниже представлен перечень основных направлений, используемых в современной наркологической помощи. Этот список отражает комплексный подход к лечению зависимостей.
Разобраться лучше – частная наркологическая помощь пермь
Помощь врача-нарколога становится жизненно важной, когда симптомы абстинентного синдрома становятся невыносимыми и угрожают жизни пациента. К числу основных признаков, требующих срочного вмешательства, относятся:
Подробнее – снятие ломки на дому
В зависимости от тяжести состояния подбирается индивидуальная программа детоксикации. В неё входят: — Инфузионная терапия (капельницы) для очищения организма от токсинов; — Поддерживающие препараты для работы сердца, печени, нервной системы; — Симптоматическое лечение (устранение рвоты, судорог, бессонницы); — Витамины и средства для восстановления водно-солевого баланса.
Выяснить больше – наркологическая клиника на дом
Для повышения эффективности терапии применяются физиотерапевтические процедуры и витаминные комплексы, которые ускоряют восстановление и повышают сопротивляемость организма стрессам.
Получить дополнительную информацию – http://www.domen.ru
Лечение наркомании в Омске является сложным медицинским процессом, требующим комплексного подхода и участия квалифицированных специалистов. Современная наркологическая клиника «Ренессанс» предлагает полный спектр услуг, направленных на восстановление физического и психического здоровья пациентов с различными формами наркотической зависимости. В клинике используются доказанные методы терапии, которые обеспечивают стабильную ремиссию и помогают вернуться к полноценной жизни.
Детальнее – http://lechenie-narkomanii-omsk0.ru/lechenie-narkomanii-i-alkogolizma-v-omske/
Клиника «Орион-Клиник» располагает собственной лабораторией и оснащением для аппаратных методик, что позволяет проводить все этапы лечения под одним крышей. Наши врачи имеют международные сертификаты по наркологии и гипнотерапии, а психологи прошли дополнительное обучение по работе с зависимостями. Мы гарантируем:
Разобраться лучше – https://kodirovanie-ot-alkogolizma-pushkino4.ru/
Услуга
Исследовать вопрос подробнее – http://narkolog-na-dom-ramenskoe4.ru/narkolog-na-dom-anonimno-v-ramenskom/
Описание
Получить больше информации – https://vyvod-iz-zapoya-sochi7.ru/vyvod-iz-zapoya-na-domu-v-sochi
Оперативное вмешательство позволяет быстро начать детоксикацию и предотвратить развитие опасных осложнений.
Получить дополнительную информацию – вывод из запоя с выездом
В зависимости от состояния пациента и пожеланий семьи наркологическая помощь может быть оказана в одном из нескольких форматов: на дому, в стационаре или дистанционно. Каждый из форматов обеспечивает доступ к медицинской помощи без бюрократии и с сохранением полной конфиденциальности.
Подробнее тут – вызов наркологической помощи омск
Метод
Получить дополнительную информацию – наркологическая клиника клиника помощь
Основа устойчивого выздоровления — не просто отказ от употребления, а проработка внутренних конфликтов и изменение отношения к себе и жизни. В клинике «РеабПермь» пациент получает доступ к индивидуальной терапии с опытным психотерапевтом, а также к различным видам групповой работы. В зависимости от психологического профиля применяются элементы КПТ (когнитивно-поведенческой терапии), гештальт-терапии, системного подхода и мотивационного консультирования. Акцент делается на выработке новых моделей поведения, управлении эмоциями, восстановлении самооценки и личных границ.
Получить дополнительные сведения – лечение наркомании кодирование в перми
Распознать необходимость лечения просто: достаточно внимательно отнестись к тревожным признакам. Вот лишь некоторые ситуации, когда обращение в наркологическую клинику становится жизненно важным:
Получить дополнительную информацию – narkologicheskaya-klinika
Описание
Изучить вопрос глубже – снятие ломки анонимно в краснодаре
Игнорирование этих симптомов может привести к тяжелым последствиям для здоровья, включая алкогольный психоз и повреждение внутренних органов.
Подробнее – капельница от запоя на дому краснодар.
В наркологической клинике «Рестарт» используется комплексный подход к лечению абстинентного синдрома. Наши преимущества:
Ознакомиться с деталями – нарколог на дом снятие ломки в краснодаре
Если узнаёте подобные признаки у себя или у родственника — не ждите кризиса. Чем быстрее обратиться за профессиональной поддержкой, тем легче вернуть здоровье и гармонию в семью.
Детальнее – medicinskoe-lechenie-alkogolizma
Многодневные алкогольные запои опасны не только для здоровья, но и для жизни. В этот период организм подвергается тяжелейшей интоксикации, страдают сердце, печень, нервная система, а психоэмоциональное состояние может выйти из-под контроля. Самостоятельно выйти из запоя очень трудно и опасно: любое промедление или попытка “перетерпеть” чреваты судорогами, галлюцинациями, инфарктом, тяжелой депрессией или делирием. Именно поэтому своевременное обращение к профессионалам — залог не только скорого, но и безопасного восстановления. В наркологической клинике «НаркоМедцентр» в Балашихе организован современный и медицински обоснованный вывод из запоя: здесь пациентов ждет индивидуальный подход, круглосуточное медицинское наблюдение и полная конфиденциальность.
Узнать больше – быстрый вывод из запоя
Сигналы, указывающие на потребность в наркологической помощи, часто игнорируются либо недооцениваются. Очень важно не пропустить тревожные симптомы, такие как:
Углубиться в тему – https://narkologicheskaya-klinika-podolsk5.ru/narkologicheskaya-klinika-stacionar-v-podolske
Медикаментозная терапия направлена на снятие симптомов абстиненции, нормализацию функций органов и систем, а также коррекцию психоэмоционального состояния пациента. Используются препараты, способствующие детоксикации, стабилизации работы нервной системы и улучшению общего самочувствия.
Узнать больше – https://narkologicheskaya-pomoshh-perm0.ru
Психологическая помощь сопровождает медикаментозное лечение, способствуя преодолению эмоциональных и поведенческих трудностей. Важным элементом является мотивационная работа, направленная на формирование устойчивого стремления к жизни без зависимости.
Подробнее можно узнать тут – http://narkologicheskaya-klinika-omsk0.ru/
Лечение наркомании в Омске является сложным медицинским процессом, требующим комплексного подхода и участия квалифицированных специалистов. Современная наркологическая клиника «Ренессанс» предлагает полный спектр услуг, направленных на восстановление физического и психического здоровья пациентов с различными формами наркотической зависимости. В клинике используются доказанные методы терапии, которые обеспечивают стабильную ремиссию и помогают вернуться к полноценной жизни.
Подробнее можно узнать тут – лечение алкоголизма и наркомании центр омск
Преимущество
Ознакомиться с деталями – http://
Наши усилия направлены на то, чтобы вернуть пациентам уверенность в себе, здоровье и качество жизни.
Разобраться лучше – вывод из запоя в омске
Описание
Подробнее – https://snyatie-lomki-rnd77.ru/snyatie-lomki-narkomana-v-rnd
Зависимость от алкоголя или наркотиков — серьёзная проблема, которая постепенно разрушает жизнь, подрывает здоровье, нарушает семейные отношения и ведёт к социальной изоляции. Попытки самостоятельно справиться с заболеванием редко приводят к успеху и зачастую только усугубляют ситуацию. Важно не терять время и обращаться за профессиональной помощью. В наркологической клинике «Наркосфера» в Балашихе пациентов ждёт современное оборудование, команда опытных специалистов, индивидуальный подход и абсолютная анонимность.
Изучить вопрос глубже – chastnaya-narkologicheskaya-klinika
В подобных случаях вывод из запоя в домашних условиях без врачебного контроля крайне опасен и может привести к тяжёлым последствиям. Лучше сразу вызвать нарколога или привезти пациента в клинику — это поможет избежать критических осложнений.
Детальнее – vyvod-iz-zapoya-klinika
Алкогольный запой является тяжёлым состоянием, требующим срочного медицинского вмешательства. Наркологическая клиника «Пульс» в Краснодаре предлагает эффективную помощь в борьбе с алкогольной зависимостью, используя проверенный метод — капельницу от запоя на дому. Наши специалисты оперативно выезжают по указанному адресу и обеспечивают качественную медицинскую помощь с гарантией конфиденциальности и безопасности.
Изучить вопрос глубже – капельница от запоя выезд в краснодаре
Наркологическая клиника в Омске оказывает квалифицированную помощь пациентам, страдающим от различных видов зависимости. Основой успешного лечения является комплексный подход, который включает тщательную диагностику, медикаментозное сопровождение, психологическую поддержку и реабилитационные программы. В «АльфаМед» применяются передовые технологии и индивидуальные методики, направленные на восстановление здоровья и предупреждение рецидивов.
Ознакомиться с деталями – запой наркологическая клиника в омске
Наша наркологическая клиника успешно помогает пациентам с различной степенью алкогольной зависимости. Преимущества клиники «Перспектива» представлены в таблице ниже:
Ознакомиться с деталями – вызвать капельницу от запоя
Многие люди с зависимостью или их близкие начинают путь к избавлению от наркомании с самолечения или обращения к народным методам. К сожалению, такой путь почти всегда заканчивается рецидивом. Причина в том, что наркотическая зависимость формируется на нескольких уровнях — физиологическом, психологическом и социальном. Без системного подхода устойчивой ремиссии достичь невозможно. Профессиональное лечение в «РеабПермь» позволяет воздействовать на все механизмы заболевания, включая биохимические нарушения, искажённые модели мышления и нарушения в структуре личности, которые провоцируют употребление.
Получить дополнительные сведения – наркологическое лечение наркомания в перми
Сигналы, указывающие на потребность в наркологической помощи, часто игнорируются либо недооцениваются. Очень важно не пропустить тревожные симптомы, такие как:
Получить больше информации – наркологическая клиника на дом
После завершения детоксикации и подготовки организма врач-нарколог приступает к основной процедуре. В зависимости от выбранного метода это может быть внутримышечная или внутривенная инъекция препарата пролонгированного действия, гипнотическая сессия или подключение аппарата для электроимпульсного кодирования. Эта часть занимает от получаса до двух часов, включая время на объяснение техники и адаптацию пациента. Во время сеанса психолог присутствует для поддержки и контроля эмоционального состояния. По завершении врач остаётся рядом ещё один-два часа, внимательно наблюдая за общим состоянием, фиксируя показания давления и сердечного ритма, а при необходимости корректируя терапию. Пациент получает подробные письменные рекомендации: список запрещённых веществ и медикаментов, график приёма поддерживающих препаратов и расписание контрольных визитов для оценки эффективности кодирования.
Получить дополнительную информацию – http://kodirovanie-ot-alkogolizma-pushkino4.ru/kodirovanie-ot-alkogolizma-ceny-v-pushkino/
Клиника придерживается принципа прозрачного ценообразования. Пациенту или родственникам сразу озвучивается стоимость всех процедур и услуг. Возможна оплата поэтапно или в рамках пакета. В отличие от многих клиник, «ОмскПрофи» предоставляет фиксированные цены на распространённые виды помощи, без скрытых доплат.
Выяснить больше – нарколог наркологическая помощь омск
Ниже представлен перечень основных направлений, используемых в современной наркологической помощи. Этот список отражает комплексный подход к лечению зависимостей.
Исследовать вопрос подробнее – наркологическая помощь в перми
Алкогольная и наркотическая зависимости представляют собой серьёзные заболевания, мгновенно нарушающие работу жизненно важных систем организма и провоцирующие как физические, так и психические осложнения. Во время абстиненции клетки страдают от кислородного голодания, нарушается метаболизм, падает артериальное давление, учащается пульс. Острые психоэмоциональные расстройства — паника, агрессия, галлюцинации — создают угрозу для жизни и требуют незамедлительного вмешательства профессионального нарколога. Попытки самолечения или «перетерпеть» состояние зачастую заканчиваются судорогами, комой или осложнениями, опасными для здоровья.
Получить больше информации – http://narkolog-na-dom-ramenskoe4.ru/
Лечение начинается с всестороннего обследования, которое позволяет оценить стадию зависимости и общее состояние пациента. Это обследование помогает сформировать персонализированную программу терапии, учитывающую все особенности конкретного случая. Медикаментозное лечение направлено на детоксикацию, устранение абстинентного синдрома и поддержку функций жизненно важных органов.
Получить больше информации – https://narkologicheskaya-klinika-omsk0.ru
Многодневные алкогольные запои опасны не только для здоровья, но и для жизни. В этот период организм подвергается тяжелейшей интоксикации, страдают сердце, печень, нервная система, а психоэмоциональное состояние может выйти из-под контроля. Самостоятельно выйти из запоя очень трудно и опасно: любое промедление или попытка “перетерпеть” чреваты судорогами, галлюцинациями, инфарктом, тяжелой депрессией или делирием. Именно поэтому своевременное обращение к профессионалам — залог не только скорого, но и безопасного восстановления. В наркологической клинике «НаркоМедцентр» в Балашихе организован современный и медицински обоснованный вывод из запоя: здесь пациентов ждет индивидуальный подход, круглосуточное медицинское наблюдение и полная конфиденциальность.
Получить дополнительную информацию – vyvod-iz-zapoya-na-domu-nedorogo
Зависимость от алкоголя или наркотиков — серьёзная проблема, которая постепенно разрушает жизнь, подрывает здоровье, нарушает семейные отношения и ведёт к социальной изоляции. Попытки самостоятельно справиться с заболеванием редко приводят к успеху и зачастую только усугубляют ситуацию. Важно не терять время и обращаться за профессиональной помощью. В наркологической клинике «Наркосфера» в Балашихе пациентов ждёт современное оборудование, команда опытных специалистов, индивидуальный подход и абсолютная анонимность.
Подробнее – частная наркологическая клиника
После прохождения этапа детоксикации и стабилизации состояния начинается длительный период реабилитации, который направлен на укрепление достигнутых результатов и предотвращение рецидивов. Важно, что в наркологической клинике «Ренессанс» реализуется индивидуальный подход к каждому пациенту с учётом его психосоциального окружения.
Получить больше информации – http://lechenie-narkomanii-omsk0.ru/lechenie-narkomanii-i-alkogolizma-v-omske/
Своевременная установка капельницы поможет быстро восстановить организм и избежать развития тяжёлых осложнений.
Получить дополнительную информацию – после капельницы от запоя
Если пациент находится в остром состоянии — начинается с детоксикации. Это не только капельницы для вывода токсинов и восстановления баланса в организме, но и поддержка работы сердца, печени, почек, купирование тревоги и бессонницы, снятие судорог, коррекция давления. Весь процесс проходит под наблюдением опытного нарколога, который учитывает хронические заболевания, особенности организма, степень интоксикации.
Подробнее тут – https://lechenie-alkogolizma-korolev5.ru/lechenie-alkogolizma-cena-v-koroleve
В этой статье вы найдете познавательную и занимательную информацию, которая поможет вам лучше понять мир вокруг. Мы собрали интересные данные, которые вдохновляют на размышления и побуждают к действиям. Открывайте новую информацию и получайте удовольствие от чтения!
Обратитесь за информацией – https://cuidatelife.com/proteger-la-vista
Игнорирование этих симптомов может привести к тяжелым последствиям для здоровья, включая алкогольный психоз и повреждение внутренних органов.
Детальнее – https://kapelnica-ot-zapoya-krasnodar7.ru/kapelnicza-ot-zapoya-na-domu-v-krasnodare
Сигналы, указывающие на потребность в наркологической помощи, часто игнорируются либо недооцениваются. Очень важно не пропустить тревожные симптомы, такие как:
Ознакомиться с деталями – chastnaya-narkologicheskaya-klinika
Многие люди с зависимостью или их близкие начинают путь к избавлению от наркомании с самолечения или обращения к народным методам. К сожалению, такой путь почти всегда заканчивается рецидивом. Причина в том, что наркотическая зависимость формируется на нескольких уровнях — физиологическом, психологическом и социальном. Без системного подхода устойчивой ремиссии достичь невозможно. Профессиональное лечение в «РеабПермь» позволяет воздействовать на все механизмы заболевания, включая биохимические нарушения, искажённые модели мышления и нарушения в структуре личности, которые провоцируют употребление.
Ознакомиться с деталями – http://lechenie-narkomanii-perm0.ru/perm-narkologiya/
Этот информационный обзор станет отличным путеводителем по актуальным темам, объединяющим важные факты и мнения экспертов. Мы исследуем ключевые идеи и представляем их в доступной форме для более глубокого понимания. Читайте, чтобы оставаться в курсе событий!
Более того — здесь – https://rvctitans.com/2022/09/15/our-new-home
Ниже представлена таблица, отражающая основные направления медикаментозного лечения и сопутствующих процедур:
Исследовать вопрос подробнее – наркологическая клиника лечение алкоголизма в омске
Многодневные алкогольные запои опасны не только для здоровья, но и для жизни. В этот период организм подвергается тяжелейшей интоксикации, страдают сердце, печень, нервная система, а психоэмоциональное состояние может выйти из-под контроля. Самостоятельно выйти из запоя очень трудно и опасно: любое промедление или попытка “перетерпеть” чреваты судорогами, галлюцинациями, инфарктом, тяжелой депрессией или делирием. Именно поэтому своевременное обращение к профессионалам — залог не только скорого, но и безопасного восстановления. В наркологической клинике «НаркоМедцентр» в Балашихе организован современный и медицински обоснованный вывод из запоя: здесь пациентов ждет индивидуальный подход, круглосуточное медицинское наблюдение и полная конфиденциальность.
Изучить вопрос глубже – https://vyvod-iz-zapoya-balashiha5.ru/
Чем раньше начато лечение, тем выше вероятность полного восстановления здоровья без тяжёлых последствий для организма и психики. В клинике «Наркосфера» к каждому случаю подходят максимально внимательно и индивидуально.
Разобраться лучше – chastnaya-narkologicheskaya-klinika-v-balashihe
Эта публикация завернет вас в вихрь увлекательного контента, сбрасывая стереотипы и открывая двери к новым идеям. Каждый абзац станет для вас открытием, полным ярких примеров и впечатляющих достижений. Подготовьтесь быть вовлеченными и удивленными каждый раз, когда продолжите читать.
Продолжить изучение – https://www.crufaoci.org/jacques-fame-ndongo-a-dschang
В этой информационной статье вы найдете интересное содержание, которое поможет вам расширить свои знания. Мы предлагаем увлекательный подход и уникальные взгляды на обсуждаемые темы, побуждая пользователей к активному мышлению и критическому анализу.
Следуйте по ссылке – https://ramirezpedrosa.com/banking/the-pros-and-cons-of-different-investment-vehicles
Эта статья предлагает живое освещение актуальной темы с множеством интересных фактов. Мы рассмотрим ключевые моменты, которые делают данную тему важной и актуальной. Подготовьтесь к насыщенному путешествию по неизвестным аспектам и узнайте больше о значимых событиях.
Секреты успеха внутри – https://yogasociaalbreda.nl/?p=193
Своевременная помощь позволяет снизить риск осложнений и ускорить процесс детоксикации организма.
Ознакомиться с деталями – снятие наркологической ломки в краснодаре
Эта публикация завернет вас в вихрь увлекательного контента, сбрасывая стереотипы и открывая двери к новым идеям. Каждый абзац станет для вас открытием, полным ярких примеров и впечатляющих достижений. Подготовьтесь быть вовлеченными и удивленными каждый раз, когда продолжите читать.
Что ещё нужно знать? – https://jp.yokoreikanokimura.com/calendar/yoko_hikaru_duo_3
Публикация приглашает вас исследовать неизведанное — от древних тайн до современных достижений науки. Вы узнаете, как случайные находки превращались в революции, а смелые мысли — в новые эры человеческого прогресса.
Подробная информация доступна по запросу – https://doonlogistics.com/embracing-the-wonders-of-the-natural-world
В этой статье вы найдете познавательную и занимательную информацию, которая поможет вам лучше понять мир вокруг. Мы собрали интересные данные, которые вдохновляют на размышления и побуждают к действиям. Открывайте новую информацию и получайте удовольствие от чтения!
Посмотреть подробности – http://okashiyanon.com/2019/12/26/%E8%A9%A6%E4%BD%9C%E8%8B%A6%E6%88%A6%E4%B8%AD2020%E5%B9%B4ver
Мы предлагаем вам подробное руководство, основанное на проверенных источниках и реальных примерах. Каждая часть публикации направлена на то, чтобы помочь вам разобраться в сложных вопросах и применить знания на практике.
Узнать напрямую – https://sharenting.it/2020/07/16/test-sharenting-corriere-it
Специалисты, выезжающие на дом, оснащены всем необходимым для оказания полноценной помощи. Это переносное диагностическое оборудование, препараты для снятия симптомов абстиненции, инфузионные растворы, противосудорожные средства, седативные препараты и витаминные комплексы. Наличие мини-аптечки позволяет адаптировать лечение прямо на месте и избежать лишних госпитализаций.
Детальнее – неотложная наркологическая помощь владимир
Pretty section of content. I just stumbled upon your site and in accession capital to assert that I get actually enjoyed account your blog posts. Any way I will be subscribing to your feeds and even I achievement you access consistently fast.
Производство очистных сооружений
Мы предлагаем вам подробное руководство, основанное на проверенных источниках и реальных примерах. Каждая часть публикации направлена на то, чтобы помочь вам разобраться в сложных вопросах и применить знания на практике.
Обратиться к источнику – https://icskorea.co.kr/bbs/board.php?bo_table=free&wr_id=11889&sst=wr_datetime&sod=desc&sop=and&page=803
В этой публикации мы предлагаем подробные объяснения по актуальным вопросам, чтобы помочь читателям глубже понять их. Четкость и структурированность материала сделают его удобным для усвоения и применения в повседневной жизни.
Погрузиться в научную дискуссию – https://www.aeroourinhos.com.br/datas-comemorativas/dia-dos-pais
Эта публикация завернет вас в вихрь увлекательного контента, сбрасывая стереотипы и открывая двери к новым идеям. Каждый абзац станет для вас открытием, полным ярких примеров и впечатляющих достижений. Подготовьтесь быть вовлеченными и удивленными каждый раз, когда продолжите читать.
Обратитесь за информацией – https://gofly.global/hello-world
В этой информационной статье вы найдете интересное содержание, которое поможет вам расширить свои знания. Мы предлагаем увлекательный подход и уникальные взгляды на обсуждаемые темы, побуждая пользователей к активному мышлению и критическому анализу.
Заходи — там интересно – https://consulting-solaris.com/cambio-climatico
В этой статье представлен занимательный и актуальный контент, который заставит вас задуматься. Мы обсуждаем насущные вопросы и проблемы, а также освещаем истории, которые вдохновляют на действия и изменения. Узнайте, что стоит за событиями нашего времени!
Подробнее можно узнать тут – https://sriwijayaplus.com/ini-rahasia-lucinta-luna-bisa-membuat-semua-pria-ketagihan/2
В данной обзорной статье представлены интригующие факты, которые не оставят вас равнодушными. Мы критикуем и анализируем события, которые изменили наше восприятие мира. Узнайте, что стоит за новыми открытиями и как они могут изменить ваше восприятие реальности.
Ознакомиться с деталями – https://boshcornerstone.org/understanding-electrical-codes-a-guide-for-diy-enthusiasts
В этой публикации мы предлагаем подробные объяснения по актуальным вопросам, чтобы помочь читателям глубже понять их. Четкость и структурированность материала сделают его удобным для усвоения и применения в повседневной жизни.
Посмотреть подробности – https://mhipcor.com/new-site
Эта статья для ознакомления предлагает читателям общее представление об актуальной теме. Мы стремимся представить ключевые факты и идеи, которые помогут читателям получить представление о предмете и решить, стоит ли углубляться в изучение.
Только для своих – https://apotheke-am-ukb.de/apo_logo_rz
В этой информационной статье вы найдете интересное содержание, которое поможет вам расширить свои знания. Мы предлагаем увлекательный подход и уникальные взгляды на обсуждаемые темы, побуждая пользователей к активному мышлению и критическому анализу.
Более того — здесь – https://www.iheir13.com/5214.html
Оперативное вмешательство позволяет быстро начать детоксикацию и предотвратить развитие опасных осложнений.
Подробнее можно узнать тут – http://vyvod-iz-zapoya-sochi777.ru/vyvod-iz-zapoya-cena-v-sochi/
Этот информативный текст выделяется своими захватывающими аспектами, которые делают сложные темы доступными и понятными. Мы стремимся предложить читателям глубину знаний вместе с разнообразием интересных фактов. Откройте новые горизонты и развивайте свои способности познавать мир!
Узнать напрямую – https://joinkite.org/kite-team-derek-hsu
Предлагаем вашему вниманию интересную справочную статью, в которой собраны ключевые моменты и нюансы по актуальным вопросам. Эта информация будет полезна как для профессионалов, так и для тех, кто только начинает изучать тему. Узнайте ответы на важные вопросы и расширьте свои знания!
Смотри, что ещё есть – https://tlhr-iq.org/%D8%A7%D9%84%D8%B2%D9%8A%D8%A7%D8%B1%D8%A7%D8%A9-%D8%A7%D9%84%D8%AF%D9%88%D8%B1%D9%8A%D9%87-%D9%84%D8%A7%D8%B5%D9%84%D8%A7%D8%AD%D9%8A%D8%A9-%D8%AA%D8%A7%D9%87%D9%8A%D9%84-%D8%A7%D9%84%D8%B4%D8%A8
Этот текст сочетает в себе элементы познавательного рассказа и аналитической подачи информации. Читатель получает доступ к уникальным данным, которые соединяют прошлое с настоящим и открывают двери в будущее.
Все материалы собраны здесь – https://theshca.org.uk/temple-visit
Клиника «Детоксика» в Сочи предлагает эффективное лечение запоя по доступным ценам с использованием современных методов и индивидуального подхода. Наши основные преимущества:
Выяснить больше – вывод из запоя с выездом сочи
Чрезмерное употребление алкоголя приводит к отравлению организма, негативно сказываясь на работе внутренних органов, уровне жидкости и общем самочувствии. Длительные запои сопровождаются тяжёлыми последствиями, включая нарушения сердечной деятельности, сбои в работе печени, скачки давления и психоэмоциональные расстройства.
Получить больше информации – капельница от запоя
Кроме того, врач оказывает психологическую поддержку, которая помогает пациенту справиться с чувством тревоги, депрессией и страхом, возникающими на фоне зависимости.
Получить дополнительную информацию – https://narcolog-na-dom-v-krasnoyarske55.ru
Передовые методики
Подробнее можно узнать тут – вывод из запоя вызов на дом в сочи
Please let me know if you’re looking for a author for your weblog. You have some really great posts and I feel I would be a good asset. If you ever want to take some of the load off, I’d really like to write some articles for your blog in exchange for a link back to mine. Please shoot me an email if interested. Cheers!
tether to cash
Экстренная помощь при алкоголизме от Narcology Clinic в Москве — выезд врачей в любую точку города, купирование острых состояний, поддержка пациента до стабильного состояния, профессионально и в конфиденциальности.
Разобраться лучше – анонимная наркологическая помощь
Наркологическая помощь в Новокузнецке представляет собой комплекс профессиональных медицинских мероприятий, направленных на диагностику, лечение и реабилитацию пациентов с алкогольной и наркотической зависимостью. В клинике «Альтернатива» помощь оказывается на всех этапах заболевания, что позволяет добиться стойких положительных результатов и восстановления качества жизни.
Получить дополнительную информацию – срочная наркологическая помощь в новокузнецке
Для оказания полноценной помощи вне стен клиники специалисты «ТверьМед» используют портативные устройства: инфузоматы, ЭКГ-мониторы, глюкометры, пульсоксиметры, небулайзеры и наборы медикаментов. Все врачи обучены работе в полевых условиях и готовы к экстренным ситуациям. Отдельное внимание уделяется стерильности и безопасности: используются одноразовые расходники, врач носит маску, перчатки и защитный халат. При необходимости на выезд направляется параллельно медсестра или ассистент с расширенным функционалом.
Выяснить больше – наркологическая психиатрическая помощь тверь
Narcology Clinic в Москве оказывает экстренную наркологическую помощь дома — скорая выездная служба выполняет детоксикацию, капельницы и мониторинг до нормализации состояния. Анонимно и круглосуточно.
Углубиться в тему – вызов скорой наркологической помощи
Наркозависимость — это не просто вредная привычка, а тяжёлое хроническое заболевание, требующее комплексного и последовательного лечения. В клинике «РеабКузбасс» в Новокузнецке разработаны персонализированные программы помощи, учитывающие медицинские, психологические и социальные аспекты проблемы. Каждому пациенту подбирается уникальный маршрут восстановления, начиная с первичной диагностики и заканчивая адаптацией к жизни без наркотиков. Поддержка оказывается круглосуточно, с полным соблюдением конфиденциальности. Психотерапевты и врачи работают в тесной связке, чтобы не только устранить физическую зависимость, но и восстановить личность пациента, вернуть ему мотивацию к жизни и уверенность в будущем.
Изучить вопрос глубже – центр анонимного лечения наркомании новокузнецк
This is the right webpage for anybody who would like to find out about this topic. You understand so much its almost hard to argue with you (not that I actually would want to…HaHa). You certainly put a brand new spin on a subject that’s been written about for decades. Wonderful stuff, just wonderful!
Seattle chauffeur service
Экстренная помощь при алкоголизме от Narcology Clinic в Москве — выезд врачей в любую точку города, купирование острых состояний, поддержка пациента до стабильного состояния, профессионально и в конфиденциальности.
Подробнее – скорая наркологическая помощь
Оказание помощи нарколога на дому организовано по отлаженной схеме, включающей несколько ключевых этапов, которые позволяют оперативно стабилизировать состояние пациента и начать детоксикацию:
Подробнее можно узнать тут – http://наркология-дома1.рф
Если требуется экстренная помощь при алкогольном кризисе — Narcology Clinic Москва предоставляет срочную помощь на дому: выезд нарколога, купирование симптомов, мониторинг состояния, без очередей и задержек.
Детальнее – центр наркологической помощи
Правильный подбор лекарственных средств позволяет не только уменьшить проявления синдрома отмены, но и стабилизировать эмоциональное состояние пациента, снижая риск срывов. Реабилитационные программы включают физиотерапию, спортивные занятия и коррекцию образа жизни, что способствует полноценному восстановлению организма.
Детальнее – центр анонимного лечения наркомании в твери
Современная жизнь, особенно в крупном городе, как Красноярск, часто становится причиной различных зависимостей. Работа в условиях постоянного стресса, высокий ритм жизни и эмоциональные перегрузки могут привести к проблемам, которые требуют неотложной медицинской помощи. Одним из наиболее удобных решений в такой ситуации является вызов нарколога на дом.
Узнать больше – врач нарколог на дом в красноярске
Кроме того, врач оказывает психологическую поддержку, которая помогает пациенту справиться с чувством тревоги, депрессией и страхом, возникающими на фоне зависимости.
Подробнее можно узнать тут – https://narcolog-na-dom-v-krasnoyarske55.ru/narkolog-na-dom-kruglosutochno-krasnoyarsk
Если требуется экстренная помощь при алкогольном кризисе — Narcology Clinic Москва предоставляет срочную помощь на дому: выезд нарколога, купирование симптомов, мониторинг состояния, без очередей и задержек.
Детальнее – https://skoraya-narkologicheskaya-pomoshch16.ru
Диагностика в клинике «КузбассМед» проводится комплексно: используются лабораторные, инструментальные и психологические методы. Благодаря применению цифровых систем и алгоритмов обработки данных, результаты анализов доступны уже в течение первого часа. Оценка проводится по нескольким направлениям: токсикологический статус, состояние печени и почек, электролитный баланс, нейровегетативное состояние, когнитивные функции и уровень стресса. Это позволяет врачам составлять максимально точную картину заболевания и подбирать индивидуальные методы терапии.
Разобраться лучше – наркологическая клиника нарколог новокузнецк
Если не предпринять своевременные и адекватные меры для выведения токсинов и восстановления нормальной работы организма, состояние пациента может значительно усугубиться, что многократно повышает риск развития крайне серьезных осложнений, представляющих прямую угрозу для жизни и требующих немедленной госпитализации и интенсивной терапии
Исследовать вопрос подробнее – капельницу от запоя красноярск
Кроме того, врач оказывает психологическую поддержку, которая помогает пациенту справиться с чувством тревоги, депрессией и страхом, возникающими на фоне зависимости.
Разобраться лучше – http://narcolog-na-dom-v-krasnoyarske55.ru/
Скорая наркологическая служба Narcology Clinic в Москве работает круглосуточно. Выезд к пациенту, медикаментозная стабилизация, детоксикация и психологическая поддержка до выхода из кризисного состояния.
Разобраться лучше – круглосуточная наркологическая помощь москве
20
Подробнее тут – https://skoraya-narkologicheskaya-pomoshch-moskva11.ru/
Прокат авто
Системы автоматизированного дозирования обеспечивают точное введение медикаментов, минимизируя риск передозировки и побочных эффектов. Постоянный мониторинг жизненно важных показателей позволяет врачу оперативно корректировать терапевтическую схему для достижения максимальной безопасности и эффективности.
Подробнее тут – нарколог вывод из запоя
https://crazy-time.games/ The official Crazy Time website offers a complete guide to Evolution’s live money wheel game. Learn the rules, explore bonus rounds, discover strategies, track results, and find trusted online casinos to play Crazy Time worldwide.
Экстренная наркологическая служба в Москве от Narcology Clinic предлагает оперативный выезд врача на дом. Срочный детокс, стабилизация и круглосуточная поддержка пациента с полным соблюдением конфиденциальности.
Изучить вопрос глубже – круглосуточная наркологическая помощь москве
Для понимания ключевых компонентов лечения ниже представлена таблица, в которой систематизированы основные методы и их назначение.
Ознакомиться с деталями – экстренная наркологическая помощь в новокузнецке
Наркозависимость — это не просто вредная привычка, а тяжёлое хроническое заболевание, требующее комплексного и последовательного лечения. В клинике «РеабКузбасс» в Новокузнецке разработаны персонализированные программы помощи, учитывающие медицинские, психологические и социальные аспекты проблемы. Каждому пациенту подбирается уникальный маршрут восстановления, начиная с первичной диагностики и заканчивая адаптацией к жизни без наркотиков. Поддержка оказывается круглосуточно, с полным соблюдением конфиденциальности. Психотерапевты и врачи работают в тесной связке, чтобы не только устранить физическую зависимость, но и восстановить личность пациента, вернуть ему мотивацию к жизни и уверенность в будущем.
Исследовать вопрос подробнее – лечение наркомании наркология
Экстренная наркологическая служба в Москве от Narcology Clinic предлагает оперативный выезд врача на дом. Срочный детокс, стабилизация и круглосуточная поддержка пациента с полным соблюдением конфиденциальности.
Разобраться лучше – наркологическая клиника клиника помощь
Современные реалии требуют от медицинских учреждений гибкости, скорости и чуткости. Наркологическая помощь — одна из сфер, где промедление может стоить человеку здоровья или жизни. В наркологической клинике «ТверьМед» разработаны оперативные механизмы реагирования: выезд врача по адресу в течение 30 минут, круглосуточная поддержка и возможность получения онлайн-консультации, не покидая дом. Такой подход позволяет вовремя оказать помощь, даже если пациент отказывается ехать в стационар или не осознаёт всю серьёзность своего состояния.
Выяснить больше – скорая наркологическая помощь на дому в твери
кайт хургада Кухня Египта: что попробовать кайтсерферу в Хургаде
Лечение наркомании в Твери представляет собой сложный и многоэтапный процесс, направленный на полное восстановление здоровья и социальной адаптации пациентов, страдающих от зависимости. В наркологической клинике «Ренессанс» применяется комплексный подход, который учитывает как физиологические, так и психологические аспекты заболевания, что обеспечивает максимальную эффективность терапии.
Изучить вопрос глубже – https://lechenie-narkomanii-tver0.ru/tver-lechenie-alkogolizma
Кроме того, врач оказывает психологическую поддержку, которая помогает пациенту справиться с чувством тревоги, депрессией и страхом, возникающими на фоне зависимости.
Углубиться в тему – нарколог на дом круглосуточно в красноярске
производство перил из нержавеющей стали Деревянные перила для лестницы – это традиционный и популярный выбор, который отличается своей красотой, прочностью и долговечностью. Дерево легко поддается обработке, что позволяет создавать перила различных форм и размеров. }
В Москве к вашим услугам скорая наркологическая помощь от Narcology Clinic — выезд врача 24/7, качественная помощь при алкогольной интоксикации, стабилизация состояния и организация дальнейших этапов детоксикации.
Подробнее – неотложная наркологическая помощь москве
Современная наркологическая клиника — это не просто учреждение для экстренной помощи, а центр комплексной поддержки человека, столкнувшегося с зависимостью. В «КузбассМед» в Новокузнецке реализуется модель интенсивного вмешательства, где используются новейшие медицинские технологии, мультидисциплинарный подход и мобильные выездные службы. Специалисты готовы прибыть на дом за 30 минут с полным набором оборудования и медикаментов, обеспечив пациенту помощь в привычной и безопасной среде. Наркология здесь строится на индивидуализации: каждый случай рассматривается отдельно, с учётом психофизического состояния, анамнеза и жизненного контекста пациента.
Получить дополнительную информацию – https://narkologicheskaya-klinika-novokuzneczk0.ru/narkologicheskij-czentr-novokuzneczk
Экстренная наркологическая служба в Москве от Narcology Clinic предлагает оперативный выезд врача на дом. Срочный детокс, стабилизация и круглосуточная поддержка пациента с полным соблюдением конфиденциальности.
Подробнее можно узнать тут – срочная наркологическая помощь москве
Длительный запой представляет собой опасное состояние, при котором организм не успевает справляться с токсинами алкоголя. Это приводит к тяжелой интоксикации и нарушению работы сердца, печени, почек и нервной системы. Без своевременного вмешательства риск развития осложнений существенно возрастает. Наркологическая клиника «Детоксика» в Сочи предлагает комплексную помощь при выводе из запоя, используя современные методы терапии и индивидуальный подход, что позволяет быстро восстановить здоровье пациента и обеспечить надежную поддержку на всех этапах лечения.
Получить дополнительную информацию – http://vyvod-iz-zapoya-sochi77.ru/vyvod-iz-zapoya-anonimno-v-sochi/
Длительное злоупотребление алкоголем приводит к накоплению токсинов, нарушению обменных процессов и ухудшению работы внутренних органов. Своевременное вмешательство позволяет снизить риск серьезных осложнений, таких как сердечно-сосудистые заболевания, повреждение печени и почек, а также уменьшить психоэмоциональное напряжение. Экстренный вызов нарколога на дом в Рязани помогает начать лечение на ранних этапах, когда каждая минута имеет значение.
Получить больше информации – https://наркология-дома1.рф/vyzov-narkologa-na-dom-ryazan
Состав инфузии подбирается врачом индивидуально, с учётом состояния пациента, длительности запоя, возраста и хронических заболеваний.
Разобраться лучше – вызов на дом капельницы от запоя красноярск
Скорая наркологическая помощь в Москве — Narcology Clinic выезжает круглосуточно напрямую к пациенту. Срочные капельницы, детокс, контроль состояния и экстренная поддержка. Анонимно, профессионально, оперативно.
Исследовать вопрос подробнее – скорая наркологическая помощь на дому
как получить визу в китай в новосибирске Как получить визу в Китай в Новосибирске: Пошаговая инструкция к вашей мечте. Получение визы в Китай начинается с определения цели поездки и выбора соответствующего типа визы. Затем необходимо собрать пакет документов, заполнить анкету и подать заявление в консульство или визовый центр.
В экстренной ситуации на фоне алкоголя — обращайтесь к скорой помощи Narcology Clinic в Москве. Качественный выезд нарколога, медицинская поддержка, нейтрализация последствий и помощь в восстановлении.
Исследовать вопрос подробнее – анонимная скорая наркологическая помощь
Метод лечения
Подробнее можно узнать тут – наркологическая помощь в новокузнецке
Внутривенная инфузия, представляющая собой введение лекарственных препаратов непосредственно в кровь через капельницу, является одним из самых быстрых, эффективных и безопасных способов очистки организма от алкоголя и его токсичных продуктов распада, позволяющим оперативно облегчить состояние пациента и предотвратить развитие тяжелых осложнений, связанных с алкогольной интоксикацией
Получить дополнительную информацию – [url=https://kapelnica-ot-zapoya-ekb55.ru/]стоимость капельницы от запоя красноярск[/url]
Для пациентов, нуждающихся в полном погружении в лечебный процесс, в клинике предусмотрен круглосуточный стационар. Палаты — индивидуальные и на два человека, оборудованы современной мебелью, кондиционерами и телевизорами. Организовано сбалансированное питание с возможностью коррекции по медицинским показаниям. Пациенты ежедневно проходят процедуры, сессии и получают консультации. В свободное время организуются арт-занятия, йога, дыхательные практики. Такой режим позволяет не только восстановить физическое здоровье, но и снизить уровень тревожности, вернуть интерес к жизни и стимулировать мотивацию к выздоровлению.
Исследовать вопрос подробнее – лечение наркомании в стационаре новокузнецк
Скорая наркологическая помощь в Москве — Narcology Clinic выезжает круглосуточно напрямую к пациенту. Срочные капельницы, детокс, контроль состояния и экстренная поддержка. Анонимно, профессионально, оперативно.
Узнать больше – скорая наркологическая помощь на дому
Во многих случаях пациент или его родственники не решаются сразу вызвать врача. Для таких ситуаций предусмотрена услуга онлайн-консультации. Она проводится через защищённую видеосвязь, при желании — анонимно. На связи — врач-нарколог или психиатр, который отвечает на вопросы, оценивает ситуацию по визуальным и вербальным признакам, рекомендует план действий. Консультация может стать отправной точкой для дальнейшего вызова врача на дом или записи в клинику. Это особенно удобно для родственников, которые не знают, как подступиться к проблеме и убедить человека в необходимости помощи.
Получить дополнительную информацию – https://narkologicheskaya-pomoshh-tver0.ru/narkologiya-v-tveri/
Кроме того, врач оказывает психологическую поддержку, которая помогает пациенту справиться с чувством тревоги, депрессией и страхом, возникающими на фоне зависимости.
Ознакомиться с деталями – запой нарколог на дом красноярск
Скорая наркологическая помощь в Москве — Narcology Clinic выезжает круглосуточно напрямую к пациенту. Срочные капельницы, детокс, контроль состояния и экстренная поддержка. Анонимно, профессионально, оперативно.
Изучить вопрос глубже – экстренная наркологическая помощь москва
Важной частью реабилитации является социализация пациента, возвращение его к активной общественной жизни и формирование новых, здоровых привычек. Для этого в клинике организуются различные мероприятия и программы адаптации.
Детальнее – https://lechenie-narkomanii-tver0.ru/tver-lechenie-alkogolizma/
Экстренная наркологическая служба в Москве от Narcology Clinic предлагает оперативный выезд врача на дом. Срочный детокс, стабилизация и круглосуточная поддержка пациента с полным соблюдением конфиденциальности.
Получить дополнительные сведения – вызвать наркологическую помощь москва
Нужна скорая помощь при алкогольном отравлении или запое? В Москве служба Narcology Clinic оказывает неотложную помощь на дому — детокс, капельницы, оказание первой наркологической помощи и сопровождение до стабилизации.
Выяснить больше – наркологическая помощь на дому москва
Процесс лечения организован по отлаженной схеме, которая включает несколько последовательных этапов для быстрого и безопасного вывода из запоя:
Детальнее – вывод из запоя ленинградская область
Программа лечения строится по принципу последовательного воздействия на физическое и психологическое состояние. Начинается она с детоксикации: инфузионная терапия с применением сбалансированных растворов, антиоксидантов, гепатопротекторов и витаминов. Затем — стабилизация состояния, коррекция сна, восстановление когнитивных функций и купирование абстинентного синдрома. В зависимости от диагноза используются такие методы, как заместительная терапия, нейрометаболическая поддержка, противотревожные и антидепрессивные схемы.
Подробнее – платная наркологическая клиника новокузнецк
Нужна скорая помощь при алкогольном отравлении или запое? В Москве служба Narcology Clinic оказывает неотложную помощь на дому — детокс, капельницы, оказание первой наркологической помощи и сопровождение до стабилизации.
Узнать больше – платная наркологическая помощь москва
Нужна скорая помощь при алкогольном отравлении или запое? В Москве служба Narcology Clinic оказывает неотложную помощь на дому — детокс, капельницы, оказание первой наркологической помощи и сопровождение до стабилизации.
Подробнее можно узнать тут – срочная наркологическая помощь москва
Этот увлекательный информационный материал подарит вам массу новых знаний и ярких эмоций. Мы собрали для вас интересные факты и сведения, которые обогатят ваш опыт. Откройте для себя увлекательный мир информации и насладитесь процессом изучения!
Подробнее – https://nyrupudlodder.dk/events/ordinaer-generalforsamling
Наркологическая помощь в Новокузнецке представляет собой комплекс профессиональных медицинских мероприятий, направленных на диагностику, лечение и реабилитацию пациентов с алкогольной и наркотической зависимостью. В клинике «Альтернатива» помощь оказывается на всех этапах заболевания, что позволяет добиться стойких положительных результатов и восстановления качества жизни.
Исследовать вопрос подробнее – http://narkologicheskaya-pomoshh-novokuzneczk0.ru
Кроме того, врач оказывает психологическую поддержку, которая помогает пациенту справиться с чувством тревоги, депрессией и страхом, возникающими на фоне зависимости.
Получить дополнительные сведения – нарколог на дом цена
После прохождения основной программы пациенту предлагается поддерживающее наблюдение. Оно может включать дистанционные консультации, участие в группе профилактики срывов, повторные осмотры нарколога и психолога, корректировку медикаментозной схемы. В рамках реабилитации формируются планы действий при возникновении тяги, обучаются навыки сопротивления стрессу и внешнему давлению. При желании можно подключить родственников к процессу постлечебной адаптации, чтобы укрепить результат и снизить риски рецидивов. Таким образом, пациент не остаётся один даже после выписки.
Получить дополнительные сведения – http://lechenie-narkomanii-novokuzneczk0.ru/lechenie-zavisimosti-ot-narkotikov-novokuzneczk/
Нужна скорая помощь при алкогольном отравлении или запое? В Москве служба Narcology Clinic оказывает неотложную помощь на дому — детокс, капельницы, оказание первой наркологической помощи и сопровождение до стабилизации.
Подробнее можно узнать тут – частная наркологическая помощь москве
В экстренной ситуации на фоне алкоголя — обращайтесь к скорой помощи Narcology Clinic в Москве. Качественный выезд нарколога, медицинская поддержка, нейтрализация последствий и помощь в восстановлении.
Исследовать вопрос подробнее – срочная наркологическая помощь москва
Во время онлайн-сессии специалист может использовать шкалы оценки состояния (CIWA-Ar, CAGE, AUDIT), психодиагностические опросники, видеоанализ мимики и речи. Это позволяет провести достаточно точную первичную дифференцировку между алкогольной абстиненцией, тревожным расстройством, интоксикацией и психотическим состоянием. При необходимости пациенту предлагается записаться на очный приём или воспользоваться услугой «стационар на дому» — с ежедневными визитами и наблюдением.
Подробнее – https://narkologicheskaya-pomoshh-tver0.ru/narkolog-tver-anonimno
Оказание помощи нарколога на дому организовано по отлаженной схеме, включающей несколько ключевых этапов, которые позволяют оперативно стабилизировать состояние пациента и начать детоксикацию:
Подробнее можно узнать тут – https://наркология-дома1.рф/vrach-narkolog-na-dom-ryazan
Правильный подбор лекарственных средств позволяет не только уменьшить проявления синдрома отмены, но и стабилизировать эмоциональное состояние пациента, снижая риск срывов. Реабилитационные программы включают физиотерапию, спортивные занятия и коррекцию образа жизни, что способствует полноценному восстановлению организма.
Узнать больше – центр анонимного лечения наркомании в твери
Этот текст призван помочь читателю расширить кругозор и получить практические знания. Мы используем простой язык, наглядные примеры и структурированное изложение, чтобы сделать обучение максимально эффективным и увлекательным.
Только для своих – http://brandcrystal.com/cropped-snowflake-board-2-jpg
Эта статья для ознакомления предлагает читателям общее представление об актуальной теме. Мы стремимся представить ключевые факты и идеи, которые помогут читателям получить представление о предмете и решить, стоит ли углубляться в изучение.
Изучить вопрос глубже – https://reuter-log.de/2021/01/23/kontakt
Тем, кто нуждается в длительной терапии, «КузбассМед» предлагает комфортные условия стационара с круглосуточным наблюдением. Здесь пациенты размещаются в индивидуальных палатах, проходят курсы терапии, реабилитации и психокоррекции. Обстановка в клинике напоминает оздоровительный центр: мягкое освещение, тишина, доступ к библиотеке, возможность общения с психологом и ежедневное участие в восстановительных мероприятиях. Медицинские сестры и врачи находятся на дежурстве 24/7, что позволяет немедленно реагировать на любые изменения в состоянии пациента.
Подробнее тут – платная наркологическая клиника
Аренда авто в Краснодаре бизнес
Этот информативный текст отличается привлекательным содержанием и актуальными данными. Мы предлагаем читателям взглянуть на привычные вещи под новым углом, предоставляя интересный и доступный материал. Получите удовольствие от чтения и расширьте кругозор!
Смотрите также… – https://mkfoundryconsulting.com/hello-world-2
В этой публикации мы предлагаем подробные объяснения по актуальным вопросам, чтобы помочь читателям глубже понять их. Четкость и структурированность материала сделают его удобным для усвоения и применения в повседневной жизни.
Как достичь результата? – http://24koleso.ru
Эта статья для ознакомления предлагает читателям общее представление об актуальной теме. Мы стремимся представить ключевые факты и идеи, которые помогут читателям получить представление о предмете и решить, стоит ли углубляться в изучение.
Почему это важно? – https://www.hotel-sugano.com/bbs/sugano.cgi/sosh13.pascal.ru/forum/www.skitour.su/datasphere.ru/club/user/12/blog/2477/www.skitour.su/www.tovery.net/sugano.cgi?page40=val
Эта информационная статья содержит полезные факты, советы и рекомендации, которые помогут вам быть в курсе последних тенденций и изменений в выбранной области. Материал составлен так, чтобы быть полезным и понятным каждому.
Обратитесь за информацией – https://www.affabletech.ai/blog/a-beginners-guide-to-clickup
Эта информационная заметка содержит увлекательные сведения, которые могут вас удивить! Мы собрали интересные факты, которые сделают вашу жизнь ярче и полнее. Узнайте нечто новое о привычных аспектах повседневности и откройте для себя удивительный мир информации.
Только для своих – https://www.sksandloparen.se/schack-online
В этой информационной статье вы найдете интересное содержание, которое поможет вам расширить свои знания. Мы предлагаем увлекательный подход и уникальные взгляды на обсуждаемые темы, побуждая пользователей к активному мышлению и критическому анализу!
Исследовать вопрос подробнее – https://awamazingcollection.com/meet-maam-awa-the-heart-and-soul-behind-our-journey
Эта статья предлагает живое освещение актуальной темы с множеством интересных фактов. Мы рассмотрим ключевые моменты, которые делают данную тему важной и актуальной. Подготовьтесь к насыщенному путешествию по неизвестным аспектам и узнайте больше о значимых событиях.
Более того — здесь – https://asemanaagora.com.br/2024/03/26/cerimonia-de-entrega-de-faixas-do-karate-aconteceu-neste-sabado-23-no-complexo-esportivo-no-parque-do-sol
Публикация предлагает уникальную подборку информации, которая будет интересна как специалистам, так и широкому кругу читателей. Здесь вы найдете ответы на часто задаваемые вопросы и полезные инсайты для дальнейшего применения.
Читать дальше – https://snavar.com/what-is-chatgpt
В этой информационной статье вы найдете интересное содержание, которое поможет вам расширить свои знания. Мы предлагаем увлекательный подход и уникальные взгляды на обсуждаемые темы, побуждая пользователей к активному мышлению и критическому анализу.
Расширить кругозор по теме – https://www.deslakkenman.nl/zevenblad-en-molsla
В этой статье вы найдете познавательную и занимательную информацию, которая поможет вам лучше понять мир вокруг. Мы собрали интересные данные, которые вдохновляют на размышления и побуждают к действиям. Открывайте новую информацию и получайте удовольствие от чтения!
Лучшее решение — прямо здесь – https://solariaopere.eu/cropped-logo-def-10×10-jpg
Этот информационный материал собраны данные, которые помогут лучше понять текущие тенденции и процессы в различных сферах жизни. Мы предоставляем четкий анализ, графики и примеры, чтобы информация была не только понятной, но и практичной для принятия решений.
Не пропусти важное – https://covid-19care.com/shop/giuong-benh-nhan-chinh-bang-tay-d356a
Публикация предлагает уникальную подборку информации, которая будет интересна как специалистам, так и широкому кругу читателей. Здесь вы найдете ответы на часто задаваемые вопросы и полезные инсайты для дальнейшего применения.
Ознакомиться с полной информацией – https://epicabol.com/producto/espatula-2-mango-de-tpr
В этой статье представлен занимательный и актуальный контент, который заставит вас задуматься. Мы обсуждаем насущные вопросы и проблемы, а также освещаем истории, которые вдохновляют на действия и изменения. Узнайте, что стоит за событиями нашего времени!
Информация доступна здесь – https://bibicaspari.com/chatoyant-youtube-hover
Этот информационный материал собраны данные, которые помогут лучше понять текущие тенденции и процессы в различных сферах жизни. Мы предоставляем четкий анализ, графики и примеры, чтобы информация была не только понятной, но и практичной для принятия решений.
Это ещё не всё… – https://safeofficialshop.com/ola-mundo
Предлагаем вашему вниманию интересную справочную статью, в которой собраны ключевые моменты и нюансы по актуальным вопросам. Эта информация будет полезна как для профессионалов, так и для тех, кто только начинает изучать тему. Узнайте ответы на важные вопросы и расширьте свои знания!
Изучить вопрос глубже – https://bilitoor.com/introducing-this-amazing-tour
Эта информационная статья содержит полезные факты, советы и рекомендации, которые помогут вам быть в курсе последних тенденций и изменений в выбранной области. Материал составлен так, чтобы быть полезным и понятным каждому.
Только факты! – https://www.ccbf.fr/publicado-na-impresa-francesa-do-4-ao-10-de-fevereiro/?lang=pt-br
Описание
Получить дополнительную информацию – вывод из запоя клиника
Помощь врача-нарколога становится жизненно важной, когда симптомы абстинентного синдрома становятся невыносимыми и угрожают жизни пациента. К числу основных признаков, требующих срочного вмешательства, относятся:
Детальнее – снятие ломки в краснодаре
экскурсии по казани Мечеть Кул-Шариф: Символ Возрождения и Духовности Мечеть Кул-Шариф – это главная мечеть Казани и одна из самых красивых мечетей в России. Она была построена в память о разрушенной мечети Казанского ханства и является символом возрождения татарской культуры и духовности. Мечеть поражает своей архитектурой и великолепием. Вы можете посетить ее, чтобы узнать больше об исламе и татарской культуре.
По окончании курса детоксикации нарколог дает пациенту и его близким подробные рекомендации, помогающие быстрее восстановить здоровье и предотвратить повторные случаи запоев.
Получить дополнительную информацию – http://vyvod-iz-zapoya-novosibirsk0.ru/
Врачи клиники «ВитаЛайн» для снятия интоксикации и облегчения состояния пациента применяют исключительно качественные и проверенные лекарственные препараты, подбирая их в зависимости от особенностей ситуации и состояния здоровья пациента:
Подробнее можно узнать тут – http://narcolog-na-dom-novosibirsk0.ru/narkolog-na-dom-kruglosutochno-novosibirsk/
Алкогольный запой представляет собой тяжелое состояние, вызванное длительным бесконтрольным употреблением спиртных напитков. Без медицинского вмешательства вывести организм из запоя может быть сложно и даже опасно. Срочная помощь нарколога требуется при следующих признаках:
Изучить вопрос глубже – врач на дом капельница от запоя
Пациенты выбирают нашу клинику для срочного вызова врача-нарколога благодаря следующим важным преимуществам:
Подробнее можно узнать тут – narcolog-na-dom-novosibirsk00.ru/
Клиника «АнтиАлко» предлагает экстренную медицинскую помощь на дому в Новосибирске и Новосибирской области для тех, кто столкнулся с запоем. Если вы или ваш близкий оказались в состоянии длительной алкогольной интоксикации, наши специалисты готовы оперативно приехать к вам, провести комплексную детоксикацию и купировать симптомы абстинентного синдрома. Мы гарантируем высокий уровень безопасности, полную анонимность и индивидуальный подход к каждому пациенту.
Подробнее тут – http://vyvod-iz-zapoya-novosibirsk00.ru
Обращаясь за помощью в клинику «НаркоЩит», пациенты получают комплексное лечение, которое отличается следующими преимуществами:
Подробнее можно узнать тут – капельница от запоя в нижний новгороде
Запой – это не просто пьянство, а состояние, когда организм становится зависимым от алкоголя. Накопление токсинов приводит к сбоям в работе органов и ослаблению защиты организма. Самостоятельный выход из запоя может быть опасен и только усугубить состояние. Мы предлагаем лечение запоя на дому, чтобы избежать больницы и создать комфорт. Наши специалисты быстро приедут к вам и окажут всю необходимую помощь круглосуточно. Запой приводит к серьезным проблемам со здоровьем, ухудшает качество жизни и угрожает жизни. Очень важно вовремя обратиться за помощью, чтобы избежать необратимых последствий.
Подробнее можно узнать тут – https://vyvod-iz-zapoya-krasnoyarsk0.ru/vyvod-iz-zapoya-na-domu-krasnoyarsk/
Когда запой превращается в острую угрозу здоровью, оперативное вмешательство становится необходимым условием для спасения жизни и предотвращения серьезных осложнений. В Уфе наркологи выезжают на дом для оказания качественной помощи при запое, предлагая детоксикацию, корректировку обменных процессов и психологическую поддержку. Такой формат лечения обеспечивает комфортную обстановку, индивидуальный подход и полную конфиденциальность для каждого пациента.
Детальнее – нарколог на дом стоимость уфа
Экстренный вызов нарколога на дом в Иркутске от «ТрезвоМед» при запое, интоксикации или кодировании – анонимно и удобно. Осмотр, детоксикация капельницей, индивидуальный план лечения – все это на дому! «ТрезвоМед» – круглосуточная помощь, анонимность и безопасность при отказе от алкоголя. Не можете бросить пить самостоятельно? Нужна помощь нарколога! Васильев: «Своевременная помощь при интоксикации – залог успешного выздоровления».
Подробнее можно узнать тут – https://narcolog-na-dom-v-irkutske0.ru/vrach-narkolog-na-dom-irkutsk
После вашего звонка нарколог выезжает на дом в течение 30–60 минут. Прибыв на место, специалист проводит всесторонний медицинский осмотр, включая измерение артериального давления, пульса и уровня кислорода в крови, а также собирает анамнез для определения степени интоксикации.
Исследовать вопрос подробнее – нарколог на дом в воронеже
В Москве к вашим услугам скорая наркологическая помощь от Narcology Clinic — выезд врача 24/7, качественная помощь при алкогольной интоксикации, стабилизация состояния и организация дальнейших этапов детоксикации.
Углубиться в тему – круглосуточная наркологическая помощь московская область
Narcology Clinic в Москве оказывает экстренную наркологическую помощь дома — скорая выездная служба выполняет детоксикацию, капельницы и мониторинг до нормализации состояния. Анонимно и круглосуточно.
Подробнее можно узнать тут – наркологическая помощь на дому москве
Некоторые состояния требуют немедленного вмешательства нарколога, так как отказ от лечения может привести к тяжелым осложнениям и риску для жизни.
Получить дополнительные сведения – https://narcolog-na-dom-novokuznetsk00.ru/
Если требуется экстренная помощь при алкогольном кризисе — Narcology Clinic Москва предоставляет срочную помощь на дому: выезд нарколога, купирование симптомов, мониторинг состояния, без очередей и задержек.
Получить дополнительную информацию – https://skoraya-narkologicheskaya-pomoshch-moskva11.ru
В наркологической клинике «Рестарт» используется комплексный подход к лечению абстинентного синдрома. Наши преимущества:
Подробнее можно узнать тут – http://www.domen.ru
Электрики Монтаж электропроводки: Шаг за шагом к надежности, гарантия качества и долговечности.
Запой — это опасное состояние, при котором организм человека подвергается сильной алкогольной интоксикации, а внутренние органы, такие как печень, сердце и почки, начинают работать в аварийном режиме. В такой момент самостоятельное лечение становится невозможным, и необходима оперативная помощь специалистов. Наркологическая клиника «Детоксика» в Сочи предлагает комплексный вывод из запоя с использованием современных методов терапии и индивидуального подхода, что позволяет быстро восстановить здоровье пациента и предотвратить серьезные осложнения.
Получить дополнительные сведения – https://vyvod-iz-zapoya-sochi7.ru/vyvod-iz-zapoya-cena-v-sochi
Запой – это состояние, когда организм требует постоянного поступления алкоголя для нормальной работы. Запой вызывает накопление вредных веществ, что негативно влияет на органы и иммунную систему. Не пытайтесь самостоятельно избавиться от запоя, это может навредить. Получите квалифицированную помощь на дому от клиники «Семья и Здоровье». Мы быстро приедем и окажем круглосуточную поддержку при запое. Длительное употребление алкоголя опасно для здоровья и жизни. Не ждите, пока станет слишком поздно, обратитесь за помощью при запое!
Подробнее можно узнать тут – вывод из запоя цены красноярск
Врачи клиники «ВитаЛайн» для снятия интоксикации и облегчения состояния пациента применяют исключительно качественные и проверенные лекарственные препараты, подбирая их в зависимости от особенностей ситуации и состояния здоровья пациента:
Узнать больше – нарколог на дом новосибирск.
После поступления вызова наш нарколог выезжает к пациенту в кратчайшие сроки, прибывая по адресу в пределах 30–60 минут. Специалист начинает процедуру с подробного осмотра и диагностики, измеряя ключевые показатели организма: артериальное давление, частоту пульса, насыщенность кислородом и собирая подробный анамнез.
Углубиться в тему – нарколог на дом
Клиника «АнтиАлко» предлагает экстренную медицинскую помощь на дому в Новосибирске и Новосибирской области для тех, кто столкнулся с запоем. Если вы или ваш близкий оказались в состоянии длительной алкогольной интоксикации, наши специалисты готовы оперативно приехать к вам, провести комплексную детоксикацию и купировать симптомы абстинентного синдрома. Мы гарантируем высокий уровень безопасности, полную анонимность и индивидуальный подход к каждому пациенту.
Узнать больше – вывод из запоя цена
Не стоит медлить с вызовом врача-нарколога, если у человека проявляются тревожные признаки ухудшения состояния. Среди наиболее серьезных симптомов, требующих немедленного вмешательства врача, можно выделить продолжительный запой (более двух дней подряд), частую рвоту, невыносимую головную боль, выраженный тремор рук и тела, повышение артериального давления, нарушение ритма сердца, а также психические нарушения, включая тревогу, галлюцинации и бессонницу. Чем раньше пациент обратится за профессиональной помощью, тем выше шансы избежать серьезных осложнений и быстро вернуться к нормальной жизни.
Углубиться в тему – вывод из запоя на дому новосибирск
Клиника «ТоксинНет» предлагает профессиональную помощь при алкогольной зависимости и запоях в Нижнем Новгороде. Наши опытные наркологи круглосуточно выезжают на дом для оказания экстренной медицинской помощи. Основным методом лечения является капельница от запоя, которая позволяет оперативно снять интоксикацию и стабилизировать общее состояние пациента. Мы обеспечиваем конфиденциальность, индивидуальный подход и высокий уровень безопасности процедур.
Разобраться лучше – http://kapelnica-ot-zapoya-nizhniy-novgorod0.ru
For quick, reliable JPEG-to-JPG conversions, turn to JPEGtoJPGHero.com. This online utility requires no sign-up or payment—just a fast, ad-free process in a clean interface. Drag and drop images into the upload box, or click to browse. The server handles conversion without sacrificing image clarity, working behind the scenes while you see a progress bar track each file. Multiple images convert in a single batch, cutting down repetitive clicks. Download links pop up as soon as the job finishes, letting you save updated JPG files in seconds. The browser-based design means the tool functions equally well on Windows, macOS, Linux, Android, and iOS. Privacy remains a priority: every uploaded image is deleted automatically after conversion, and no user data gets stored permanently. Use cases range from preparing photography portfolios to formatting images for email attachments. By keeping features simple and focusing on performance, JPEGtoJPGHero.com ensures that converting JPEG images to the widely accepted JPG format never feels complicated or time-consuming.
JPEGtoJPGHero.com
Экстренная помощь при алкоголизме от Narcology Clinic в Москве — выезд врачей в любую точку города, купирование острых состояний, поддержка пациента до стабильного состояния, профессионально и в конфиденциальности.
Получить больше информации – anonimnaya-narkologicheskaya-pomoshch moskva
essay writer website The Art of Argumentative Essays: Persuasion Through Prose Argumentative essays require a strategic approach. Our writers excel at constructing compelling arguments, supported by evidence and presented with clarity. Make your point effectively with our expertise.
Экстренная наркологическая служба в Москве от Narcology Clinic предлагает оперативный выезд врача на дом. Срочный детокс, стабилизация и круглосуточная поддержка пациента с полным соблюдением конфиденциальности.
Разобраться лучше – вызвать наркологическую помощь
Обращаясь за помощью в клинику «НаркоЩит», пациенты получают комплексное лечение, которое отличается следующими преимуществами:
Выяснить больше – капельница от запоя на дому в нижний новгороде
Скорая наркологическая помощь в Москве — Narcology Clinic выезжает круглосуточно напрямую к пациенту. Срочные капельницы, детокс, контроль состояния и экстренная поддержка. Анонимно, профессионально, оперативно.
Получить больше информации – наркологическая помощь москве
Если требуется срочное кодирование или детоксикация, вызов нарколога на дом – лучшее решение в Иркутске. Профессиональный нарколог приедет, оценит состояние, проведет детоксикацию на дому. «ТрезвоМед»: анонимный выезд нарколога 24/7, помощь при отказе от алкоголя. Тяжело бросить пить в одиночку? Обратитесь к наркологу! Главное – быстро оказать помощь при интоксикации, – нарколог Васильев.
Разобраться лучше – https://narcolog-na-dom-v-irkutske0.ru/narkolog-na-dom-czena-irkutsk/
Скорая наркологическая служба Narcology Clinic в Москве работает круглосуточно. Выезд к пациенту, медикаментозная стабилизация, детоксикация и психологическая поддержка до выхода из кризисного состояния.
Подробнее – срочная наркологическая помощь москве
Современные методы лечения при выводе из запоя включают как медикаментозную детоксикацию, так и психологическую реабилитацию. В Уфе наркологи используют капельничное введение лекарственных средств, которые помогают быстро вывести токсины, нормализовать обмен веществ и стабилизировать работу внутренних органов. Одновременно с этим проводится психологическая поддержка для снижения эмоционального стресса, связанного с запоем.
Разобраться лучше – нарколог на дом цены уфа
Наши специалисты используют проверенные медикаменты, которые подбираются индивидуально для каждого пациента:
Узнать больше – https://narcolog-na-dom-voronezh0.ru/vyzov-narkologa-na-dom-voronezh/
хочу задать вопрос юристу городская юридическая консультация бесплатно
Нужны пластиковые окна: пластиковые окна
Нужен вентилируемый фасад: стоимость подсистемы для вентилируемых фасадов
Запой – это серьезная проблема, когда организм перестает работать без постоянного поступления алкоголя. Из-за запоя токсины отравляют организм, нарушая работу органов и снижая иммунитет. Попытки самостоятельно бросить пить во время запоя могут привести к ухудшению самочувствия. «Семья и Здоровье» лечит запой на дому – это удобно и снижает стресс. Мы приедем в любое время суток и проведем все процедуры для восстановления здоровья. Длительное пьянство может привести к опасным для жизни осложнениям. Нельзя затягивать с лечением запоя, это может привести к серьезным последствиям.
Исследовать вопрос подробнее – https://vyvod-iz-zapoya-krasnoyarsk0.ru
Врачи клиники «АнтиТокс» используют эффективные и проверенные временем препараты, которые помогают пациентам в кратчайшие сроки стабилизировать самочувствие и восстановить нормальную работу организма. В список основных препаратов входят:
Углубиться в тему – вывод из запоя клиника
Пациенты, которые выбирают нашу клинику для лечения алкогольного запоя, получают качественную и оперативную помощь, обладающую следующими преимуществами:
Выяснить больше – https://kapelnica-ot-zapoya-nizhniy-novgorod0.ru/kapelnicza-ot-zapoya-na-domu-nizhnij-novgorod/
Пациенты, которые обращаются в нашу клинику, получают целый комплекс преимуществ, благодаря которым лечение проходит максимально эффективно и комфортно:
Изучить вопрос глубже – врач нарколог на дом новосибирск.
Клиника «АнтиАлко» предлагает экстренную медицинскую помощь на дому в Новосибирске и Новосибирской области для тех, кто столкнулся с запоем. Если вы или ваш близкий оказались в состоянии длительной алкогольной интоксикации, наши специалисты готовы оперативно приехать к вам, провести комплексную детоксикацию и купировать симптомы абстинентного синдрома. Мы гарантируем высокий уровень безопасности, полную анонимность и индивидуальный подход к каждому пациенту.
Подробнее – вывод из запоя в стационаре в новосибирске
Пациенты выбирают нашу клинику для срочного вызова врача-нарколога благодаря следующим важным преимуществам:
Подробнее можно узнать тут – narkolog-na-dom-kruglosutochno novosibirsk
Если требуется экстренная помощь при алкогольном кризисе — Narcology Clinic Москва предоставляет срочную помощь на дому: выезд нарколога, купирование симптомов, мониторинг состояния, без очередей и задержек.
Выяснить больше – наркологическая клиника клиника помощь москве
Наши специалисты используют проверенные и сертифицированные медикаменты, которые подбираются индивидуально для каждого пациента:
Выяснить больше – после капельницы от запоя в нижний новгороде
Преимущество
Получить дополнительные сведения – вывод из запоя в стационаре в сочи
Абстинентный синдром, или ломка, – это тяжелое состояние, которое развивается у зависимых после отказа от наркотиков или алкоголя. Он сопровождается сильными физическими болями, судорогами, повышенной тревожностью, бессонницей и эмоциональными перепадами, что может привести к серьезным осложнениям для здоровья. Наркологическая клиника «Здравица» в Ростове-на-Дону предлагает комплексное лечение абстинентного синдрома, используя передовые методики и индивидуальный подход для быстрого восстановления здоровья.
Изучить вопрос глубже – снятие ломки
https://kazan.land/ Галерея Современного Искусства: Вдохновение и Новые Горизонты Галерея современного искусства – это место, где представлены работы современных художников и скульпторов, работающих в различных стилях и направлениях. Здесь можно увидеть произведения, отражающие современные тенденции в искусстве, а также принять участие в выставках и мастер-классах. Галерея поможет вам открыть для себя новые горизонты в искусстве и получить вдохновение.
В Москве к вашим услугам скорая наркологическая помощь от Narcology Clinic — выезд врача 24/7, качественная помощь при алкогольной интоксикации, стабилизация состояния и организация дальнейших этапов детоксикации.
Углубиться в тему – наркологическая помощь
Если требуется экстренная помощь при алкогольном кризисе — Narcology Clinic Москва предоставляет срочную помощь на дому: выезд нарколога, купирование симптомов, мониторинг состояния, без очередей и задержек.
Получить больше информации – анонимная наркологическая помощь москве
Нужна скорая помощь при алкогольном отравлении или запое? В Москве служба Narcology Clinic оказывает неотложную помощь на дому — детокс, капельницы, оказание первой наркологической помощи и сопровождение до стабилизации.
Получить дополнительные сведения – круглосуточная наркологическая помощь москве
После поступления звонка специалисты нашей клиники оперативно выезжают по адресу пациента в Новосибирске. Врач начинает работу с детальной диагностики: измеряет пульс, артериальное давление, сатурацию (уровень кислорода в крови), оценивает состояние нервной и сердечно-сосудистой систем, уточняет наличие хронических заболеваний, аллергических реакций, длительность и тяжесть запоя.
Детальнее – вывод из запоя новосибирск
Пациенты, которые обращаются в нашу клинику, получают целый комплекс преимуществ, благодаря которым лечение проходит максимально эффективно и комфортно:
Получить дополнительную информацию – нарколог на дом вывод из запоя новосибирск
Клиника «ТоксинНет» предлагает профессиональную помощь при алкогольной зависимости и запоях в Нижнем Новгороде. Наши опытные наркологи круглосуточно выезжают на дом для оказания экстренной медицинской помощи. Основным методом лечения является капельница от запоя, которая позволяет оперативно снять интоксикацию и стабилизировать общее состояние пациента. Мы обеспечиваем конфиденциальность, индивидуальный подход и высокий уровень безопасности процедур.
Подробнее можно узнать тут – капельница от запоя цена в нижний новгороде
Запой – это неконтролируемое употребление алкоголя, которое приводит к серьезным последствиям. Алкогольное отравление организма приводит к серьезным проблемам со здоровьем. Выходить из запоя самостоятельно – рискованно и неэффективно. Мы предлагаем помощь при запое на дому, в привычных для вас условиях. Круглосуточная помощь при запое с выездом на дом за 30-60 минут. Длительный запой разрушает организм и может быть смертельным. Чем раньше вы обратитесь за помощью, тем больше шансов на выздоровление.
Подробнее – http://vyvod-iz-zapoya-krasnoyarsk0.ru/
Лечение проводится в комфортных домашних условиях, что снижает стресс и помогает быстрее восстановиться.
Получить больше информации – вывод из запоя
После поступления вызова наш нарколог выезжает к пациенту в кратчайшие сроки, прибывая по адресу в пределах 30–60 минут. Специалист начинает процедуру с подробного осмотра и диагностики, измеряя ключевые показатели организма: артериальное давление, частоту пульса, насыщенность кислородом и собирая подробный анамнез.
Выяснить больше – http://narcolog-na-dom-novosibirsk00.ru
Скорая наркологическая помощь в Москве — Narcology Clinic выезжает круглосуточно напрямую к пациенту. Срочные капельницы, детокс, контроль состояния и экстренная поддержка. Анонимно, профессионально, оперативно.
Ознакомиться с деталями – вызвать наркологическую помощь москва
Клиника «НаркологикПлюс» предоставляет квалифицированную помощь нарколога на дому в Воронеже. Если вы или ваши близкие столкнулись с последствиями длительного употребления алкоголя или наркотиков, наши специалисты готовы оперативно выехать и оказать экстренную помощь. Мы проводим детоксикацию организма, снимаем симптомы абстинентного синдрома и стабилизируем состояние пациента, обеспечивая высокий уровень безопасности, строгую анонимность и индивидуальный подход.
Детальнее – нарколог на дом цена
Экстренный вызов нарколога на дом в Иркутске от «ТрезвоМед» при запое, интоксикации или кодировании – анонимно и удобно. Осмотр, детоксикация капельницей, индивидуальный план лечения – все это на дому! «ТрезвоМед» – круглосуточная помощь, анонимность и безопасность при отказе от алкоголя. Не можете бросить пить самостоятельно? Нужна помощь нарколога! Васильев: «Своевременная помощь при интоксикации – залог успешного выздоровления».
Изучить вопрос глубже – https://narcolog-na-dom-v-irkutske0.ru/vyzov-narkologa-na-dom-irkutsk/
Основной этап терапии — установка внутривенной капельницы. Через капельницу вводятся специально подобранные растворы, способствующие быстрому выведению токсинов, восстановлению водно-электролитного баланса и нормализации работы внутренних органов. При необходимости врач назначает дополнительные медикаменты для защиты печени, стабилизации сердечной деятельности и купирования симптомов абстинентного синдрома. В течение всей процедуры состояние пациента контролируется врачом, который корректирует схему лечения для достижения наилучших результатов. По завершении процедуры специалист дает подробные рекомендации по дальнейшему восстановлению и профилактике повторных запоев.
Подробнее можно узнать тут – http://kapelnica-ot-zapoya-nizhniy-novgorod00.ru
20
Изучить вопрос глубже – вызвать наркологическую помощь москва
Современные методы лечения при выводе из запоя включают как медикаментозную детоксикацию, так и психологическую реабилитацию. В Уфе наркологи используют капельничное введение лекарственных средств, которые помогают быстро вывести токсины, нормализовать обмен веществ и стабилизировать работу внутренних органов. Одновременно с этим проводится психологическая поддержка для снижения эмоционального стресса, связанного с запоем.
Изучить вопрос глубже – нарколог на дом цены в уфе
Скорая наркологическая служба Narcology Clinic в Москве работает круглосуточно. Выезд к пациенту, медикаментозная стабилизация, детоксикация и психологическая поддержка до выхода из кризисного состояния.
Ознакомиться с деталями – центр наркологической помощи москве
В экстренной ситуации на фоне алкоголя — обращайтесь к скорой помощи Narcology Clinic в Москве. Качественный выезд нарколога, медицинская поддержка, нейтрализация последствий и помощь в восстановлении.
Детальнее – платная наркологическая помощь
Абстинентный синдром развивается после прекращения приёма наркотических веществ или алкоголя, и сопровождается комплексом тяжёлых симптомов:
Разобраться лучше – снятие ломки капельницей в краснодаре
При остром алкогольном отравлении появляются головокружение, рвота, сильная слабость, скачки давления, нарушение дыхания, обмороки и судороги. Это сигнал о том, что организм не справляется с интоксикацией, и без срочного медицинского вмешательства возможны опасные осложнения, вплоть до комы.
Изучить вопрос глубже – нарколог на дом вывод в новокузнецке
Helpful info. Lucky me I found your web site by accident, and I am stunned why this coincidence didn’t came about earlier! I bookmarked it.
обменять биткоин на рубли
Запой – это состояние, когда организм требует постоянного поступления алкоголя для нормальной работы. Запой вызывает накопление вредных веществ, что негативно влияет на органы и иммунную систему. Не пытайтесь самостоятельно избавиться от запоя, это может навредить. Получите квалифицированную помощь на дому от клиники «Семья и Здоровье». Мы быстро приедем и окажем круглосуточную поддержку при запое. Длительное употребление алкоголя опасно для здоровья и жизни. Не ждите, пока станет слишком поздно, обратитесь за помощью при запое!
Получить дополнительную информацию – http://vyvod-iz-zapoya-krasnoyarsk0.ru/vyvod-iz-zapoya-kruglosutochno-krasnoyarsk
В этом обзорном материале представлены увлекательные детали, которые находят отражение в различных аспектах жизни. Мы исследуем непонятные и интересные моменты, позволяя читателю увидеть картину целиком. Погрузитесь в мир знаний и удивительных открытий!
Не пропусти важное – https://www.lamillorcocadesantjoan.cat/2020/06/05/ja-tenim-les-millors-coques-de-sant-joan-2020
В этой статье собраны факты, которые освещают целый ряд важных вопросов. Мы стремимся предложить читателям четкую, достоверную информацию, которая поможет сформировать собственное мнение и лучше понять сложные аспекты рассматриваемой темы.
Ознакомьтесь с аналитикой – https://graphichy.com/photoshop-template-edit
Этот информативный текст выделяется своими захватывающими аспектами, которые делают сложные темы доступными и понятными. Мы стремимся предложить читателям глубину знаний вместе с разнообразием интересных фактов. Откройте новые горизонты и развивайте свои способности познавать мир!
Неизвестные факты о… – https://f5fashion.vn/tu-vi-tuan-moi-9-10-15-10-2023-3-tuoi-duyen-lanh-den-cua-1-tuoi-ra-cua-mat-tien
PNGtoJPGHero leverages cutting-edge browser-based image processing to transform PNG files into high-quality JPGs without installing any external software. Its core engine applies adaptive compression, intelligently balancing image fidelity with reduced file size. This makes it ideal for web developers optimizing assets, marketers preparing images for campaigns, or anyone managing storage constraints. The conversion pipeline supports simultaneous multi-file processing, ensuring speed even with large batches. Built with responsive design principles, the interface adapts seamlessly to desktop, tablet, and mobile screens. Robust privacy protocols ensure that uploaded images are encrypted in transit and purged from the server shortly after processing. By combining lightweight front-end performance with efficient server-side handling, PNG to JPG Hero delivers consistent results in under a second per image. It’s a precise, reliable, and secure solution for converting images at scale or on the go.
PNGtoJPGHERO
В Москве к вашим услугам скорая наркологическая помощь от Narcology Clinic — выезд врача 24/7, качественная помощь при алкогольной интоксикации, стабилизация состояния и организация дальнейших этапов детоксикации.
Исследовать вопрос подробнее – наркологическая помощь москва
В экстренной ситуации на фоне алкоголя — обращайтесь к скорой помощи Narcology Clinic в Москве. Качественный выезд нарколога, медицинская поддержка, нейтрализация последствий и помощь в восстановлении.
Получить дополнительную информацию – наркологическая клиника клиника помощь москве
экскурсии по казани Парк “Кырлай”: Развлечения для Всей Семьи Парк “Кырлай” – это парк развлечений в Казани, где можно найти аттракционы для всех возрастов. Здесь есть карусели, горки, колесо обозрения и многое другое. Парк “Кырлай” – это отличное место для семейного отдыха, где можно весело провести время и получить заряд положительных эмоций.
Терапия наркозависимости требует индивидуального подхода, включающего не только устранение физических симптомов, но и работу с психологическими аспектами болезни. В клинике «Новая Эра» во Владимире применяется мультидисциплинарный подход, сочетающий медикаментозную терапию, психотерапию и социальную поддержку.
Подробнее можно узнать тут – лечение наркомании цена в владимире
Frustrated by WebP files that won’t open on certain devices or platforms? webptojpghero.com provides a quick, straightforward fix. This online tool instantly converts any WebP image into a widely compatible JPG, ready for use in emails, websites, or printed materials. The process is effortless: upload your file, let the conversion engine work, and download your result — all in under a minute. You can process individual files or multiple images at once, making it perfect for both occasional use and high-volume projects. Behind the simple interface is a sophisticated image-processing core that ensures vibrant colors and clear details, even at smaller file sizes. Everything happens securely, with encryption protecting your uploads and automatic deletion safeguarding your privacy. Whether on desktop, tablet, or mobile, WebP to JPG Hero ensures your images are ready for universal access without hassle.
WebP to JPG Converter
Narcology Clinic в Москве оказывает экстренную наркологическую помощь дома — скорая выездная служба выполняет детоксикацию, капельницы и мониторинг до нормализации состояния. Анонимно и круглосуточно.
Исследовать вопрос подробнее – анонимная наркологическая помощь москва
Эта публикация дает возможность задействовать различные источники информации и представить их в удобной форме. Читатели смогут быстро найти нужные данные и получить ответы на интересующие их вопросы. Мы стремимся к четкости и доступности материала для всех!
Узнать напрямую – https://artezzo.life/acuarelas-para-invitados
Эта информационная заметка содержит увлекательные сведения, которые могут вас удивить! Мы собрали интересные факты, которые сделают вашу жизнь ярче и полнее. Узнайте нечто новое о привычных аспектах повседневности и откройте для себя удивительный мир информации.
Открыть полностью – http://www.indetac.com/free-cheats-aimbot-cheat-stealth-injection
Публикация приглашает вас исследовать неизведанное — от древних тайн до современных достижений науки. Вы узнаете, как случайные находки превращались в революции, а смелые мысли — в новые эры человеческого прогресса.
Что ещё? Расскажи всё! – https://rinhquaiphone.tantanvietnam.com/2024/01/22/chao-moi-nguoi
Скорая наркологическая помощь в Москве — Narcology Clinic выезжает круглосуточно напрямую к пациенту. Срочные капельницы, детокс, контроль состояния и экстренная поддержка. Анонимно, профессионально, оперативно.
Подробнее тут – частная наркологическая помощь
Нужна скорая помощь при алкогольном отравлении или запое? В Москве служба Narcology Clinic оказывает неотложную помощь на дому — детокс, капельницы, оказание первой наркологической помощи и сопровождение до стабилизации.
Узнать больше – наркологическая помощь на дому
Этот интересный отчет представляет собой сборник полезных фактов, касающихся актуальных тем. Мы проанализируем данные, чтобы вы могли сделать обоснованные выводы. Читайте, чтобы узнать больше о последних трендах и значимых событиях!
Ознакомьтесь с аналитикой – https://dedyk.pl/index.php/portfolio/slub/_j9a9797
В этой публикации мы предлагаем подробные объяснения по актуальным вопросам, чтобы помочь читателям глубже понять их. Четкость и структурированность материала сделают его удобным для усвоения и применения в повседневной жизни.
Выяснить больше – https://www.aeeaatletismo.es/2022/09/01/ha-fallecido-jose-maria-garcia-presidente-de-honor-de-la-aeeael-mejor-estadistico-de-nuestra-historia
Эта информационная статья содержит полезные факты, советы и рекомендации, которые помогут вам быть в курсе последних тенденций и изменений в выбранной области. Материал составлен так, чтобы быть полезным и понятным каждому.
Расширить кругозор по теме – https://vorticeweb.com/invita-cofetur-a-segunda-edicion-de-vino-litoral-2019
Нужна скорая помощь при алкогольном отравлении или запое? В Москве служба Narcology Clinic оказывает неотложную помощь на дому — детокс, капельницы, оказание первой наркологической помощи и сопровождение до стабилизации.
Изучить вопрос глубже – неотложная наркологическая помощь москве
Эта обзорная заметка содержит ключевые моменты и факты по актуальным вопросам. Она поможет читателям быстро ориентироваться в теме и узнать о самых важных аспектах сегодня. Получите краткий курс по современной информации и оставайтесь в курсе событий!
Заходи — там интересно – https://bitvuttarakhand.com/hello-world
В этом информативном тексте представлены захватывающие события и факты, которые заставят вас задуматься. Мы обращаем внимание на важные моменты, которые часто остаются незамеченными, и предлагаем новые перспективы на привычные вещи. Подготовьтесь к тому, чтобы быть поглощенным увлекательными рассказами!
Узнай первым! – https://vonkvlam.nl/1178-2
Этот текст призван помочь читателю расширить кругозор и получить практические знания. Мы используем простой язык, наглядные примеры и структурированное изложение, чтобы сделать обучение максимально эффективным и увлекательным.
Изучить вопрос глубже – https://f5fashion.vn/patricky-pitbull-net-worth-in-2023-how-rich-is-he-now-update
Narcology Clinic в Москве оказывает экстренную наркологическую помощь дома — скорая выездная служба выполняет детоксикацию, капельницы и мониторинг до нормализации состояния. Анонимно и круглосуточно.
Детальнее – вызов скорой наркологической помощи
Этот информативный текст выделяется своими захватывающими аспектами, которые делают сложные темы доступными и понятными. Мы стремимся предложить читателям глубину знаний вместе с разнообразием интересных фактов. Откройте новые горизонты и развивайте свои способности познавать мир!
Погрузиться в детали – https://www.ys3.org/the-ys3-complete-guide-to-spectrum-games
Для максимальной эффективности и безопасности «Красмед» использует комбинированные подходы:
Подробнее можно узнать тут – нарколог на дом вывод из запоя в красноярске
Доказательная медицина: мы используем только проверенные и эффективные методы, основанные на последних научных исследованиях в области наркологии и психиатрии.
Получить больше информации – срочный вывод из запоя уфа
Образовательные программы: Мы уверены, что знания о зависимости и её последствиях играют важную роль в реабилитации. Мы информируем пациентов о механизмах действия наркотиков и алкоголя на организм, что способствует изменению их отношения к терапии и жизни без зависимостей.
Подробнее тут – скорая вывод из запоя казань
Нужна скорая помощь при алкогольном отравлении или запое? В Москве служба Narcology Clinic оказывает неотложную помощь на дому — детокс, капельницы, оказание первой наркологической помощи и сопровождение до стабилизации.
Получить дополнительную информацию – платная наркологическая помощь москве
Наркологическая клиника “Аура Здоровья” — специализированное учреждение, предоставляющее профессиональную помощь людям, страдающим алкогольной и наркотической зависимостью. Мы стремимся помочь пациентам преодолеть зависимости и обрести контроль над своей жизнью, используя современные методики лечения и поддержки.
Углубиться в тему – https://медицинский-вывод-из-запоя.рф/vyvod-iz-zapoya-anonimno-v-rostove-na-donu.xn--p1ai/
В клинике “Возрождение” работает команда квалифицированных специалистов в области наркологии и психиатрии. Все врачи имеют профильное образование и регулярно повышают свою квалификацию, применяя в практике самые современные методы лечения зависимостей.
Углубиться в тему – https://медицина-вывод-из-запоя.рф/vyvod-iz-zapoya-cena-v-nizhnem-novgoroge.xn--p1ai/
Экстренная помощь при алкоголизме от Narcology Clinic в Москве — выезд врачей в любую точку города, купирование острых состояний, поддержка пациента до стабильного состояния, профессионально и в конфиденциальности.
Узнать больше – наркологическая помощь телефон москве
Врач на дому или в клинике проводит:
Исследовать вопрос подробнее – вывод из запоя круглосуточно новосибирск
Мы верим, что каждый человек, столкнувшийся с проблемой зависимости, заслуживает шанса на новую жизнь. Наша миссия — предоставить необходимые инструменты и поддержку, чтобы помочь пациентам в их стремлении к здоровой и свободной от зависимостей жизни.
Выяснить больше – http://нарко-фильтр.рф
Мы верим, что каждый человек, столкнувшийся с проблемой зависимости, заслуживает шанса на новую жизнь. Наша миссия — предоставить необходимые инструменты и поддержку, чтобы помочь пациентам в их стремлении к выздоровлению и личностному росту.
Углубиться в тему – https://алко-лечение24.рф/vivod-iz-zapoya-cena-v-Sankt-Peterburge/
Если вовремя не принять меры, состояние может усугубиться, повышая риск серьёзных осложнений. Наиболее эффективным способом очищения организма является постановка капельницы, которая помогает быстро стабилизировать состояние. Клиника «Курс на ясность» оказывает экстренную наркологическую помощь с выездом врачей на дом 24/7.
Узнать больше – капельница от запоя в красноярске
Проблема зависимостей остаётся актуальной в обществе. С каждым годом количество людей, страдающих от алкоголизма, наркомании и других зависимостей, растёт. Эти расстройства негативно влияют на качество жизни как самих пациентов, так и их близких. Зависимость — это не только физическое состояние, но и глубокая психологическая проблема. Для эффективного лечения необходимо обратиться к профессионалам, которые помогут справиться с этой болезнью. Наркологическая клиника “Клиника Наркологии и Психотерапии” предоставляет всеобъемлющую помощь, направленную на восстановление здоровья и нормализацию жизни пациентов.
Изучить вопрос глубже – вывод из запоя капельница в смоленске
Если требуется экстренная помощь при алкогольном кризисе — Narcology Clinic Москва предоставляет срочную помощь на дому: выезд нарколога, купирование симптомов, мониторинг состояния, без очередей и задержек.
Ознакомиться с деталями – [url=https://skoraya-narkologicheskaya-pomoshch15.ru/]наркологическая клиника клиника помощь москва[/url]
Запой представляет собой непрерывное бесконтрольное употребление алкоголя в течение нескольких дней и более, при котором человек теряет способность остановиться самостоятельно. Это состояние сопровождается не только абстинентным синдромом, но и риском развития:
Ознакомиться с деталями – вывод из запоя в стационаре санкт-петербруг
В-третьих, реабилитация и ресоциализация. Успешное лечение требует не только устранения физической зависимости. Мы акцентируем внимание на восстановлении социальных связей, улучшении психоэмоционального состояния и формировании новых интересов. Программа включает как групповые, так и индивидуальные занятия, что позволяет пациентам обрести уверенность в себе.
Ознакомиться с деталями – https://алко-лечебница.рф/vivod-iz-zapoya-cena-v-samare
Скорая наркологическая служба Narcology Clinic в Москве работает круглосуточно. Выезд к пациенту, медикаментозная стабилизация, детоксикация и психологическая поддержка до выхода из кризисного состояния.
Детальнее – срочная наркологическая помощь москве
Скорая наркологическая служба Narcology Clinic в Москве работает круглосуточно. Выезд к пациенту, медикаментозная стабилизация, детоксикация и психологическая поддержка до выхода из кризисного состояния.
Получить больше информации – http://skoraya-narkologicheskaya-pomoshch11.ru/http://skoraya-narkologicheskaya-pomoshch11.ru
Базовый метод, сочетающий регидратацию, электролитную коррекцию и витаминные комплексы:
Детальнее – https://medicinskij-vyvod-iz-zapoya.ru/vyvod-iz-zapoya-krulosutochno-krasnoyarsk/
Narcology Clinic в Москве оказывает экстренную наркологическую помощь дома — скорая выездная служба выполняет детоксикацию, капельницы и мониторинг до нормализации состояния. Анонимно и круглосуточно.
Подробнее можно узнать тут – наркологическая клиника клиника помощь
Команда врачей клиники “Чистый Путь” состоит из квалифицированных специалистов в области наркологии с обширным опытом работы. Каждый врач обладает глубокими знаниями в фармакологии, психофармакологии и психотерапии, регулярно повышает свою квалификацию на профильных конференциях и семинарах, чтобы использовать в своей практике самые современные и эффективные методы лечения.
Разобраться лучше – https://срочно-вывод-из-запоя.рф/vyvod-iz-zapoya-anonimno-v-chelyabinske.xn--p1ai/
Экстренная помощь при алкоголизме от Narcology Clinic в Москве — выезд врачей в любую точку города, купирование острых состояний, поддержка пациента до стабильного состояния, профессионально и в конфиденциальности.
Выяснить больше – центр наркологической помощи
Наркологическая клиника “Путь к выздоровлению” — специализированное медицинское учреждение, предназначенное для оказания помощи лицам, страдающим от алкогольной и наркотической зависимости. Наша основная задача — предоставить эффективные методы лечения и поддержку, чтобы помочь пациентам преодолеть пагубное пристрастие и вернуть их к здоровой и полноценной жизни.
Подробнее тут – http://нарко-фильтр.рф
Миссия нашего центра – оказание всесторонней помощи людям с зависимостями. Основные цели нашей работы:
Подробнее тут – вывод из запоя с выездом в казани
Миссия клиники “Перезагрузка” заключается в предоставлении высококвалифицированной помощи людям, страдающим от зависимостей. Мы стремимся создать безопасное пространство для лечения, где каждый пациент сможет получить поддержку и понимание. Наша цель — не просто избавление от зависимости, а восстановление полной жизнедеятельности человека.
Детальнее – анонимный вывод из запоя в краснодаре
Миссия центра “Луч Надежды” — помогать людям, попавшим в плен зависимости, находить путь к выздоровлению. Мы не ограничиваемся лечением, а делаем акцент на профилактике рецидивов, социальной адаптации пациентов и их возвращении к полноценной, радостной жизни без психоактивных веществ.
Подробнее – наркологический вывод из запоя уфа
Медикаментозное лечение — это еще один важный этап. Оно включает использование препаратов, которые помогают пациенту восстановиться как физически, так и психологически. Нарколог контролирует процесс лечения, чтобы исключить побочные эффекты и скорректировать терапию при необходимости.
Изучить вопрос глубже – нарколог на дом анонимно
Наркологическая клиника “Аура Здоровья” — специализированное учреждение, предоставляющее профессиональную помощь людям, страдающим алкогольной и наркотической зависимостью. Мы стремимся помочь пациентам преодолеть зависимости и обрести контроль над своей жизнью, используя современные методики лечения и поддержки.
Подробнее – https://медицинский-вывод-из-запоя.рф/vyvod-iz-zapoya-na-domu-v-rostove-na-donu.xn--p1ai
Если требуется экстренная помощь при алкогольном кризисе — Narcology Clinic Москва предоставляет срочную помощь на дому: выезд нарколога, купирование симптомов, мониторинг состояния, без очередей и задержек.
Углубиться в тему – наркологическая клиника клиника помощь москва
Когда запой выходит за рамки нескольких суток, интоксикация организма достигает критического уровня: нарушается водно-электролитный баланс, появляются признаки токсического поражения печени и нервной системы. В таких случаях самостоятельные попытки прекратить употребление алкоголя могут привести к тяжёлым осложнениям — судорогам, алкогольному психозу, острой сердечной недостаточности. В Санкт-Петербурге и Ленинградской области доступны профессиональные услуги по выводу из запоя, выполняемые опытными наркологами как на дому, так и в специализированных клиниках.
Подробнее можно узнать тут – врач вывод из запоя
Клиника также предлагает долгосрочные программы, которые включают как стационарное, так и амбулаторное лечение. Мы понимаем, что восстановление требует не только медицинской помощи, но и значительной психологической поддержки на каждом этапе.
Углубиться в тему – https://медицина-вывод-из-запоя.рф/vyvod-iz-zapoya-na-domu-v-nizhnem-novgoroge.xn--p1ai/
Мы верим, что каждый человек, столкнувшийся с проблемой зависимости, заслуживает шанса на новую жизнь. Наша миссия — предоставить необходимые инструменты и поддержку, чтобы помочь пациентам в их стремлении к выздоровлению и личностному росту.
Детальнее – https://алко-лечение24.рф/vivod-iz-zapoya-v-kruglosutochno-v-Sankt-Peterburge
В Москве к вашим услугам скорая наркологическая помощь от Narcology Clinic — выезд врача 24/7, качественная помощь при алкогольной интоксикации, стабилизация состояния и организация дальнейших этапов детоксикации.
Подробнее тут – экстренная наркологическая помощь
скачать игры с яндекс диска Скачать игры без торрента: Альтернативные способы пополнить свою коллекцию В мире цифровых развлечений существует множество путей, позволяющих насладиться любимыми играми. Отказ от торрент-трекеров открывает двери к более надежным и безопасным способам загрузки, обеспечивающим спокойствие и уверенность в качестве получаемого контента.
Эти процедуры направлены на фильтрацию плазмы и избавление крови от токсинов:
Получить больше информации – https://medicinskij-vyvod-iz-zapoya.ru/vyvod-iz-zapoya-na-domu-krasnoyarsk
Скорая наркологическая служба Narcology Clinic в Москве работает круглосуточно. Выезд к пациенту, медикаментозная стабилизация, детоксикация и психологическая поддержка до выхода из кризисного состояния.
Подробнее – наркологическая клиника клиника помощь москва
20
Детальнее – скорая наркологическая помощь москве
Мы понимаем уникальность каждого пациента и проводим тщательную диагностику, анализируя его медицинскую историю, психологическое состояние и социальные факторы. На основе полученных данных создаем персональные планы лечения, включающие медикаментозные средства, психотерапию и социальные программы.
Получить дополнительные сведения – https://медицинский-вывод-из-запоя.рф/vyvod-iz-zapoya-v-stacionare-v-rostove-na-donu.xn--p1ai
В современном обществе проблемы наркомании и алкоголизма приобрели особую актуальность, затрагивая не только отдельных людей, но и их близких, и сообщества. Эти зависимости оказывают негативное влияние не только на физическое здоровье, но и на психоэмоциональное состояние, нарушают социальные связи и ухудшают качество жизни. Наркологическая клиника “Здоровое Настоящее” предлагает комплексный и научно обоснованный подход к лечению зависимостей. Мы используем современные методы диагностики и терапии, чтобы помочь пациентам вернуть здоровье и полноценную жизнь.
Выяснить больше – нарколог вывод из запоя
Наркологический центр “Луч Надежды” — это место, где можно найти поддержку и помощь, даже когда кажется, что выход потерян. Наша команда врачей-наркологов, психологов и психотерапевтов использует современные методы лечения и реабилитации, помогая пациентам вернуть трезвость и полноценную жизнь. Мы стремимся не только к устранению симптомов, но и к выявлению причин заболевания, давая пациентам необходимые инструменты для борьбы с тягой к психоактивным веществам и формированию новых жизненных установок.
Углубиться в тему – [url=https://srochno-vyvod-iz-zapoya.ru/vyvod-iz-zapoya-v-stacionare-v-ufe.ru/]вывод из запоя на дому круглосуточно[/url]
Врачебный состав клиники “Путь к выздоровлению” состоит из высококвалифицированных специалистов в области наркологии. Наши врачи-наркологи имеют обширный опыт работы с зависимыми пациентами и постоянно совершенствуют свои навыки.
Получить дополнительные сведения – https://нарко-фильтр.рф/vivod-iz-zapoya-na-domu-v-rostove-na-donu/
Экстренная помощь при алкоголизме от Narcology Clinic в Москве — выезд врачей в любую точку города, купирование острых состояний, поддержка пациента до стабильного состояния, профессионально и в конфиденциальности.
Подробнее – skoraya-narkologicheskaya-pomoshch moskva
Запой представляет собой непрерывное бесконтрольное употребление алкоголя в течение нескольких дней и более, при котором человек теряет способность остановиться самостоятельно. Это состояние сопровождается не только абстинентным синдромом, но и риском развития:
Подробнее можно узнать тут – вывод из запоя капельница на дому в санкт-петербруге
Состав инфузии подбирается врачом индивидуально, с учётом состояния пациента, длительности запоя, возраста и хронических заболеваний.
Получить дополнительную информацию – сколько стоит капельница на дому от запоя в красноярске
Основные показания для обращения в нашу клинику включают.
Изучить вопрос глубже – вывод из запоя на дому недорого
Скорая наркологическая помощь в Москве — Narcology Clinic выезжает круглосуточно напрямую к пациенту. Срочные капельницы, детокс, контроль состояния и экстренная поддержка. Анонимно, профессионально, оперативно.
Получить больше информации – наркологическая помощь на дому московская область
20
Изучить вопрос глубже – наркологическая помощь телефон
Мы уделяем особое внимание индивидуальному подходу к каждому пациенту, понимая, что причины и проявления зависимости у всех разные. Тщательная диагностика позволяет учитывать медицинские, психологические и социальные аспекты каждого случая, на основе чего разрабатываются персонализированные программы лечения. Они включают медикаментозную терапию, психотерапевтические методы и мероприятия по социальной адаптации.
Подробнее – https://срочно-вывод-из-запоя.рф/vyvod-iz-zapoya-v-kruglosutochno-v-chelyabinske.xn--p1ai/
new york freight freight shipping new york
Миссия клиники — оказание комплексной помощи людям с зависимостями. Основные задачи, которые мы ставим перед собой:
Углубиться в тему – http://медицина-вывод-из-запоя.рф/
20
Получить дополнительную информацию – наркологическая помощь
компьютер Купить игровой компьютер: Врата в виртуальные миры. Игровой компьютер – это не просто устройство, это инвестиция в эмоции и впечатления. Он должен обеспечивать максимальную производительность, чтобы вы могли наслаждаться любимыми играми без задержек и ограничений. Выбирайте компоненты, способные справиться с самыми современными графическими требованиями, и не забудьте про качественную систему охлаждения.
Эти процедуры направлены на фильтрацию плазмы и избавление крови от токсинов:
Получить дополнительную информацию – вывод из запоя дешево красноярск
Миссия клиники “Маяк надежды” заключается в содействии восстановлению здоровья и социальной реинтеграции людей, столкнувшихся с проблемами зависимости. Мы стремимся к комплексному решению этой сложной задачи, учитывая физические, психологические и социальные аспекты зависимости. Наша задача — не только помочь пациентам избавиться от физической зависимости, но и обеспечить их психологическое восстановление и возвращение к нормальной жизни в обществе.
Узнать больше – http://алко-лечение24.рф/vivod-iz-zapoya-anonimno-v-Sankt-Peterburge/
Скорая наркологическая служба Narcology Clinic в Москве работает круглосуточно. Выезд к пациенту, медикаментозная стабилизация, детоксикация и психологическая поддержка до выхода из кризисного состояния.
Изучить вопрос глубже – центр наркологической помощи
Экстренная помощь при алкоголизме от Narcology Clinic в Москве — выезд врачей в любую точку города, купирование острых состояний, поддержка пациента до стабильного состояния, профессионально и в конфиденциальности.
Углубиться в тему – скорая наркологическая помощь москве
Наркологическая клиника “Аура Здоровья” расположена по адресу: г. Ростов-на-Дону, ул. Фрунзе, д. 17/2.
Подробнее тут – http://медицинский-вывод-из-запоя.рф
https://tenmoscow.ru/nabor-2-sht-rychka-dlya-holodilnika-atlant-1704-verhnyaya-km26591069
Существуют различные методы и стратегии, которые применяются для устранения зависимостей. Каждый случай уникален, поэтому важно проводить глубокую диагностику и индивидуально разрабатывать план лечения. Мы понимаем, что борьба с зависимостью — это длительный процесс, требующий как медицинской, так и психологической поддержки.
Получить больше информации – вывод из запоя на дому цена краснодар
В современном обществе проблемы наркомании и алкоголизма приобрели особую актуальность, затрагивая не только отдельных людей, но и их близких, и сообщества. Эти зависимости оказывают негативное влияние не только на физическое здоровье, но и на психоэмоциональное состояние, нарушают социальные связи и ухудшают качество жизни. Наркологическая клиника “Здоровое Настоящее” предлагает комплексный и научно обоснованный подход к лечению зависимостей. Мы используем современные методы диагностики и терапии, чтобы помочь пациентам вернуть здоровье и полноценную жизнь.
Разобраться лучше – вывод из запоя вызов на дом в казани
Индивидуальный подход: каждый пациент уникален, поэтому мы разрабатываем индивидуальный план лечения, учитывающий вид зависимости, стадию заболевания и особенности здоровья пациента.
Узнать больше – вывод из запоя на дому недорого
Миссия клиники “Свобода” заключается в оказании качественной помощи людям, страдающим от зависимости. Мы стремимся не просто избавить от пагубной привычки, но и помочь восстановить личность пациента. Важнейшие цели нашей работы включают:
Углубиться в тему – https://алко-лечебница.рф/vivod-iz-zapoya-na-domu-v-samare
Когда запой выходит за рамки нескольких суток, интоксикация организма достигает критического уровня: нарушается водно-электролитный баланс, появляются признаки токсического поражения печени и нервной системы. В таких случаях самостоятельные попытки прекратить употребление алкоголя могут привести к тяжёлым осложнениям — судорогам, алкогольному психозу, острой сердечной недостаточности. В Санкт-Петербурге и Ленинградской области доступны профессиональные услуги по выводу из запоя, выполняемые опытными наркологами как на дому, так и в специализированных клиниках.
Получить дополнительные сведения – http://nadezhnyj-vyvod-iz-zapoya.ru
Этот формат позволяет пациентам получить профессиональную помощь в комфортной домашней обстановке. Такой подход не только обеспечивает удобство, но и гарантирует конфиденциальность, что особенно важно для многих людей.
Получить дополнительную информацию – https://narcolog-na-dom-v-krasnoyarske55.ru
20
Получить больше информации – неотложная наркологическая помощь москва
В экстренной ситуации на фоне алкоголя — обращайтесь к скорой помощи Narcology Clinic в Москве. Качественный выезд нарколога, медицинская поддержка, нейтрализация последствий и помощь в восстановлении.
Подробнее – наркологическая клиника клиника помощь
Запчасти для стиральной машины Ariston AVL100R Запчасти для пылесоса Samsung VC 6161: Чистота без компромиссов. Поддерживайте мощность и эффективность вашего пылесоса, заменяя изношенные детали вовремя.
Врачебный состав клиники “Путь к выздоровлению” состоит из высококвалифицированных специалистов в области наркологии. Наши врачи-наркологи имеют обширный опыт работы с зависимыми пациентами и постоянно совершенствуют свои навыки.
Получить дополнительную информацию – http://нарко-фильтр.рф/vivod-iz-zapoya-v-stacionare-v-rostove-na-donu/
Для максимальной эффективности и безопасности «Красмед» использует комбинированные подходы:
Ознакомиться с деталями – вывод из запоя недорого красноярск
Если требуется экстренная помощь при алкогольном кризисе — Narcology Clinic Москва предоставляет срочную помощь на дому: выезд нарколога, купирование симптомов, мониторинг состояния, без очередей и задержек.
Получить больше информации – анонимная скорая наркологическая помощь москва
Наркологическая клиника “Возрождение” находится по адресу: ул. Агрономическая, д. 122А, г. Нижний Новгород, Россия. Мы открыты для вас круглосуточно и также предлагаем онлайн-консультации, чтобы сделать наши услуги более доступными.
Исследовать вопрос подробнее – https://медицина-вывод-из-запоя.рф/vyvod-iz-zapoya-na-domu-v-nizhnem-novgoroge.xn--p1ai
скачать игры без торрента Безопасность прежде всего: Защитите свой компьютер от угроз Выбирая легальные способы получения игр, вы не только поддерживаете разработчиков, но и защищаете свой компьютер от вирусов и вредоносного программного обеспечения. Ваша безопасность – наш приоритет.
I’m gone to convey my little brother, that he should also pay a visit this blog on regular basis to obtain updated from most up-to-date reports.
Stretch limo near me
Наркологическая клиника “Аура Здоровья” расположена по адресу: г. Ростов-на-Дону, ул. Фрунзе, д. 17/2.
Разобраться лучше – https://медицинский-вывод-из-запоя.рф/vyvod-iz-zapoya-anonimno-v-rostove-na-donu.xn--p1ai/
Скорая наркологическая помощь в Москве — Narcology Clinic выезжает круглосуточно напрямую к пациенту. Срочные капельницы, детокс, контроль состояния и экстренная поддержка. Анонимно, профессионально, оперативно.
Выяснить больше – наркологическая помощь москва
Наркологическая клиника “Маяк надежды” — специализированное медицинское учреждение, предназначенное для оказания помощи лицам, страдающим от алкогольной и наркотической зависимости. Наша цель — предоставить эффективные методы лечения и поддержку, чтобы помочь пациентам преодолеть пагубное пристрастие и вернуть их к здоровой и полноценной жизни.
Углубиться в тему – http://алко-лечение24.рф
Экстренная наркологическая служба в Москве от Narcology Clinic предлагает оперативный выезд врача на дом. Срочный детокс, стабилизация и круглосуточная поддержка пациента с полным соблюдением конфиденциальности.
Подробнее тут – экстренная наркологическая помощь
Таким образом, наш подход направлен на создание комплексной системы поддержки, которая помогает каждому пациенту справиться с зависимостью и вернуться к полноценной жизни.
Изучить вопрос глубже – вывод из запоя дешево казань
Если требуется экстренная помощь при алкогольном кризисе — Narcology Clinic Москва предоставляет срочную помощь на дому: выезд нарколога, купирование симптомов, мониторинг состояния, без очередей и задержек.
Узнать больше – вызвать наркологическую помощь москва
Идеален для пациентов со средней степенью интоксикации, не требующих круглосуточного мониторинга. Данная схема позволяет:
Исследовать вопрос подробнее – вывод из запоя капельница
Анонимность и конфиденциальность: мы гарантируем полную анонимность и конфиденциальность лечения, понимая деликатность проблемы зависимости.
Узнать больше – вывод из запоя круглосуточно в уфе
Команда врачей клиники “Чистый Путь” состоит из квалифицированных специалистов в области наркологии с обширным опытом работы. Каждый врач обладает глубокими знаниями в фармакологии, психофармакологии и психотерапии, регулярно повышает свою квалификацию на профильных конференциях и семинарах, чтобы использовать в своей практике самые современные и эффективные методы лечения.
Разобраться лучше – https://срочно-вывод-из-запоя.рф/vyvod-iz-zapoya-v-stacionare-v-chelyabinske.xn--p1ai
Экстренная помощь при алкоголизме от Narcology Clinic в Москве — выезд врачей в любую точку города, купирование острых состояний, поддержка пациента до стабильного состояния, профессионально и в конфиденциальности.
Разобраться лучше – наркологическая помощь на дому
Наркологическая клиника “Путь к выздоровлению” — специализированное медицинское учреждение, предназначенное для оказания помощи лицам, страдающим от алкогольной и наркотической зависимости. Наша основная задача — предоставить эффективные методы лечения и поддержку, чтобы помочь пациентам преодолеть пагубное пристрастие и вернуть их к здоровой и полноценной жизни.
Получить больше информации – https://нарко-фильтр.рф/vivod-iz-zapoya-v-kruglosutochno-v-rostove-na-donu/
Основные показания для обращения в нашу клинику включают.
Подробнее – вывод из запоя на дому смоленск
Для максимальной эффективности и безопасности «Красмед» использует комбинированные подходы:
Изучить вопрос глубже – помощь вывод из запоя
1xbet.apk скачать
салон красоты севастополь Перманент бровей Симферополь: Красота без границ. Теперь и в Симферополе доступны услуги перманентного макияжа бровей от опытных мастеров.
Компоненты капельницы
Углубиться в тему – врача капельницу от запоя в красноярске
Если требуется экстренная помощь при алкогольном кризисе — Narcology Clinic Москва предоставляет срочную помощь на дому: выезд нарколога, купирование симптомов, мониторинг состояния, без очередей и задержек.
Получить дополнительные сведения – платная наркологическая помощь
betturkey2.com
Наркологическая клиника “Аура Здоровья” — специализированное учреждение, предоставляющее профессиональную помощь людям, страдающим алкогольной и наркотической зависимостью. Мы стремимся помочь пациентам преодолеть зависимости и обрести контроль над своей жизнью, используя современные методики лечения и поддержки.
Подробнее можно узнать тут – http://медицинский-вывод-из-запоя.рф
взлом телеграмм Профили на сайтах знакомств. Узнайте правду о своих партнерах и конкурентах. Разоблачайте обман и манипуляции.
Наркологическая клиника “Возрождение” находится по адресу: ул. Агрономическая, д. 122А, г. Нижний Новгород, Россия. Мы открыты для вас круглосуточно и также предлагаем онлайн-консультации, чтобы сделать наши услуги более доступными.
Получить больше информации – http://медицина-вывод-из-запоя.рф/
20
Подробнее – вызвать наркологическую помощь москва
https://t.me/s/zerkalo1x 1хбет зеркало. Не упустите ни единого шанса на победу! Получите мгновенный доступ к платформе, даже если основной сайт недоступен. Наслаждайтесь любимыми играми и ставками в любое время и в любом месте, без каких-либо препятствий.
В экстренной ситуации на фоне алкоголя — обращайтесь к скорой помощи Narcology Clinic в Москве. Качественный выезд нарколога, медицинская поддержка, нейтрализация последствий и помощь в восстановлении.
Подробнее можно узнать тут – наркологическая помощь
Нужна скорая помощь при алкогольном отравлении или запое? В Москве служба Narcology Clinic оказывает неотложную помощь на дому — детокс, капельницы, оказание первой наркологической помощи и сопровождение до стабилизации.
Ознакомиться с деталями – круглосуточная наркологическая помощь москве
Миссия клиники “Перезагрузка” заключается в предоставлении высококвалифицированной помощи людям, страдающим от зависимостей. Мы стремимся создать безопасное пространство для лечения, где каждый пациент сможет получить поддержку и понимание. Наша цель — не просто избавление от зависимости, а восстановление полной жизнедеятельности человека.
Выяснить больше – вывод из запоя недорого в краснодаре
Печень отвечает за метаболизм этанола, превращая его в ацетальдегид, а затем в уксусную кислоту. При запое этот процесс нарушается из-за перегрузки ферментных систем, что усугубляет интоксикацию. Нагрузка на почки возрастает вследствие обезвоживания и электролитных нарушений, что может привести к острому почечному синдрому.
Получить больше информации – вывод из запоя с выездом санкт-петербруг
Образовательные программы: Мы уверены, что знания о зависимости и её последствиях играют важную роль в реабилитации. Мы информируем пациентов о механизмах действия наркотиков и алкоголя на организм, что способствует изменению их отношения к терапии и жизни без зависимостей.
Изучить вопрос глубже – наркологический вывод из запоя в казани
Анонимность и конфиденциальность: мы гарантируем полную анонимность и конфиденциальность лечения, понимая деликатность проблемы зависимости.
Подробнее можно узнать тут – наркология вывод из запоя в уфе
Инфузии выполняются с помощью автоматизированных насосов, позволяющих скорректировать скорость введения в зависимости от показателей безопасности.
Разобраться лучше – http://medicinskij-vyvod-iz-zapoya.ru/
Мы верим, что каждый человек, столкнувшийся с проблемой зависимости, заслуживает шанса на новую жизнь. Наша миссия — предоставить необходимые инструменты и поддержку, чтобы помочь пациентам в их стремлении к выздоровлению и личностному росту.
Детальнее – https://алко-лечение24.рф
Наркологическая клиника “Путь к выздоровлению” — специализированное медицинское учреждение, предназначенное для оказания помощи лицам, страдающим от алкогольной и наркотической зависимости. Наша основная задача — предоставить эффективные методы лечения и поддержку, чтобы помочь пациентам преодолеть пагубное пристрастие и вернуть их к здоровой и полноценной жизни.
Получить больше информации – https://нарко-фильтр.рф/vivod-iz-zapoya-cena-v-rostove-na-donu
Наркологическая клиника “Аура Здоровья” — специализированное учреждение, предоставляющее профессиональную помощь людям, страдающим алкогольной и наркотической зависимостью. Мы стремимся помочь пациентам преодолеть зависимости и обрести контроль над своей жизнью, используя современные методики лечения и поддержки.
Выяснить больше – https://медицинский-вывод-из-запоя.рф/vyvod-iz-zapoya-anonimno-v-rostove-na-donu.xn--p1ai/
20
Получить дополнительную информацию – платная наркологическая помощь москва
здоровье красота Красота: проявление уверенности и любви к себе. Когда вы любите себя и заботитесь о себе, это отражается на вашем внешнем виде. Сияющая кожа, блестящие волосы и уверенная улыбка – это то, что делает вас неповторимыми.
Этот формат позволяет пациентам получить профессиональную помощь в комфортной домашней обстановке. Такой подход не только обеспечивает удобство, но и гарантирует конфиденциальность, что особенно важно для многих людей.
Разобраться лучше – нарколог на дом красноярск.
Наши специалисты всегда относятся к пациентам с уважением и вниманием, создавая атмосферу доверия и поддержки. Они проводят всестороннее обследование, выявляют причины зависимости и разрабатывают индивидуальные стратегии лечения. Профессионализм и компетентность врачей являются основой успешного восстановления наших пациентов.
Получить дополнительную информацию – https://срочно-вывод-из-запоя.рф/vyvod-iz-zapoya-anonimno-v-chelyabinske.xn--p1ai/
Скорая наркологическая служба Narcology Clinic в Москве работает круглосуточно. Выезд к пациенту, медикаментозная стабилизация, детоксикация и психологическая поддержка до выхода из кризисного состояния.
Детальнее – наркологическая помощь на дому
В-четвёртых, просветительская работа. Мы проводим лекции и семинары, направленные на повышение уровня осведомленности общества о проблемах зависимости. Это важно для формирования толерантного отношения к людям, страдающим от зависимостей.
Узнать больше – http://алко-лечебница.рф
Клиника также предлагает долгосрочные программы, которые включают как стационарное, так и амбулаторное лечение. Мы понимаем, что восстановление требует не только медицинской помощи, но и значительной психологической поддержки на каждом этапе.
Разобраться лучше – http://медицина-вывод-из-запоя.рф/
Идеален для пациентов со средней степенью интоксикации, не требующих круглосуточного мониторинга. Данная схема позволяет:
Углубиться в тему – врач вывод из запоя
Эти процедуры направлены на фильтрацию плазмы и избавление крови от токсинов:
Подробнее можно узнать тут – https://medicinskij-vyvod-iz-zapoya.ru/vyvod-iz-zapoya-czena-krasnoyarsk
В экстренной ситуации на фоне алкоголя — обращайтесь к скорой помощи Narcology Clinic в Москве. Качественный выезд нарколога, медицинская поддержка, нейтрализация последствий и помощь в восстановлении.
Получить дополнительную информацию – наркологическая помощь на дому москва
Нужна скорая помощь при алкогольном отравлении или запое? В Москве служба Narcology Clinic оказывает неотложную помощь на дому — детокс, капельницы, оказание первой наркологической помощи и сопровождение до стабилизации.
Изучить вопрос глубже – narkologicheskaya-pomoshch moskva
Наркологическая клиника “Аура Здоровья” расположена по адресу: г. Ростов-на-Дону, ул. Фрунзе, д. 17/2.
Подробнее можно узнать тут – http://медицинский-вывод-из-запоя.рф
20
Изучить вопрос глубже – наркологическая помощь телефон москва
Образовательные программы: Мы уверены, что знания о зависимости и её последствиях играют важную роль в реабилитации. Мы информируем пациентов о механизмах действия наркотиков и алкоголя на организм, что способствует изменению их отношения к терапии и жизни без зависимостей.
Выяснить больше – нарколог на дом вывод из запоя в казани
Зависимость — это хроническое заболевание, которое разрушает не только физическое, но и психическое здоровье человека. Она подчиняет волю, искажает восприятие, разрушает семьи и судьбы. Алкоголизм, наркомания, игровая зависимость — лишь разные проявления одной проблемы, требующей профессионального и комплексного подхода.
Получить дополнительные сведения – анонимный вывод из запоя уфа
Основные показания для обращения в нашу клинику включают.
Разобраться лучше – нарколог на дом вывод из запоя в смоленске
Внутривенная инфузия – это один из самых быстрых и безопасных способов очистки организма от алкоголя и его токсичных продуктов распада. Она позволяет:
Узнать больше – https://kapelnica-ot-zapoya-krasnoyarsk6.ru/kapelnicza-ot-zapoya-na-domu-krasnoyarsk/
Мы верим, что каждый человек, столкнувшийся с проблемой зависимости, заслуживает шанса на новую жизнь. Наша миссия — предоставить необходимые инструменты и поддержку, чтобы помочь пациентам в их стремлении к выздоровлению и личностному росту.
Подробнее тут – http://алко-лечение24.рф
Миссия клиники “Путь к выздоровлению” заключается в содействии восстановлению здоровья и социальной реинтеграции людей, столкнувшихся с проблемами зависимости. Мы стремимся к комплексному решению этой сложной задачи, учитывая физические, психологические и социальные аспекты зависимости. Наша цель — не только помочь пациентам избавиться от физической зависимости, но и обеспечить их психологическое восстановление и возвращение к нормальной жизни в обществе.
Разобраться лучше – http://нарко-фильтр.рф
Когда запой выходит за рамки нескольких суток, интоксикация организма достигает критического уровня: нарушается водно-электролитный баланс, появляются признаки токсического поражения печени и нервной системы. В таких случаях самостоятельные попытки прекратить употребление алкоголя могут привести к тяжёлым осложнениям — судорогам, алкогольному психозу, острой сердечной недостаточности. В Санкт-Петербурге и Ленинградской области доступны профессиональные услуги по выводу из запоя, выполняемые опытными наркологами как на дому, так и в специализированных клиниках.
Подробнее можно узнать тут – вывод из запоя круглосуточно в санкт-петербруге
Narcology Clinic в Москве оказывает экстренную наркологическую помощь дома — скорая выездная служба выполняет детоксикацию, капельницы и мониторинг до нормализации состояния. Анонимно и круглосуточно.
Выяснить больше – скорая наркологическая помощь москва
Наш подход охватывает все аспекты реабилитации, помогая пациентам справиться с зависимостями и вернуться к полноценной жизни.
Исследовать вопрос подробнее – http://медицина-вывод-из-запоя.рф
Для максимальной эффективности и безопасности «Красмед» использует комбинированные подходы:
Выяснить больше – вывод из запоя на дому цена в красноярске
Наркологическая клиника “Аура Здоровья” расположена по адресу: г. Ростов-на-Дону, ул. Фрунзе, д. 17/2.
Детальнее – https://медицинский-вывод-из-запоя.рф/vyvod-iz-zapoya-cena-v-rostove-na-donu.xn--p1ai/
Существуют различные методы и стратегии, которые применяются для устранения зависимостей. Каждый случай уникален, поэтому важно проводить глубокую диагностику и индивидуально разрабатывать план лечения. Мы понимаем, что борьба с зависимостью — это длительный процесс, требующий как медицинской, так и психологической поддержки.
Ознакомиться с деталями – помощь вывод из запоя краснодар
Скорая наркологическая помощь в Москве — Narcology Clinic выезжает круглосуточно напрямую к пациенту. Срочные капельницы, детокс, контроль состояния и экстренная поддержка. Анонимно, профессионально, оперативно.
Узнать больше – частная наркологическая помощь москве
Образовательные программы: Мы уверены, что знания о зависимости и её последствиях играют важную роль в реабилитации. Мы информируем пациентов о механизмах действия наркотиков и алкоголя на организм, что способствует изменению их отношения к терапии и жизни без зависимостей.
Ознакомиться с деталями – помощь вывод из запоя
Наркологический центр “Луч Надежды” — это место, где можно найти поддержку и помощь, даже когда кажется, что выход потерян. Наша команда врачей-наркологов, психологов и психотерапевтов использует современные методы лечения и реабилитации, помогая пациентам вернуть трезвость и полноценную жизнь. Мы стремимся не только к устранению симптомов, но и к выявлению причин заболевания, давая пациентам необходимые инструменты для борьбы с тягой к психоактивным веществам и формированию новых жизненных установок.
Получить дополнительную информацию – наркология вывод из запоя в уфе
Наркологическая клиника “Чистый Путь” находится по адресу: г. Челябинск, ул. Пушкина, д. 68, корп. 1. Мы работаем ежедневно с 9:00 до 21:00 без выходных. Наши специалисты всегда готовы проконсультировать вас и ответить на все вопросы, касающиеся лечения зависимостей. Мы гарантируем конфиденциальность и индивидуальный подход к каждому пациенту.
Детальнее – http://срочно-вывод-из-запоя.рф
В экстренной ситуации на фоне алкоголя — обращайтесь к скорой помощи Narcology Clinic в Москве. Качественный выезд нарколога, медицинская поддержка, нейтрализация последствий и помощь в восстановлении.
Подробнее – skoraya-narkologicheskaya-pomoshch moskva
Экстренная помощь при алкоголизме от Narcology Clinic в Москве — выезд врачей в любую точку города, купирование острых состояний, поддержка пациента до стабильного состояния, профессионально и в конфиденциальности.
Ознакомиться с деталями – [url=https://skoraya-narkologicheskaya-pomoshch11.ru/]вызов скорой наркологической помощи москва[/url]
Миссия клиники “Путь к выздоровлению” заключается в содействии восстановлению здоровья и социальной реинтеграции людей, столкнувшихся с проблемами зависимости. Мы стремимся к комплексному решению этой сложной задачи, учитывая физические, психологические и социальные аспекты зависимости. Наша цель — не только помочь пациентам избавиться от физической зависимости, но и обеспечить их психологическое восстановление и возвращение к нормальной жизни в обществе.
Исследовать вопрос подробнее – http://нарко-фильтр.рф/vivod-iz-zapoya-anonimno-v-rostove-na-donu/
Современная наркология предлагает два основных формата вывода из запоя:
Исследовать вопрос подробнее – http://www.domen.ru
В экстренной ситуации на фоне алкоголя — обращайтесь к скорой помощи Narcology Clinic в Москве. Качественный выезд нарколога, медицинская поддержка, нейтрализация последствий и помощь в восстановлении.
Изучить вопрос глубже – наркологическая помощь на дому москва
20
Разобраться лучше – наркологическая клиника клиника помощь москве
Мы понимаем уникальность каждого пациента и проводим тщательную диагностику, анализируя его медицинскую историю, психологическое состояние и социальные факторы. На основе полученных данных создаем персональные планы лечения, включающие медикаментозные средства, психотерапию и социальные программы.
Разобраться лучше – https://медицинский-вывод-из-запоя.рф/
Наш подход охватывает все аспекты реабилитации, помогая пациентам справиться с зависимостями и вернуться к полноценной жизни.
Получить дополнительные сведения – http://медицина-вывод-из-запоя.рф
Современная жизнь, особенно в крупном городе, как Красноярск, часто становится причиной различных зависимостей. Работа в условиях постоянного стресса, высокий ритм жизни и эмоциональные перегрузки могут привести к проблемам, которые требуют неотложной медицинской помощи. Одним из наиболее удобных решений в такой ситуации является вызов нарколога на дом.
Изучить вопрос глубже – врач нарколог на дом
Наркологическая клиника “Маяк надежды” — специализированное медицинское учреждение, предназначенное для оказания помощи лицам, страдающим от алкогольной и наркотической зависимости. Наша цель — предоставить эффективные методы лечения и поддержку, чтобы помочь пациентам преодолеть пагубное пристрастие и вернуть их к здоровой и полноценной жизни.
Углубиться в тему – https://алко-лечение24.рф/vivod-iz-zapoya-v-kruglosutochno-v-Sankt-Peterburge/
Narcology Clinic в Москве оказывает экстренную наркологическую помощь дома — скорая выездная служба выполняет детоксикацию, капельницы и мониторинг до нормализации состояния. Анонимно и круглосуточно.
Ознакомиться с деталями – вызвать наркологическую помощь москва
Для максимальной эффективности и безопасности «Красмед» использует комбинированные подходы:
Изучить вопрос глубже – вывод из запоя на дому недорого в красноярске
Врачебный состав клиники “Путь к выздоровлению” состоит из высококвалифицированных специалистов в области наркологии. Наши врачи-наркологи имеют обширный опыт работы с зависимыми пациентами и постоянно совершенствуют свои навыки.
Ознакомиться с деталями – http://нарко-фильтр.рф
Доказательная медицина: мы используем только проверенные и эффективные методы, основанные на последних научных исследованиях в области наркологии и психиатрии.
Исследовать вопрос подробнее – вывод из запоя с выездом уфа
Таким образом, наш подход направлен на создание комплексной системы поддержки, которая помогает каждому пациенту справиться с зависимостью и вернуться к полноценной жизни.
Изучить вопрос глубже – врач вывод из запоя
В нашей практике применяется множество методик, направленных на восстановление физического и психоэмоционального состояния. Наша команда профессионалов готова поддержать и направить каждого пациента на пути к здоровой жизни.
Исследовать вопрос подробнее – https://алко-лечебница.рф/vivod-iz-zapoya-v-stacionare-v-samare/
Этанол связывается с ГАМК-рецепторами, усиливая тормозные процессы в ЦНС, что ведёт к снижению рефлексов и когнитивных функций. Одновременно происходит повышение активности дофаминовых путей, вызывая ощущение кратковременного «успокоения» и «радости». При прекращении поступления алкоголя к рецепторам наступает синдром отмены — резкое возбуждение, тревожность и дисбаланс нейротрансмиттеров.
Узнать больше – вывод из запоя на дому цена санкт-петербруг
Миссия клиники заключается в предоставлении качественной помощи людям, страдающим от различных зависимостей. Мы понимаем, что зависимость — это заболевание, требующее комплексного подхода. В “Клиника Наркологии и Психотерапии” мы стремимся создать атмосферу доверия, где каждый пациент может открыто говорить о своих проблемах, получая поддержку от опытных специалистов. Наша команда предлагает лечение, основанное на научных данных и современных методах, что позволяет достигать высоких результатов.
Узнать больше – наркология вывод из запоя
Чрезмерное употребление алкоголя приводит к отравлению организма, негативно сказываясь на работе внутренних органов, уровне жидкости и общем самочувствии. Длительные запои сопровождаются тяжёлыми последствиями, включая нарушения сердечной деятельности, сбои в работе печени, скачки давления и психоэмоциональные расстройства.
Получить больше информации – капельница от запоя стоимость красноярск
Мы понимаем уникальность каждого пациента и проводим тщательную диагностику, анализируя его медицинскую историю, психологическое состояние и социальные факторы. На основе полученных данных создаем персональные планы лечения, включающие медикаментозные средства, психотерапию и социальные программы.
Выяснить больше – https://медицинский-вывод-из-запоя.рф/
Скорая наркологическая помощь в Москве — Narcology Clinic выезжает круглосуточно напрямую к пациенту. Срочные капельницы, детокс, контроль состояния и экстренная поддержка. Анонимно, профессионально, оперативно.
Углубиться в тему – срочная наркологическая помощь
Врачебный состав клиники “Путь к выздоровлению” состоит из высококвалифицированных специалистов в области наркологии. Наши врачи-наркологи имеют обширный опыт работы с зависимыми пациентами и постоянно совершенствуют свои навыки.
Получить дополнительную информацию – https://нарко-фильтр.рф/vivod-iz-zapoya-cena-v-rostove-na-donu
20
Разобраться лучше – наркологическая клиника клиника помощь московская область
Мы уделяем особое внимание индивидуальному подходу к каждому пациенту, понимая, что причины и проявления зависимости у всех разные. Тщательная диагностика позволяет учитывать медицинские, психологические и социальные аспекты каждого случая, на основе чего разрабатываются персонализированные программы лечения. Они включают медикаментозную терапию, психотерапевтические методы и мероприятия по социальной адаптации.
Получить дополнительную информацию – https://срочно-вывод-из-запоя.рф/vyvod-iz-zapoya-na-domu-v-chelyabinske.xn--p1ai/
Наш подход охватывает все аспекты реабилитации, помогая пациентам справиться с зависимостями и вернуться к полноценной жизни.
Подробнее можно узнать тут – https://медицина-вывод-из-запоя.рф
Для максимальной эффективности и безопасности «Красмед» использует комбинированные подходы:
Получить дополнительную информацию – http://medicinskij-vyvod-iz-zapoya.ru
Экстренная наркологическая служба в Москве от Narcology Clinic предлагает оперативный выезд врача на дом. Срочный детокс, стабилизация и круглосуточная поддержка пациента с полным соблюдением конфиденциальности.
Получить дополнительную информацию – анонимная наркологическая помощь москве
Во-первых, важным направлением является комплексная диагностика. Понимание глубинных причин зависимости позволяет создавать индивидуальные планы лечения. Это может включать как медикаментозные препараты для детоксикации организма, так и психотерапевтические методы, направленные на изменение поведения и мышления.
Исследовать вопрос подробнее – http://zavisim-alko.ru/vivod-iz-zapoya-v-stacionare-v-krasnodare/https://zavisim-alko.ru
Наркологический центр “Луч Надежды” — это место, где можно найти поддержку и помощь, даже когда кажется, что выход потерян. Наша команда врачей-наркологов, психологов и психотерапевтов использует современные методы лечения и реабилитации, помогая пациентам вернуть трезвость и полноценную жизнь. Мы стремимся не только к устранению симптомов, но и к выявлению причин заболевания, давая пациентам необходимые инструменты для борьбы с тягой к психоактивным веществам и формированию новых жизненных установок.
Разобраться лучше – вывод из запоя на дому цена
В современном обществе проблемы наркомании и алкоголизма приобрели особую актуальность, затрагивая не только отдельных людей, но и их близких, и сообщества. Эти зависимости оказывают негативное влияние не только на физическое здоровье, но и на психоэмоциональное состояние, нарушают социальные связи и ухудшают качество жизни. Наркологическая клиника “Здоровое Настоящее” предлагает комплексный и научно обоснованный подход к лечению зависимостей. Мы используем современные методы диагностики и терапии, чтобы помочь пациентам вернуть здоровье и полноценную жизнь.
Узнать больше – скорая вывод из запоя казань
Скорая наркологическая служба Narcology Clinic в Москве работает круглосуточно. Выезд к пациенту, медикаментозная стабилизация, детоксикация и психологическая поддержка до выхода из кризисного состояния.
Исследовать вопрос подробнее – частная наркологическая помощь москве
https://t.me/TripScan_TripScan Трипскан: Ваш надежный спутник в мире грез и открытий. Мы предоставляем доступ к эксклюзивной информации, помогаем спланировать идеальный маршрут и обеспечиваем поддержку на каждом этапе вашего путешествия. Доверьтесь профессионалам и наслаждайтесь каждым моментом!
Наркологическая клиника “Маяк надежды” расположена по адресу: г. Санкт-Петербург, ул. Колпинская, д. 27. Клиника работает ежедневно с 9:00 до 21:00, без выходных. Наши специалисты готовы предоставить консультацию и ответить на все вопросы, связанные с лечением зависимостей. Мы гарантируем конфиденциальность и индивидуальный подход к каждому пациенту.
Ознакомиться с деталями – http://алко-лечение24.рф/vivod-iz-zapoya-na-domu-v-Sankt-Peterburge/
Если требуется экстренная помощь при алкогольном кризисе — Narcology Clinic Москва предоставляет срочную помощь на дому: выезд нарколога, купирование симптомов, мониторинг состояния, без очередей и задержек.
Выяснить больше – экстренная наркологическая помощь москве
Миссия клиники “Путь к выздоровлению” заключается в содействии восстановлению здоровья и социальной реинтеграции людей, столкнувшихся с проблемами зависимости. Мы стремимся к комплексному решению этой сложной задачи, учитывая физические, психологические и социальные аспекты зависимости. Наша цель — не только помочь пациентам избавиться от физической зависимости, но и обеспечить их психологическое восстановление и возвращение к нормальной жизни в обществе.
Ознакомиться с деталями – https://нарко-фильтр.рф/vivod-iz-zapoya-cena-v-rostove-na-donu/
лучшая жизнь Перемены в жизни: Отбросьте оковы старых убеждений, словно змея сбрасывает кожу. Перемены – это не угроза, а шанс расправить крылья, ощутить свежий ветер свободы. Примите вызов неизведанного, и мир откроется вам с новой, неожиданной стороны.
Этанол связывается с ГАМК-рецепторами, усиливая тормозные процессы в ЦНС, что ведёт к снижению рефлексов и когнитивных функций. Одновременно происходит повышение активности дофаминовых путей, вызывая ощущение кратковременного «успокоения» и «радости». При прекращении поступления алкоголя к рецепторам наступает синдром отмены — резкое возбуждение, тревожность и дисбаланс нейротрансмиттеров.
Ознакомиться с деталями – скорая вывод из запоя санкт-петербруг
Основная задача клиники — способствовать восстановлению здоровья и социальной адаптации тех, кто столкнулся с зависимостью. Мы комплексно подходим к решению проблемы, учитывая физические, психологические и социальные аспекты зависимости. Наша цель — не только помочь избавиться от пагубных привычек, но и обеспечить успешное возвращение к полноценной жизни.
Исследовать вопрос подробнее – http://медицинский-вывод-из-запоя.рф
Если требуется экстренная помощь при алкогольном кризисе — Narcology Clinic Москва предоставляет срочную помощь на дому: выезд нарколога, купирование симптомов, мониторинг состояния, без очередей и задержек.
Исследовать вопрос подробнее – анонимная скорая наркологическая помощь москва
Домики на берегу Озеро в Карелии: Чистейшие озера с богатой флорой и фауной, идеальное место для купания и рыбалки.
Клиника «Красмед» специализируется на экстренной и плановой наркологической помощи более десяти лет. В арсенале клиники:
Детальнее – http://medicinskij-vyvod-iz-zapoya.ru/vyvod-iz-zapoya-krulosutochno-krasnoyarsk/
Клиника также предлагает долгосрочные программы, которые включают как стационарное, так и амбулаторное лечение. Мы понимаем, что восстановление требует не только медицинской помощи, но и значительной психологической поддержки на каждом этапе.
Подробнее – http://медицина-вывод-из-запоя.рф/vyvod-iz-zapoya-v-kruglosutochno-v-nizhnem-novgoroge.xn--p1ai/
Врачебный состав клиники “Путь к выздоровлению” состоит из высококвалифицированных специалистов в области наркологии. Наши врачи-наркологи имеют обширный опыт работы с зависимыми пациентами и постоянно совершенствуют свои навыки.
Получить дополнительные сведения – http://нарко-фильтр.рф
Если требуется экстренная помощь при алкогольном кризисе — Narcology Clinic Москва предоставляет срочную помощь на дому: выезд нарколога, купирование симптомов, мониторинг состояния, без очередей и задержек.
Ознакомиться с деталями – наркологическая помощь телефон
Комплексный подход: лечение зависимости — это процесс, включающий медикаментозную терапию, психотерапевтическую помощь, физиотерапию и социальную реабилитацию.
Разобраться лучше – вывод из запоя круглосуточно в уфе
Медикаментозное лечение — это еще один важный этап. Оно включает использование препаратов, которые помогают пациенту восстановиться как физически, так и психологически. Нарколог контролирует процесс лечения, чтобы исключить побочные эффекты и скорректировать терапию при необходимости.
Получить больше информации – http://
В Москве к вашим услугам скорая наркологическая помощь от Narcology Clinic — выезд врача 24/7, качественная помощь при алкогольной интоксикации, стабилизация состояния и организация дальнейших этапов детоксикации.
Подробнее – https://skoraya-narkologicheskaya-pomoshch-moskva11.ru
Мы понимаем уникальность каждого пациента и проводим тщательную диагностику, анализируя его медицинскую историю, психологическое состояние и социальные факторы. На основе полученных данных создаем персональные планы лечения, включающие медикаментозные средства, психотерапию и социальные программы.
Разобраться лучше – http://медицинский-вывод-из-запоя.рф/vyvod-iz-zapoya-anonimno-v-rostove-na-donu.xn--p1ai/
Образовательные программы: Мы уверены, что знания о зависимости и её последствиях играют важную роль в реабилитации. Мы информируем пациентов о механизмах действия наркотиков и алкоголя на организм, что способствует изменению их отношения к терапии и жизни без зависимостей.
Изучить вопрос глубже – вывод из запоя в стационаре казань
Идеален для пациентов со средней степенью интоксикации, не требующих круглосуточного мониторинга. Данная схема позволяет:
Детальнее – вывод из запоя вызов в санкт-петербруге
Команда врачей клиники “Чистый Путь” состоит из квалифицированных специалистов в области наркологии с обширным опытом работы. Каждый врач обладает глубокими знаниями в фармакологии, психофармакологии и психотерапии, регулярно повышает свою квалификацию на профильных конференциях и семинарах, чтобы использовать в своей практике самые современные и эффективные методы лечения.
Узнать больше – http://срочно-вывод-из-запоя.рф/vyvod-iz-zapoya-v-kruglosutochno-v-chelyabinske.xn--p1ai/
Мы верим, что каждый человек, столкнувшийся с проблемой зависимости, заслуживает шанса на новую жизнь. Наша миссия — предоставить необходимые инструменты и поддержку, чтобы помочь пациентам в их стремлении к выздоровлению и личностному росту.
Исследовать вопрос подробнее – https://алко-лечение24.рф/vivod-iz-zapoya-v-stacionare-v-Sankt-Peterburge
Если вовремя не принять меры, состояние может усугубиться, повышая риск серьёзных осложнений. Наиболее эффективным способом очищения организма является постановка капельницы, которая помогает быстро стабилизировать состояние. Клиника «Курс на ясность» оказывает экстренную наркологическую помощь с выездом врачей на дом 24/7.
Получить дополнительную информацию – https://kapelnica-ot-zapoya-krasnoyarsk6.ru
Проблема зависимостей остаётся актуальной в обществе. С каждым годом количество людей, страдающих от алкоголизма, наркомании и других зависимостей, растёт. Эти расстройства негативно влияют на качество жизни как самих пациентов, так и их близких. Зависимость — это не только физическое состояние, но и глубокая психологическая проблема. Для эффективного лечения необходимо обратиться к профессионалам, которые помогут справиться с этой болезнью. Наркологическая клиника “Клиника Наркологии и Психотерапии” предоставляет всеобъемлющую помощь, направленную на восстановление здоровья и нормализацию жизни пациентов.
Углубиться в тему – вывод из запоя вызов на дом в смоленске
Экстренная наркологическая служба в Москве от Narcology Clinic предлагает оперативный выезд врача на дом. Срочный детокс, стабилизация и круглосуточная поддержка пациента с полным соблюдением конфиденциальности.
Углубиться в тему – платная наркологическая помощь москве
Для максимальной эффективности и безопасности «Красмед» использует комбинированные подходы:
Подробнее тут – http://medicinskij-vyvod-iz-zapoya.ru/vyvod-iz-zapoya-krulosutochno-krasnoyarsk/
В Москве к вашим услугам скорая наркологическая помощь от Narcology Clinic — выезд врача 24/7, качественная помощь при алкогольной интоксикации, стабилизация состояния и организация дальнейших этапов детоксикации.
Подробнее – центр наркологической помощи
Наши наркологи придерживаются принципов уважительного и внимательного отношения к пациентам, создавая атмосферу доверия. Они проводят детальное обследование, выявляют коренные причины зависимости и разрабатывают индивидуальные стратегии лечения. Профессионализм и компетентность врачей являются ключевыми факторами успешного восстановления пациентов.
Углубиться в тему – http://нарко-фильтр.рф/vivod-iz-zapoya-anonimno-v-rostove-na-donu/
В-третьих, реабилитация и ресоциализация. Успешное лечение требует не только устранения физической зависимости. Мы акцентируем внимание на восстановлении социальных связей, улучшении психоэмоционального состояния и формировании новых интересов. Программа включает как групповые, так и индивидуальные занятия, что позволяет пациентам обрести уверенность в себе.
Получить дополнительную информацию – https://алко-лечебница.рф/vivod-iz-zapoya-v-stacionare-v-samare
Миссия клиники — оказание комплексной помощи людям с зависимостями. Основные задачи, которые мы ставим перед собой:
Получить дополнительную информацию – https://медицина-вывод-из-запоя.рф/vyvod-iz-zapoya-v-kruglosutochno-v-nizhnem-novgoroge.xn--p1ai/
Экстренная наркологическая служба в Москве от Narcology Clinic предлагает оперативный выезд врача на дом. Срочный детокс, стабилизация и круглосуточная поддержка пациента с полным соблюдением конфиденциальности.
Углубиться в тему – неотложная наркологическая помощь
Во-первых, важным направлением является комплексная диагностика. Понимание глубинных причин зависимости позволяет создавать индивидуальные планы лечения. Это может включать как медикаментозные препараты для детоксикации организма, так и психотерапевтические методы, направленные на изменение поведения и мышления.
Разобраться лучше – наркология вывод из запоя в краснодаре
Скорая наркологическая служба Narcology Clinic в Москве работает круглосуточно. Выезд к пациенту, медикаментозная стабилизация, детоксикация и психологическая поддержка до выхода из кризисного состояния.
Выяснить больше – срочная наркологическая помощь москва
Врачи клиники создают атмосферу доверия и понимания, обеспечивая уважительное отношение к пациентам. Проводится детальное обследование, выявляются причины зависимости и разрабатываются индивидуальные стратегии лечения. Высокий профессионализм наших специалистов — ключ к успешному выздоровлению.
Детальнее – https://медицинский-вывод-из-запоя.рф/vyvod-iz-zapoya-v-stacionare-v-rostove-na-donu.xn--p1ai
Зависимость — это хроническое заболевание, которое разрушает не только физическое, но и психическое здоровье человека. Она подчиняет волю, искажает восприятие, разрушает семьи и судьбы. Алкоголизм, наркомания, игровая зависимость — лишь разные проявления одной проблемы, требующей профессионального и комплексного подхода.
Углубиться в тему – вывод из запоя капельница уфа
Идеален для пациентов со средней степенью интоксикации, не требующих круглосуточного мониторинга. Данная схема позволяет:
Выяснить больше – скорая вывод из запоя санкт-петербруг
Наши наркологи придерживаются принципов уважительного и внимательного отношения к пациентам, создавая атмосферу доверия. Они проводят детальное обследование, выявляют коренные причины зависимости и разрабатывают индивидуальные стратегии лечения. Профессионализм и компетентность врачей являются ключевыми факторами успешного восстановления пациентов.
Получить дополнительную информацию – http://нарко-фильтр.рф/
Образовательные программы: Мы уверены, что знания о зависимости и её последствиях играют важную роль в реабилитации. Мы информируем пациентов о механизмах действия наркотиков и алкоголя на организм, что способствует изменению их отношения к терапии и жизни без зависимостей.
Получить дополнительные сведения – помощь вывод из запоя в казани
Для максимальной эффективности и безопасности «Красмед» использует комбинированные подходы:
Разобраться лучше – вывод из запоя на дому круглосуточно в красноярске
freight shipping nyc freight nyc
Наркологическая клиника “Маяк надежды” расположена по адресу: г. Санкт-Петербург, ул. Колпинская, д. 27. Клиника работает ежедневно с 9:00 до 21:00, без выходных. Наши специалисты готовы предоставить консультацию и ответить на все вопросы, связанные с лечением зависимостей. Мы гарантируем конфиденциальность и индивидуальный подход к каждому пациенту.
Ознакомиться с деталями – https://алко-лечение24.рф/vivod-iz-zapoya-v-stacionare-v-Sankt-Peterburge
20
Подробнее можно узнать тут – экстренная наркологическая помощь москве
Скорая наркологическая помощь в Москве — Narcology Clinic выезжает круглосуточно напрямую к пациенту. Срочные капельницы, детокс, контроль состояния и экстренная поддержка. Анонимно, профессионально, оперативно.
Изучить вопрос глубже – скорая наркологическая помощь москва
Особое внимание в клинике уделяется предотвращению рецидивов. Мы обучаем пациентов навыкам управления стрессом и эмоциональной стабильности, помогая формировать здоровые привычки. Это способствует долгосрочному восстановлению и снижает вероятность возвращения к зависимости.
Углубиться в тему – http://медицинский-вывод-из-запоя.рф/vyvod-iz-zapoya-v-kruglosutochno-v-rostove-na-donu.xn--p1ai/
Наркологическая клиника “Возрождение” находится по адресу: ул. Агрономическая, д. 122А, г. Нижний Новгород, Россия. Мы открыты для вас круглосуточно и также предлагаем онлайн-консультации, чтобы сделать наши услуги более доступными.
Получить дополнительные сведения – http://медицина-вывод-из-запоя.рф
Мы верим, что каждый человек, столкнувшийся с проблемой зависимости, заслуживает шанса на новую жизнь. Наша миссия — предоставить необходимые инструменты и поддержку, чтобы помочь пациентам в их стремлении к здоровой и свободной от зависимостей жизни.
Ознакомиться с деталями – http://нарко-фильтр.рф
Мы уделяем особое внимание индивидуальному подходу к каждому пациенту, понимая, что причины и проявления зависимости у всех разные. Тщательная диагностика позволяет учитывать медицинские, психологические и социальные аспекты каждого случая, на основе чего разрабатываются персонализированные программы лечения. Они включают медикаментозную терапию, психотерапевтические методы и мероприятия по социальной адаптации.
Узнать больше – http://срочно-вывод-из-запоя.рф
Наркологический центр “Луч Надежды” — это место, где можно найти поддержку и помощь, даже когда кажется, что выход потерян. Наша команда врачей-наркологов, психологов и психотерапевтов использует современные методы лечения и реабилитации, помогая пациентам вернуть трезвость и полноценную жизнь. Мы стремимся не только к устранению симптомов, но и к выявлению причин заболевания, давая пациентам необходимые инструменты для борьбы с тягой к психоактивным веществам и формированию новых жизненных установок.
Подробнее – вывод из запоя вызов в уфе
20
Разобраться лучше – срочная наркологическая помощь
Этанол связывается с ГАМК-рецепторами, усиливая тормозные процессы в ЦНС, что ведёт к снижению рефлексов и когнитивных функций. Одновременно происходит повышение активности дофаминовых путей, вызывая ощущение кратковременного «успокоения» и «радости». При прекращении поступления алкоголя к рецепторам наступает синдром отмены — резкое возбуждение, тревожность и дисбаланс нейротрансмиттеров.
Разобраться лучше – http://nadezhnyj-vyvod-iz-zapoya.ru/
Обратиться за помощью необходимо при:
Выяснить больше – вывод из запоя цена в красноярске
сайт трипскан Сайт трипскан: Ваш персональный компас в мире путешествий. Мы предлагаем вам широкий выбор отелей, авиабилетов и экскурсий по самым выгодным ценам. Ваше путешествие начинается здесь.
Детоксикация организма, проводимая на дому, помогает очистить кровь от токсинов, накопившихся из-за длительного употребления алкоголя или наркотических веществ. Она проводится с использованием специально подобранных медикаментов, которые улучшают работу печени, почек и других органов.
Подробнее – нарколог на дом срочно
Образовательные программы: Мы уверены, что знания о зависимости и её последствиях играют важную роль в реабилитации. Мы информируем пациентов о механизмах действия наркотиков и алкоголя на организм, что способствует изменению их отношения к терапии и жизни без зависимостей.
Подробнее можно узнать тут – вывод из запоя цена
Экстренная помощь при алкоголизме от Narcology Clinic в Москве — выезд врачей в любую точку города, купирование острых состояний, поддержка пациента до стабильного состояния, профессионально и в конфиденциальности.
Подробнее – наркологическая помощь телефон
В экстренной ситуации на фоне алкоголя — обращайтесь к скорой помощи Narcology Clinic в Москве. Качественный выезд нарколога, медицинская поддержка, нейтрализация последствий и помощь в восстановлении.
Детальнее – круглосуточная наркологическая помощь
Скорая наркологическая служба Narcology Clinic в Москве работает круглосуточно. Выезд к пациенту, медикаментозная стабилизация, детоксикация и психологическая поддержка до выхода из кризисного состояния.
Узнать больше – https://skoraya-narkologicheskaya-pomoshch12.ru
Состав инфузии подбирается врачом индивидуально, с учётом состояния пациента, длительности запоя, возраста и хронических заболеваний.
Детальнее – https://kapelnica-ot-zapoya-krasnoyarsk6.ru/vyzvat-kapelniczu-ot-zapoya-krasnoyarsk
Миссия клиники “Путь к выздоровлению” заключается в содействии восстановлению здоровья и социальной реинтеграции людей, столкнувшихся с проблемами зависимости. Мы стремимся к комплексному решению этой сложной задачи, учитывая физические, психологические и социальные аспекты зависимости. Наша цель — не только помочь пациентам избавиться от физической зависимости, но и обеспечить их психологическое восстановление и возвращение к нормальной жизни в обществе.
Изучить вопрос глубже – https://нарко-фильтр.рф/vivod-iz-zapoya-v-stacionare-v-rostove-na-donu
Мы понимаем уникальность каждого пациента и проводим тщательную диагностику, анализируя его медицинскую историю, психологическое состояние и социальные факторы. На основе полученных данных создаем персональные планы лечения, включающие медикаментозные средства, психотерапию и социальные программы.
Получить дополнительные сведения – https://медицинский-вывод-из-запоя.рф/vyvod-iz-zapoya-v-kruglosutochno-v-rostove-na-donu.xn--p1ai/
Специалисты нашего центра обладают опытом работы с различными зависимостями, начиная от алкоголизма и заканчивая игроманией. Мы понимаем, что поддержка семьи также играет важную роль в процессе лечения, поэтому включаем близких в терапевтические мероприятия. Поддержка родных помогает пациентам не только преодолеть трудные моменты, но и справиться с эмоциональными переживаниями.
Выяснить больше – вывод из запоя в стационаре
Мы верим, что каждый человек, столкнувшийся с проблемой зависимости, заслуживает шанса на новую жизнь. Наша миссия — предоставить необходимые инструменты и поддержку, чтобы помочь пациентам в их стремлении к выздоровлению и личностному росту.
Узнать больше – http://алко-лечение24.рф/vivod-iz-zapoya-v-stacionare-v-Sankt-Peterburge/https://алко-лечение24.рф
Комплексный подход: лечение зависимости — это процесс, включающий медикаментозную терапию, психотерапевтическую помощь, физиотерапию и социальную реабилитацию.
Подробнее – вывод из запоя круглосуточно
В экстренной ситуации на фоне алкоголя — обращайтесь к скорой помощи Narcology Clinic в Москве. Качественный выезд нарколога, медицинская поддержка, нейтрализация последствий и помощь в восстановлении.
Подробнее можно узнать тут – вызов наркологической помощи
Эта информационная заметка содержит увлекательные сведения, которые могут вас удивить! Мы собрали интересные факты, которые сделают вашу жизнь ярче и полнее. Узнайте нечто новое о привычных аспектах повседневности и откройте для себя удивительный мир информации.
Провести детальное исследование – https://f5fashion.vn/thom-ngon-mon-banh-trang-cuon-thit-heo-da-nang
Этот текст сочетает в себе элементы познавательного рассказа и аналитической подачи информации. Читатель получает доступ к уникальным данным, которые соединяют прошлое с настоящим и открывают двери в будущее.
Ознакомьтесь с аналитикой – https://daizsolutions.com/index.php/2023/04/09/revolutionize-your-business-with-our-cutting-edge
Этот текст сочетает в себе элементы познавательного рассказа и аналитической подачи информации. Читатель получает доступ к уникальным данным, которые соединяют прошлое с настоящим и открывают двери в будущее.
Подробная информация доступна по запросу – https://crbank.com.br/the-importance-of-building-a-strong-brand-identity
«УралРеаб» предлагает несколько форматов терапии, позволяющих выбрать оптимальный вариант в зависимости от тяжести зависимости, социальных обстоятельств и клинических показателей.
Разобраться лучше – http://lechenie-alkogolizma-ekaterinburg00.ru
Today, I went to the beach front with my kids. I found a sea shell and gave it to my 4 year old daughter and said “You can hear the ocean if you put this to your ear.” She put the shell to her ear and screamed. There was a hermit crab inside and it pinched her ear. She never wants to go back! LoL I know this is totally off topic but I had to tell someone!
https://newstoday.com.ua/linzy-dlya-far-oglyad-naykraschyh-modeley
Эта информационная заметка содержит увлекательные сведения, которые могут вас удивить! Мы собрали интересные факты, которые сделают вашу жизнь ярче и полнее. Узнайте нечто новое о привычных аспектах повседневности и откройте для себя удивительный мир информации.
Все материалы собраны здесь – https://shga.kr/archives/691
Эта информационная заметка содержит увлекательные сведения, которые могут вас удивить! Мы собрали интересные факты, которые сделают вашу жизнь ярче и полнее. Узнайте нечто новое о привычных аспектах повседневности и откройте для себя удивительный мир информации.
Разобраться лучше – https://engagecleveland.org/best-clubs-in-cleveland
Этот информативный текст отличается привлекательным содержанием и актуальными данными. Мы предлагаем читателям взглянуть на привычные вещи под новым углом, предоставляя интересный и доступный материал. Получите удовольствие от чтения и расширьте кругозор!
Ознакомиться с деталями – http://honeybeedoughnuts.com/cropped-hb_icon_deep-sea-png
Эта статья сочетает познавательный и занимательный контент, что делает ее идеальной для любителей глубоких исследований. Мы рассмотрим увлекательные аспекты различных тем и предоставим вам новые знания, которые могут оказаться полезными в будущем.
Изучить вопрос глубже – https://bolarolando.com.br/index.php/2024/05/05/veja-os-relacionados-do-vasco-para-o-jogo-contra-o-athletico-pr-payet-segue-fora
Мы собрали для вас самые захватывающие факты из мира науки и истории. От малознакомых деталей до грандиозных событий — эта статья расширит ваш кругозор и подарит новое понимание того, как устроен наш мир.
Более того — здесь – http://maniowy.net/historia-wsi/category/43-przesiedlenie?start=8190
Этот информационный обзор станет отличным путеводителем по актуальным темам, объединяющим важные факты и мнения экспертов. Мы исследуем ключевые идеи и представляем их в доступной форме для более глубокого понимания. Читайте, чтобы оставаться в курсе событий!
Практические советы ждут тебя – https://ssironmetal.com/what-to-avoid-when-scrapping-metal/.html
Эта статья для ознакомления предлагает читателям общее представление об актуальной теме. Мы стремимся представить ключевые факты и идеи, которые помогут читателям получить представление о предмете и решить, стоит ли углубляться в изучение.
Изучить вопрос глубже – https://f5fashion.vn/phim-cua-kim-tae-hee-vua-ra-mat-da-duoc-khen-vi-qua-kich-tinh-rating-lap-ky-luc-moi-cho-nha-dai
Публикация приглашает вас исследовать неизведанное — от древних тайн до современных достижений науки. Вы узнаете, как случайные находки превращались в революции, а смелые мысли — в новые эры человеческого прогресса.
Расширить кругозор по теме – https://nhcosmetics.net/music-style/erat-suspendisse-vestibulum-mi
Эта обзорная заметка содержит ключевые моменты и факты по актуальным вопросам. Она поможет читателям быстро ориентироваться в теме и узнать о самых важных аспектах сегодня. Получите краткий курс по современной информации и оставайтесь в курсе событий!
Следуйте по ссылке – http://www.montargil.com/fotografia/details.php?image_id=85&mode=search
Этот текст сочетает в себе элементы познавательного рассказа и аналитической подачи информации. Читатель получает доступ к уникальным данным, которые соединяют прошлое с настоящим и открывают двери в будущее.
Изучить аспект более тщательно – https://f5fashion.vn/katie-ledecky-net-worth-in-2023-how-rich-is-she-now-update
В этой статье представлен занимательный и актуальный контент, который заставит вас задуматься. Мы обсуждаем насущные вопросы и проблемы, а также освещаем истории, которые вдохновляют на действия и изменения. Узнайте, что стоит за событиями нашего времени!
Более подробно об этом – https://tnfs.edu.rs/platforma-teslin-narod
Этот текст призван помочь читателю расширить кругозор и получить практические знания. Мы используем простой язык, наглядные примеры и структурированное изложение, чтобы сделать обучение максимально эффективным и увлекательным.
Изучить аспект более тщательно – https://tnfs.edu.rs/platforma-teslin-narod
В клинике используются запатентованные наборы для капельниц, включающие витамины группы B, мембранопротекторы и низкомолекулярные антиоксиданты. Автоматизированные насосы обеспечивают равномерный ввод растворов, минимизируя риск осложнений.
Получить дополнительную информацию – лечение наркомании и алкоголизма свердловская область
Наркомания — хроническое заболевание, требующее комплексного лечения и постоянной поддержки. В условиях Архангельска, где доступ к специализированной помощи может быть ограничен, клиника «АрктикМед» предлагает уникальную программу, основанную на мультидисциплинарном подходе и строгом соблюдении принципов анонимности. Ключевая цель — помочь каждому пациенту преодолеть зависимость, восстановить здоровье и вернуться к полноценной жизни.
Изучить вопрос глубже – https://lechenie-narkomanii-arkhangelsk0.ru
Запой характеризуется накоплением токсинов и ухудшением работы внутренних органов. Чем дольше продолжается состояние интоксикации, тем выше риск серьезных осложнений. Помощь нарколога на дому позволяет начать детоксикацию в первые часы кризиса, что существенно повышает шансы на успешное восстановление и предотвращает развитие хронических заболеваний.
Детальнее – https://vyvod-iz-zapoya-vladimir0.ru/srochnyj-vyvod-iz-zapoya-vladimir/
Запой – это неконтролируемое употребление алкоголя, которое приводит к серьезным последствиям. Алкогольное отравление организма приводит к серьезным проблемам со здоровьем. Выходить из запоя самостоятельно – рискованно и неэффективно. Мы предлагаем помощь при запое на дому, в привычных для вас условиях. Круглосуточная помощь при запое с выездом на дом за 30-60 минут. Длительный запой разрушает организм и может быть смертельным. Чем раньше вы обратитесь за помощью, тем больше шансов на выздоровление.
Получить дополнительные сведения – https://vyvod-iz-zapoya-krasnoyarsk0.ru/vyvod-iz-zapoya-kruglosutochno-krasnoyarsk
Доступность услуги и оперативность реагирования гарантируют, что помощь будет оказана в течение 30–60 минут после вызова. Это позволяет не только быстро начать детоксикацию, но и минимизировать риск развития осложнений, таких как повреждение печени, почек и сердечно-сосудистой системы.
Получить дополнительную информацию – вывод из запоя на дому цена в туле
Преимущество
Получить дополнительные сведения – https://vyvod-iz-zapoya-sochi7.ru/vyvod-iz-zapoya-cena-v-sochi
Если требуется срочное кодирование или детоксикация, вызов нарколога на дом – лучшее решение в Иркутске. Профессиональный нарколог приедет, оценит состояние, проведет детоксикацию на дому. «ТрезвоМед»: анонимный выезд нарколога 24/7, помощь при отказе от алкоголя. Тяжело бросить пить в одиночку? Обратитесь к наркологу! Главное – быстро оказать помощь при интоксикации, – нарколог Васильев.
Получить дополнительные сведения – нарколог на дом стоимость иркутск
Внутривенная инфузия – это один из самых быстрых и безопасных способов очистки организма от алкоголя и его токсичных продуктов распада. Она позволяет:
Ознакомиться с деталями – капельница от запоя на дому красноярск
Медикаментозное лечение — это еще один важный этап. Оно включает использование препаратов, которые помогают пациенту восстановиться как физически, так и психологически. Нарколог контролирует процесс лечения, чтобы исключить побочные эффекты и скорректировать терапию при необходимости.
Узнать больше – vrach-narkolog-na-dom krasnojarsk
Вывод из запоя на дому в Туле осуществляется по строго отлаженной схеме, которая включает несколько последовательных этапов. Такой комплексный подход позволяет не только быстро вывести токсины из организма, но и обеспечить всестороннюю поддержку пациента, включая психологическую реабилитацию.
Подробнее – narkolog-vyvod-iz-zapoya tula
После первичного осмотра начинается активная фаза детоксикации. Современные препараты вводятся капельничным методом для быстрого снижения уровня токсинов в крови и восстановления обменных процессов. Этот этап критически важен для нормализации работы печени, почек и сердечно-сосудистой системы.
Детальнее – вывод из запоя цены владимир
Анализ рынка услуг экстренной помощи в Тюмени позволяет выделить следующие ориентировочные цены:
Получить больше информации – вывод из запоя цены владимир
На первом этапе пациент проходит лабораторные обследования (общий и биохимический анализ крови, ЭКГ, УЗИ печени и почек). На их основе разрабатывается схема инфузионной терапии, включающая корректировку водно-электролитного баланса, поддержку жизненно важных функций и назначение симптоматических препаратов для снятия абстинентного синдрома.
Узнать больше – http://lechenie-narkomanii-arkhangelsk0.ru
В клинике используются запатентованные наборы для капельниц, включающие витамины группы B, мембранопротекторы и низкомолекулярные антиоксиданты. Автоматизированные насосы обеспечивают равномерный ввод растворов, минимизируя риск осложнений.
Детальнее – наркологическое лечение наркомания екатеринбург
Не можете добраться до клиники? Нарколог на дом в Иркутске – оптимальный выход при запое. Нарколог на дом – это удобно: обследование, лечение и детоксикация в комфортных условиях. Выезд нарколога в любое время, анонимность и безопасность – это «ТрезвоМед». Без медицинской помощи не обойтись? Звоните наркологу! Чем быстрее помощь, тем лучше прогноз, – нарколог Игорь Васильев.
Получить дополнительную информацию – частный нарколог на дом в иркутске
http://www.medlinks.ru/article.php?sid=110930
культура Турции Работа в Турции: Востребованные профессии, поиск вакансий, оформление рабочей визы, условия труда, оплата и карьерные возможности
Сразу после вызова нарколог приезжает для проведения детального осмотра. На этом этапе производится сбор анамнеза, измеряются жизненно важные показатели – пульс, артериальное давление, температура – и оценивается степень интоксикации.
Подробнее тут – https://vyvod-iz-zapoya-vladimir0.ru/vyvod-iz-zapoya-na-domu-vladimir/
3D печати Металлообработка: Гибка и штамповка
Запой – это неконтролируемое употребление алкоголя, которое приводит к серьезным последствиям. Алкогольное отравление организма приводит к серьезным проблемам со здоровьем. Выходить из запоя самостоятельно – рискованно и неэффективно. Мы предлагаем помощь при запое на дому, в привычных для вас условиях. Круглосуточная помощь при запое с выездом на дом за 30-60 минут. Длительный запой разрушает организм и может быть смертельным. Чем раньше вы обратитесь за помощью, тем больше шансов на выздоровление.
Узнать больше – вывод из запоя в красноярске
Комплексный вывод из запоя в Туле организован по отлаженной схеме, состоящей из нескольких этапов, каждый из которых направлен на безопасное и эффективное восстановление организма.
Получить дополнительные сведения – вывод из запоя недорого тула
нейросети ChatGPT: Интеллектуальный собеседник и помощник
Помощь специалиста по выводу из запоя требуется, когда симптомы интоксикации становятся критическими. Обратите внимание на следующие признаки:
Углубиться в тему – https://vyvod-iz-zapoya-sochi7.ru/vyvod-iz-zapoya-cena-v-sochi/
Состав инфузии подбирается врачом индивидуально, с учётом состояния пациента, длительности запоя, возраста и хронических заболеваний.
Разобраться лучше – https://kapelnica-ot-zapoya-krasnoyarsk6.ru
Длительный запой может привести к серьезным осложнениям, таким как повреждение печени, почек, сердечно-сосудистые нарушения и нервные расстройства. Чем быстрее начинается вывод из запоя, тем ниже риск развития хронических заболеваний. Срочный вызов нарколога на дом позволяет в первые часы кризиса начать детоксикацию, что существенно повышает шансы на полное восстановление организма. В условиях экстренной ситуации каждая минута имеет решающее значение, и своевременная помощь становится ключом к сохранению здоровья и жизни.
Подробнее – https://vyvod-iz-zapoya-tula00.ru/vyvod-iz-zapoya-anonimno-tula
Кроме того, врач оказывает психологическую поддержку, которая помогает пациенту справиться с чувством тревоги, депрессией и страхом, возникающими на фоне зависимости.
Подробнее – нарколог на дом недорого
Незамедлительно после вызова нарколог прибывает на дом для проведения тщательного осмотра. На данном этапе специалист собирает анамнез, измеряет жизненно важные показатели — пульс, артериальное давление, температуру — и оценивает степень интоксикации. Эти данные являются основой для составления индивидуального плана лечения.
Получить больше информации – https://vyvod-iz-zapoya-vladimir000.ru/srochnyj-vyvod-iz-zapoya-vladimir
VRF Купить VRF: Инвестиция в Будущее Приобретение VRF системы – это инвестиция в будущее вашего дома или бизнеса. Эти системы позволяют существенно снизить энергопотребление и затраты на электроэнергию, обеспечивая при этом максимальный комфорт.
https://www.med2.ru/story.php?id=147094
Экстренный вызов нарколога на дом в Иркутске от «ТрезвоМед» при запое, интоксикации или кодировании – анонимно и удобно. Осмотр, детоксикация капельницей, индивидуальный план лечения – все это на дому! «ТрезвоМед» – круглосуточная помощь, анонимность и безопасность при отказе от алкоголя. Не можете бросить пить самостоятельно? Нужна помощь нарколога! Васильев: «Своевременная помощь при интоксикации – залог успешного выздоровления».
Ознакомиться с деталями – narcolog-na-dom-v-irkutske0.ru/vrach-narkolog-na-dom-irkutsk/
Наркомания — хроническое заболевание, требующее комплексного лечения и постоянной поддержки. В условиях Архангельска, где доступ к специализированной помощи может быть ограничен, клиника «АрктикМед» предлагает уникальную программу, основанную на мультидисциплинарном подходе и строгом соблюдении принципов анонимности. Ключевая цель — помочь каждому пациенту преодолеть зависимость, восстановить здоровье и вернуться к полноценной жизни.
Разобраться лучше – http://www.domen.ru
Конфиденциальность обеспечивается отдельными блоками для каждого этапа лечения и строгим пропускным режимом. Пациент получает круглосуточную поддержку по телефону даже после выписки для предотвращения рецидива.
Получить дополнительную информацию – http://lechenie-narkomanii-ekaterinburg0.ru/
Антижучок Браслет с электрошоком купить: Средство защиты Браслет с электрошоком – это средство самообороны, предназначенное для защиты от нападения.
Запой характеризуется накоплением токсинов и ухудшением работы внутренних органов. Чем дольше продолжается состояние интоксикации, тем выше риск серьезных осложнений. Помощь нарколога на дому позволяет начать детоксикацию в первые часы кризиса, что существенно повышает шансы на успешное восстановление и предотвращает развитие хронических заболеваний.
Углубиться в тему – http://vyvod-iz-zapoya-vladimir0.ru/srochnyj-vyvod-iz-zapoya-vladimir/
Запой – это серьезная проблема, когда организм перестает работать без постоянного поступления алкоголя. Из-за запоя токсины отравляют организм, нарушая работу органов и снижая иммунитет. Попытки самостоятельно бросить пить во время запоя могут привести к ухудшению самочувствия. «Семья и Здоровье» лечит запой на дому – это удобно и снижает стресс. Мы приедем в любое время суток и проведем все процедуры для восстановления здоровья. Длительное пьянство может привести к опасным для жизни осложнениям. Нельзя затягивать с лечением запоя, это может привести к серьезным последствиям.
Углубиться в тему – http://vyvod-iz-zapoya-krasnoyarsk0.ru/vyvod-iz-zapoya-na-domu-krasnoyarsk
На данном этапе специалист уточняет, как долго продолжается запой, какой вид алкоголя употребляется и имеются ли сопутствующие заболевания. Тщательный анализ информации позволяет оперативно определить степень интоксикации и выбрать оптимальные методы терапии для быстрого и безопасного вывода из запоя.
Исследовать вопрос подробнее – вывод из запоя цена тула.
Алкогольная интоксикация и запой могут стремительно ухудшить состояние здоровья, став угрозой жизни, поэтому оперативное вмешательство имеет первостепенное значение. В Туле квалифицированные наркологи предоставляют круглосуточную помощь на дому, что позволяет начать лечение незамедлительно и в комфортных условиях. Такой формат терапии гарантирует индивидуальный подход, всестороннюю поддержку и полную конфиденциальность, что особенно важно для пациентов, стремящихся восстановить своё здоровье без лишних стрессовых ситуаций.
Ознакомиться с деталями – вывод из запоя круглосуточно тула
При вызовах в ночное время или в случаях с тяжелой интоксикацией стоимость может увеличиваться до 3000–4500 рублей. Окончательная сумма определяется после первичного осмотра и обсуждения индивидуальной схемы лечения с пациентом.
Подробнее – вывод из запоя цены владимир
Продолжительный запой приводит к накоплению токсинов в организме, нарушению работы внутренних органов и развитию серьезных осложнений. Чем дольше человек находится в состоянии алкогольной интоксикации, тем выше риск повреждения сердца, печени и почек. Экстренное вмешательство позволяет оперативно вывести токсины, восстановить нормальные обменные процессы и предотвратить развитие хронических заболеваний.
Получить дополнительную информацию – https://vyvod-iz-zapoya-vladimir000.ru/vyvod-iz-zapoya-na-domu-vladimir
Клиника «Детоксика» в Сочи специализируется на комплексном лечении запоя и восстановления здоровья пациентов с индивидуальным подходом. Наши преимущества:
Разобраться лучше – http://vyvod-iz-zapoya-sochi7.ru
Эффект
Узнать больше – капельница от запоя клиника в красноярске
Если требуется срочное кодирование или детоксикация, вызов нарколога на дом – лучшее решение в Иркутске. Профессиональный нарколог приедет, оценит состояние, проведет детоксикацию на дому. «ТрезвоМед»: анонимный выезд нарколога 24/7, помощь при отказе от алкоголя. Тяжело бросить пить в одиночку? Обратитесь к наркологу! Главное – быстро оказать помощь при интоксикации, – нарколог Васильев.
Подробнее – http://narcolog-na-dom-v-irkutske0.ru/vrach-narkolog-na-dom-irkutsk
Конфиденциальность обеспечивается отдельными блоками для каждого этапа лечения и строгим пропускным режимом. Пациент получает круглосуточную поддержку по телефону даже после выписки для предотвращения рецидива.
Узнать больше – лечение наркомании и алкоголизма екатеринбург.
Запой – это не просто пьянство, а состояние, когда организм становится зависимым от алкоголя. Накопление токсинов приводит к сбоям в работе органов и ослаблению защиты организма. Самостоятельный выход из запоя может быть опасен и только усугубить состояние. Мы предлагаем лечение запоя на дому, чтобы избежать больницы и создать комфорт. Наши специалисты быстро приедут к вам и окажут всю необходимую помощь круглосуточно. Запой приводит к серьезным проблемам со здоровьем, ухудшает качество жизни и угрожает жизни. Очень важно вовремя обратиться за помощью, чтобы избежать необратимых последствий.
Получить дополнительные сведения – https://vyvod-iz-zapoya-krasnoyarsk0.ru/vyvod-iz-zapoya-kruglosutochno-krasnoyarsk/
При поступлении вызова нарколог незамедлительно приезжает на дом для проведения детального первичного осмотра. Врач собирает краткий анамнез, измеряет жизненно важные показатели — пульс, артериальное давление, температуру — и оценивает степень алкогольной интоксикации. Эти данные являются основой для разработки индивидуального плана лечения, позволяющего подобрать наиболее эффективные методы детоксикации.
Подробнее можно узнать тут – вывод из запоя капельница в туле
Наркомания — хроническое заболевание, требующее комплексного лечения и постоянной поддержки. В условиях Архангельска, где доступ к специализированной помощи может быть ограничен, клиника «АрктикМед» предлагает уникальную программу, основанную на мультидисциплинарном подходе и строгом соблюдении принципов анонимности. Ключевая цель — помочь каждому пациенту преодолеть зависимость, восстановить здоровье и вернуться к полноценной жизни.
Узнать больше – лечение наркомании архангельск.
Например, если речь идет о выводе из запоя, врач проведет тщательное обследование пациента, чтобы определить общее состояние здоровья и наличие возможных осложнений. На основе диагностики будет назначена инфузионная терапия, которая включает введение растворов, витаминов и препаратов для снятия абстиненции.
Исследовать вопрос подробнее – https://narcolog-na-dom-v-krasnoyarske55.ru/
Системы автоматизированного дозирования обеспечивают точное введение медикаментов, что минимизирует риск побочных эффектов. Постоянный мониторинг жизненно важных показателей позволяет врачу корректировать терапию в режиме реального времени, гарантируя безопасность процедуры.
Подробнее можно узнать тут – http://vyvod-iz-zapoya-vladimir0.ru/
Экстренный вызов нарколога на дом в Иркутске от «ТрезвоМед» при запое, интоксикации или кодировании – анонимно и удобно. Осмотр, детоксикация капельницей, индивидуальный план лечения – все это на дому! «ТрезвоМед» – круглосуточная помощь, анонимность и безопасность при отказе от алкоголя. Не можете бросить пить самостоятельно? Нужна помощь нарколога! Васильев: «Своевременная помощь при интоксикации – залог успешного выздоровления».
Получить дополнительные сведения – нарколог в иркутске
После первичного осмотра начинается активная фаза детоксикации. Современные препараты вводятся капельничным методом для быстрого снижения уровня токсинов в крови и восстановления обменных процессов. Этот этап критически важен для нормализации работы печени, почек и сердечно-сосудистой системы.
Подробнее – наркология вывод из запоя владимир
Алкогольная интоксикация и запой могут стремительно ухудшить состояние здоровья, став угрозой жизни, поэтому оперативное вмешательство имеет первостепенное значение. В Туле квалифицированные наркологи предоставляют круглосуточную помощь на дому, что позволяет начать лечение незамедлительно и в комфортных условиях. Такой формат терапии гарантирует индивидуальный подход, всестороннюю поддержку и полную конфиденциальность, что особенно важно для пациентов, стремящихся восстановить своё здоровье без лишних стрессовых ситуаций.
Разобраться лучше – вывод из запоя круглосуточно в туле
В клинике используются запатентованные наборы для капельниц, включающие витамины группы B, мембранопротекторы и низкомолекулярные антиоксиданты. Автоматизированные насосы обеспечивают равномерный ввод растворов, минимизируя риск осложнений.
Изучить вопрос глубже – http://lechenie-narkomanii-ekaterinburg0.ru/lechenie-narkomanii-anonimno-v-ekb/
Hmm is anyone else having problems with the pictures on this blog loading? I’m trying to figure out if its a problem on my end or if it’s the blog. Any responses would be greatly appreciated.
https://svenec.com/yustyrovochna-plyta-dlya-linz-tochnist-i-nadiynist-ustanovky
Вывод из запоя на дому в Туле осуществляется по строго отлаженной схеме, которая включает несколько последовательных этапов. Такой комплексный подход позволяет не только быстро вывести токсины из организма, но и обеспечить всестороннюю поддержку пациента, включая психологическую реабилитацию.
Узнать больше – наркологический вывод из запоя в туле
Запой – это серьезная проблема, когда организм перестает работать без постоянного поступления алкоголя. Из-за запоя токсины отравляют организм, нарушая работу органов и снижая иммунитет. Попытки самостоятельно бросить пить во время запоя могут привести к ухудшению самочувствия. «Семья и Здоровье» лечит запой на дому – это удобно и снижает стресс. Мы приедем в любое время суток и проведем все процедуры для восстановления здоровья. Длительное пьянство может привести к опасным для жизни осложнениям. Нельзя затягивать с лечением запоя, это может привести к серьезным последствиям.
Получить больше информации – анонимный вывод из запоя красноярск
купить VRF Монтаж VRV: Точность и Качество в Каждой Детали Монтаж VRV системы требует высокой квалификации и опыта. Мы обеспечиваем профессиональный монтаж, используя современное оборудование и передовые технологии, чтобы гарантировать бесперебойную работу вашей системы кондиционирования.
Описание
Углубиться в тему – https://vyvod-iz-zapoya-sochi7.ru/vyvod-iz-zapoya-na-domu-v-sochi
Наркомания — хроническое заболевание, требующее комплексного лечения и постоянной поддержки. В условиях Архангельска, где доступ к специализированной помощи может быть ограничен, клиника «АрктикМед» предлагает уникальную программу, основанную на мультидисциплинарном подходе и строгом соблюдении принципов анонимности. Ключевая цель — помочь каждому пациенту преодолеть зависимость, восстановить здоровье и вернуться к полноценной жизни.
Детальнее – центр лечения наркомании архангельск.
Компоненты капельницы
Исследовать вопрос подробнее – [url=https://kapelnica-ot-zapoya-krasnoyarsk6.ru/]капельница от запоя стоимость в красноярске[/url]
Эта статья предлагает живое освещение актуальной темы с множеством интересных фактов. Мы рассмотрим ключевые моменты, которые делают данную тему важной и актуальной. Подготовьтесь к насыщенному путешествию по неизвестным аспектам и узнайте больше о значимых событиях.
Расширить кругозор по теме – https://tomnassal.com/2016/02/24/supernatural-showreel
Этот информативный текст отличается привлекательным содержанием и актуальными данными. Мы предлагаем читателям взглянуть на привычные вещи под новым углом, предоставляя интересный и доступный материал. Получите удовольствие от чтения и расширьте кругозор!
Лови подробности – https://priyojontv.com/?p=32052
Публикация приглашает вас исследовать неизведанное — от древних тайн до современных достижений науки. Вы узнаете, как случайные находки превращались в революции, а смелые мысли — в новые эры человеческого прогресса.
Перейти к статье – https://tgchannels.org/channel/goroscopscorpiona?size=30&lang=all&first=-60&start=1472
Эта информационная заметка содержит увлекательные сведения, которые могут вас удивить! Мы собрали интересные факты, которые сделают вашу жизнь ярче и полнее. Узнайте нечто новое о привычных аспектах повседневности и откройте для себя удивительный мир информации.
Обратитесь за информацией – https://jornalwebminas.com.br/2023/10/22/conferencia-municipal-de-cultura-acontece-na-biblioteca-municipal-de-sorocaba-no-dia-28-de-outubro-agencia-de-noticias
Этот текст призван помочь читателю расширить кругозор и получить практические знания. Мы используем простой язык, наглядные примеры и структурированное изложение, чтобы сделать обучение максимально эффективным и увлекательным.
Изучить вопрос глубже – http://transparente.net/markup-image-alignment
В этом обзорном материале представлены увлекательные детали, которые находят отражение в различных аспектах жизни. Мы исследуем непонятные и интересные моменты, позволяя читателю увидеть картину целиком. Погрузитесь в мир знаний и удивительных открытий!
Подробнее тут – http://relaunch-redshark.de/hello-world
Этот интересный отчет представляет собой сборник полезных фактов, касающихся актуальных тем. Мы проанализируем данные, чтобы вы могли сделать обоснованные выводы. Читайте, чтобы узнать больше о последних трендах и значимых событиях!
Не упусти важное! – https://eezyliving.ae/its-time-to-design-your-dream-outdoor-living
Этот информационный материал собраны данные, которые помогут лучше понять текущие тенденции и процессы в различных сферах жизни. Мы предоставляем четкий анализ, графики и примеры, чтобы информация была не только понятной, но и практичной для принятия решений.
Секреты успеха внутри – https://lawetalk.com/2024/03/15/mangden
Предлагаем вашему вниманию интересную справочную статью, в которой собраны ключевые моменты и нюансы по актуальным вопросам. Эта информация будет полезна как для профессионалов, так и для тех, кто только начинает изучать тему. Узнайте ответы на важные вопросы и расширьте свои знания!
Изучить вопрос глубже – https://jornalfax.net/index.php/2023/12/07/ministro-eugenio-laborinho-tem-as-maos-sujas-nas-terras-da-konda-marta
Эта обзорная заметка содержит ключевые моменты и факты по актуальным вопросам. Она поможет читателям быстро ориентироваться в теме и узнать о самых важных аспектах сегодня. Получите краткий курс по современной информации и оставайтесь в курсе событий!
Исследовать вопрос подробнее – https://trocmiddleeast.com/2021/10/09/on-the-other-hand-we-provide-denounce-with-righteous
авиаперевозки из китая доставка товаров из Китая
https://tripscan01.win/
Эта информационная заметка содержит увлекательные сведения, которые могут вас удивить! Мы собрали интересные факты, которые сделают вашу жизнь ярче и полнее. Узнайте нечто новое о привычных аспектах повседневности и откройте для себя удивительный мир информации.
Нажмите, чтобы узнать больше – http://cypresstruckworks.com/index.php?option=com_k2&view=item&id=29:about-the-company&Itemid=510&limitstart=31100
http://www.medlinks.ru/article.php?sid=110930
Этот текст призван помочь читателю расширить кругозор и получить практические знания. Мы используем простой язык, наглядные примеры и структурированное изложение, чтобы сделать обучение максимально эффективным и увлекательным.
Что ещё? Расскажи всё! – https://jornalwebminas.com.br/author/admin/page/1280
сайт школы английского языка Школа англ языка: Дружелюбная атмосфера В нашей школе царит дружелюбная и поддерживающая атмосфера. Мы верим, что комфортная обстановка способствует более эффективному обучению. Наши преподаватели всегда готовы помочь вам с любыми вопросами и проблемами.
Затяжной запой опасен для жизни. Врачи наркологической клиники в Санкт-Петербурге проводят срочный вывод из запоя — на дому или в стационаре. Анонимно, безопасно, круглосуточно.
Подробнее – нарколог на дом вывод из запоя санкт-петербург
Близкий человек в запое? Не ждите ухудшения. Обратитесь в клинику — здесь проведут профессиональный вывод из запоя с последующим восстановлением организма.
Исследовать вопрос подробнее – https://vyvod-iz-zapoya-v-sankt-peterburge15.ru
Когда организм на пределе, важна срочная помощь в Челябинске — это команда опытных наркологов, которые помогут быстро и мягко выйти из запоя без вреда для здоровья.
Углубиться в тему – вывод из запоя цена
Зависимость разрушает семью? Не медлите — обратитесь в московский центр «Alco.Rehab» за квалифицированной помощью.
Подробнее – вывод из запоя круглосуточно
Близкий человек в запое? Не ждите ухудшения. Обратитесь в клинику — здесь проведут профессиональный вывод из запоя с последующим восстановлением организма.
Исследовать вопрос подробнее – скорая вывод из запоя санкт-петербург
Врач проводит подробную диагностику, оценивает как физическое, так и психологическое состояние пациента. На основании полученных данных формируется индивидуальная программа помощи, которая включает не только медикаментозное лечение, но и психотерапевтическую поддержку, консультации для семьи и рекомендации по восстановлению.
Детальнее – https://narkologicheskaya-pomoshch-domodedovo6.ru/skoraya-narkologicheskaya-pomoshch-v-domodedovo
Экстренная выездная помощь клиники «Ренессанс Здоровья» — это быстрый и безопасный способ стабилизировать состояние без поездок в стационар и без огласки. Мы работаем круглосуточно по Серпухову и Серпуховскому городскому округу, приезжаем с укомплектованной сумкой врача, проводим осмотр, подбираем индивидуальную инфузионную терапию, купируем абстинентные симптомы и интоксикацию, помогаем восстановить сон и снизить тревожность. Все обращения — анонимно, без постановки на учет; при необходимости специалист приедет в гражданской одежде, чтобы визит остался незаметным для соседей и посторонних.
Подробнее тут – http://narkolog-na-dom-serpuhov6.ru
Далее начинается детоксикация и купирование симптомов. Инфузионная терапия позволяет восстановить водно-электролитный баланс, снизить нагрузку на печень и продукты распада этанола. По показаниям применяются противорвотные, противотревожные и седативные средства, витамины группы B, магний, гепатопротекторы, антиоксиданты. Цель — убрать тремор, головную боль, тошноту, нормализовать сон и снизить уровень тревоги.
Ознакомиться с деталями – https://narkolog-na-dom-krasnogorsk6.ru/narkolog-na-dom-ceny-v-krasnogorske/
Наши врачи используют только проверенные и сертифицированные медикаменты, индивидуально подбираемые для каждого пациента. В состав лечебного курса входят:
Подробнее – http://vyvod-iz-zapoya-novosibirsk00.ru/
В Санкт-Петербурге решение есть — наркологическая клиника. Здесь помогают людям выйти из запоя без страха и осуждения. Всё анонимно, грамотно и с заботой о каждом пациенте.
Подробнее можно узнать тут – вывод из запоя цена в санкт-петербурге
При остром алкогольном отравлении появляются головокружение, рвота, сильная слабость, скачки давления, нарушение дыхания, обмороки и судороги. Это сигнал о том, что организм не справляется с интоксикацией, и без срочного медицинского вмешательства возможны опасные осложнения, вплоть до комы.
Получить дополнительную информацию – нарколог на дом новокузнецк.
Не стоит медлить с вызовом врача-нарколога, если у человека проявляются тревожные признаки ухудшения состояния. Среди наиболее серьезных симптомов, требующих немедленного вмешательства врача, можно выделить продолжительный запой (более двух дней подряд), частую рвоту, невыносимую головную боль, выраженный тремор рук и тела, повышение артериального давления, нарушение ритма сердца, а также психические нарушения, включая тревогу, галлюцинации и бессонницу. Чем раньше пациент обратится за профессиональной помощью, тем выше шансы избежать серьезных осложнений и быстро вернуться к нормальной жизни.
Узнать больше – http://vyvod-iz-zapoya-novosibirsk0.ru
Как проходит лечение:
Разобраться лучше – https://narcolog-na-dom-novokuznetsk0.ru/narkolog-lechenie-na-domu-novokuzneczk
Самостоятельно выйти из запоя — почти невозможно. В Санкт-Петербурге врачи клиники проводят медикаментозный вывод из запоя с круглосуточным выездом. Доверяйте профессионалам.
Углубиться в тему – вывод из запоя вызов
Затяжной запой опасен для жизни. Врачи наркологической клиники в Челябинске проводят срочный вывод из запоя — на дому или в стационаре. Анонимно, безопасно, круглосуточно.
Получить дополнительную информацию – нарколог на дом вывод из запоя
Затяжной запой опасен для жизни. Врачи наркологической клиники в Санкт-Петербурге проводят срочный вывод из запоя — на дому или в стационаре. Анонимно, безопасно, круглосуточно.
Выяснить больше – врач вывод из запоя санкт-петербург
Каждый день запоя увеличивает риск для жизни. Не рискуйте — специалисты в Челябинске приедут на дом и окажут экстренную помощь. Без боли, стресса и ожидания.
Детальнее – https://vyvod-iz-zapoya-chelyabinsk11.ru/
В зависимости от клинической картины и предпочтений возможны следующие виды кодирования:
Получить дополнительные сведения – кодирование от алкоголизма электросталь
Процедура вывода из запоя проводится опытными наркологами с применением современных протоколов и сертифицированных препаратов. Процесс включает несколько ключевых этапов:
Разобраться лучше – http://vyvod-iz-zapoya-odincovo6.ru/
Этот перечень помогает быстро оценить необходимость вызова. Если вы узнали в нем свою ситуацию — оптимально начать терапию как можно раньше: так детокс проходит мягче, а риск осложнений и срывов в первые сутки ниже.
Получить дополнительную информацию – вызвать нарколога на дом срочно
Действие и назначение
Углубиться в тему – vyvod-iz-zapoya-na-domu novosibirsk
Алкоголь стал проблемой? В клинике «Alco.Rehab» в Москве знают, как вернуть вас к нормальной жизни.
Изучить вопрос глубже – https://nazalnyj.ru
Обратившись к нам, вы получите анонимное и безопасное лечение, полностью соответствующее медицинским стандартам.
Исследовать вопрос подробнее – нарколог на дом недорого новокузнецк
После поступления звонка специалисты нашей клиники оперативно выезжают по адресу пациента в Новосибирске. Врач начинает работу с детальной диагностики: измеряет пульс, артериальное давление, сатурацию (уровень кислорода в крови), оценивает состояние нервной и сердечно-сосудистой систем, уточняет наличие хронических заболеваний, аллергических реакций, длительность и тяжесть запоя.
Подробнее тут – https://vyvod-iz-zapoya-novosibirsk0.ru/vyvod-iz-zapoya-czena-novosibirsk/
Затяжной запой опасен для жизни. Врачи наркологической клиники в Челябинске проводят срочный вывод из запоя — на дому или в стационаре. Анонимно, безопасно, круглосуточно.
Подробнее можно узнать тут – вывод из запоя клиника
В Челябинске решение есть — наркологическая клиника. Здесь помогают людям выйти из запоя без страха и осуждения. Всё анонимно, грамотно и с заботой о каждом пациенте.
Изучить вопрос глубже – скорая вывод из запоя челябинск
Экстренная выездная помощь клиники «Ренессанс Здоровья» — это быстрый и безопасный способ стабилизировать состояние без поездок в стационар и без огласки. Мы работаем круглосуточно по Серпухову и Серпуховскому городскому округу, приезжаем с укомплектованной сумкой врача, проводим осмотр, подбираем индивидуальную инфузионную терапию, купируем абстинентные симптомы и интоксикацию, помогаем восстановить сон и снизить тревожность. Все обращения — анонимно, без постановки на учет; при необходимости специалист приедет в гражданской одежде, чтобы визит остался незаметным для соседей и посторонних.
Исследовать вопрос подробнее – narkolog-na-dom-cena
Каждый день запоя увеличивает риск для жизни. Не рискуйте — специалисты в Санкт-Петербурге приедут на дом и окажут экстренную помощь. Без боли, стресса и ожидания.
Получить больше информации – вывод из запоя клиника в санкт-петербурге
Самостоятельно выйти из запоя — почти невозможно. В Санкт-Петербурге врачи клиники проводят медикаментозный вывод из запоя с круглосуточным выездом. Доверяйте профессионалам.
Детальнее – вывод из запоя на дому круглосуточно
Запой может быть не только физически тяжёлым, но и психологически разрушительным. Поэтому важно вовремя обратиться за помощью. Вывод из запоя в Нижнем Новгороде — это необходимая медицинская процедура, которая помогает победить алкогольную зависимость и восстановить здоровье. Мы в клинике «АнтиЗависимость» предлагаем круглосуточную помощь в комфортных условиях — на дому или в стационаре.
Изучить вопрос глубже – https://narcolog-na-dom-novokuznetsk0.ru/narkolog-na-dom-czena-novokuzneczk
При поступлении вызова специалисты клиники «АнтиАлко» выезжают на дом в течение 30–60 минут. По прибытии врач проводит комплексную диагностику: измеряет артериальное давление, пульс, уровень кислорода в крови и собирает анамнез, чтобы оценить степень интоксикации. На основе полученных данных формируется индивидуальный план лечения, который включает:
Выяснить больше – вывод из запоя в новосибирске
Современный темп жизни, постоянные стрессы и бытовые трудности всё чаще приводят к тому, что проблема зависимостей становится актуальной для самых разных людей — от молодых специалистов до взрослых, состоявшихся семейных людей. Наркологическая помощь в Домодедово в клинике «РеабилитейшнПро» — это возможность получить профессиональное лечение, консультации и поддержку в любой, даже самой сложной ситуации, без огласки и промедления.
Углубиться в тему – http://narkologicheskaya-pomoshch-domodedovo6.ru/narkologicheskaya-pomoshch-na-domu-v-domodedovo/
Особую опасность представляет белая горячка (алкогольный психоз). У пациента возникают галлюцинации, приступы паники, агрессивное поведение, дезориентация во времени и пространстве. Это состояние требует незамедлительного вмешательства врача, так как человек может представлять опасность для себя и окружающих.
Углубиться в тему – нарколог на дом анонимно
Длительное и бесконтрольное употребление алкоголя может привести к состоянию запоя — опасному и тяжелому состоянию, при котором человек не способен самостоятельно отказаться от спиртного. Во время запоя организм постепенно накапливает токсины, что негативно сказывается на работе всех внутренних органов и систем. В таких случаях пациенту необходима экстренная врачебная помощь, и специалисты наркологической клиники «АнтиТокс» готовы оперативно оказать профессиональную медицинскую поддержку на дому в Новосибирске.
Выяснить больше – вывод из запоя цена новосибирск
В Санкт-Петербурге решение есть — наркологическая клиника. Здесь помогают людям выйти из запоя без страха и осуждения. Всё анонимно, грамотно и с заботой о каждом пациенте.
Исследовать вопрос подробнее – анонимный вывод из запоя
Спокойный выход из кризиса — воспользуйтесь услугой вывода из запоя от «Alco.Rehab» в Москве.
Подробнее можно узнать тут – vyvod-iz-zapoya gorod moskva
Каждый день запоя увеличивает риск для жизни. Не рискуйте — специалисты в Челябинске приедут на дом и окажут экстренную помощь. Без боли, стресса и ожидания.
Получить дополнительную информацию – вывод из запоя клиника челябинск
Близкий человек в запое? Не ждите ухудшения. Обратитесь в клинику — здесь проведут профессиональный вывод из запоя с последующим восстановлением организма.
Разобраться лучше – скорая вывод из запоя санкт-петербург
Этот перечень помогает быстро оценить необходимость вызова. Если вы узнали в нем свою ситуацию — оптимально начать терапию как можно раньше: так детокс проходит мягче, а риск осложнений и срывов в первые сутки ниже.
Изучить вопрос глубже – vyzvat-narkologa-na-dom-serpuhov
Когда вызывать нарколога на дом:
Подробнее – http://narkolog-na-dom-krasnogorsk6.ru/narkolog-na-dom-ceny-v-krasnogorske/
В зависимости от клинической картины и предпочтений возможны следующие виды кодирования:
Подробнее – кодирование от алкоголизма цены электросталь
При поступлении вызова специалисты клиники «АнтиАлко» выезжают на дом в течение 30–60 минут. По прибытии врач проводит комплексную диагностику: измеряет артериальное давление, пульс, уровень кислорода в крови и собирает анамнез, чтобы оценить степень интоксикации. На основе полученных данных формируется индивидуальный план лечения, который включает:
Подробнее можно узнать тут – наркология вывод из запоя новосибирск
В Санкт-Петербурге решение есть — наркологическая клиника. Здесь помогают людям выйти из запоя без страха и осуждения. Всё анонимно, грамотно и с заботой о каждом пациенте.
Получить больше информации – нарколог на дом вывод из запоя санкт-петербург
Некоторые состояния требуют немедленного вмешательства нарколога, так как отказ от лечения может привести к тяжелым осложнениям и риску для жизни.
Разобраться лучше – http://www.domen.ru
Этап процедуры
Получить дополнительную информацию – http://vyvod-iz-zapoya-odincovo6.ru/vyvod-iz-zapoya-cena-v-odincovo/
Длительное и бесконтрольное употребление алкоголя может привести к состоянию запоя — опасному и тяжелому состоянию, при котором человек не способен самостоятельно отказаться от спиртного. Во время запоя организм постепенно накапливает токсины, что негативно сказывается на работе всех внутренних органов и систем. В таких случаях пациенту необходима экстренная врачебная помощь, и специалисты наркологической клиники «АнтиТокс» готовы оперативно оказать профессиональную медицинскую поддержку на дому в Новосибирске.
Получить дополнительные сведения – вывод из запоя на дому новосибирск
В Челябинске решение есть — наркологическая клиника. Здесь помогают людям выйти из запоя без страха и осуждения. Всё анонимно, грамотно и с заботой о каждом пациенте.
Получить больше информации – вывод из запоя дешево в челябинске
Этот перечень помогает быстро оценить необходимость вызова. Если вы узнали в нем свою ситуацию — оптимально начать терапию как можно раньше: так детокс проходит мягче, а риск осложнений и срывов в первые сутки ниже.
Узнать больше – врач нарколог на дом в серпухове
Вывод из запоя без стресса — специалисты клиники «Alco.Rehab» в Москве знают, как помочь быстро и безопасно.
Подробнее – наркологический вывод из запоя в москве
В Челябинске решение есть — наркологическая клиника. Здесь помогают людям выйти из запоя без страха и осуждения. Всё анонимно, грамотно и с заботой о каждом пациенте.
Узнать больше – челябинск.
Запой может быть не только физически тяжёлым, но и психологически разрушительным. Поэтому важно вовремя обратиться за помощью. Вывод из запоя в Нижнем Новгороде — это необходимая медицинская процедура, которая помогает победить алкогольную зависимость и восстановить здоровье. Мы в клинике «АнтиЗависимость» предлагаем круглосуточную помощь в комфортных условиях — на дому или в стационаре.
Исследовать вопрос подробнее – вызов нарколога на дом новокузнецк.
В этой публикации мы предлагаем подробные объяснения по актуальным вопросам, чтобы помочь читателям глубже понять их. Четкость и структурированность материала сделают его удобным для усвоения и применения в повседневной жизни.
Исследовать вопрос подробнее – https://quick-vyvod-iz-zapoya-1.ru/
Действие и назначение
Ознакомиться с деталями – наркология вывод из запоя новосибирск
Этот интересный отчет представляет собой сборник полезных фактов, касающихся актуальных тем. Мы проанализируем данные, чтобы вы могли сделать обоснованные выводы. Читайте, чтобы узнать больше о последних трендах и значимых событиях!
Получить исчерпывающие сведения – https://373422.ru/?paged=22
Обратившись к нам, вы получите анонимное и безопасное лечение, полностью соответствующее медицинским стандартам.
Получить дополнительные сведения – http://narcolog-na-dom-novokuznetsk00.ru/narkolog-lechenie-na-domu-novokuzneczk/
Не стоит медлить с вызовом врача-нарколога, если у человека проявляются тревожные признаки ухудшения состояния. Среди наиболее серьезных симптомов, требующих немедленного вмешательства врача, можно выделить продолжительный запой (более двух дней подряд), частую рвоту, невыносимую головную боль, выраженный тремор рук и тела, повышение артериального давления, нарушение ритма сердца, а также психические нарушения, включая тревогу, галлюцинации и бессонницу. Чем раньше пациент обратится за профессиональной помощью, тем выше шансы избежать серьезных осложнений и быстро вернуться к нормальной жизни.
Выяснить больше – http://vyvod-iz-zapoya-novosibirsk0.ru/vyvod-iz-zapoya-kruglosutochno-novosibirsk/
Этот текст сочетает в себе элементы познавательного рассказа и аналитической подачи информации. Читатель получает доступ к уникальным данным, которые соединяют прошлое с настоящим и открывают двери в будущее.
Ознакомьтесь с аналитикой – https://hannesbend.com/?p=645
Эта статья предлагает живое освещение актуальной темы с множеством интересных фактов. Мы рассмотрим ключевые моменты, которые делают данную тему важной и актуальной. Подготовьтесь к насыщенному путешествию по неизвестным аспектам и узнайте больше о значимых событиях.
Следуйте по ссылке – https://goldendigitalgroup.co/2020/08/25/construction-industry-as-their-over-draft-4
Обращение к специалисту должно происходить при первых тревожных признаках абстиненции. Сигналом к безотлагательному вызову могут служить:
Углубиться в тему – нарколог на дом срочно
Эта публикация дает возможность задействовать различные источники информации и представить их в удобной форме. Читатели смогут быстро найти нужные данные и получить ответы на интересующие их вопросы. Мы стремимся к четкости и доступности материала для всех!
Узнать напрямую – https://yuuji-miyahara.com/uncategorized/hello-world
Этот информационный материал собраны данные, которые помогут лучше понять текущие тенденции и процессы в различных сферах жизни. Мы предоставляем четкий анализ, графики и примеры, чтобы информация была не только понятной, но и практичной для принятия решений.
Осуществить глубокий анализ – https://fixyourgolfshank.com/understanding-and-fixing-the-dreaded-golf-shank
В этом информативном тексте представлены захватывающие события и факты, которые заставят вас задуматься. Мы обращаем внимание на важные моменты, которые часто остаются незамеченными, и предлагаем новые перспективы на привычные вещи. Подготовьтесь к тому, чтобы быть поглощенным увлекательными рассказами!
Детальнее – https://mmaa.ru/viewtopic.php?t=726&postdays=0&postorder=asc&start=15
Эта публикация дает возможность задействовать различные источники информации и представить их в удобной форме. Читатели смогут быстро найти нужные данные и получить ответы на интересующие их вопросы. Мы стремимся к четкости и доступности материала для всех!
Обратитесь за информацией – https://ru.tgchannels.org/channel/goroscopscorpiona?size=30&lang=ru&first=4882&start=1472
В этой статье-обзоре мы соберем актуальную информацию и интересные факты, которые освещают важные темы. Читатели смогут ознакомиться с различными мнениями и подходами, что позволит им расширить кругозор и глубже понять обсуждаемые вопросы.
Получить больше информации – https://ericlouviere.com/product/test-products
Этот обзорный материал предоставляет информационно насыщенные данные, касающиеся актуальных тем. Мы стремимся сделать информацию доступной и структурированной, чтобы читатели могли легко ориентироваться в наших выводах. Познайте новое с нашим обзором!
Углубиться в тему – https://ericlouviere.com/product/test-products
Этот текст призван помочь читателю расширить кругозор и получить практические знания. Мы используем простой язык, наглядные примеры и структурированное изложение, чтобы сделать обучение максимально эффективным и увлекательным.
Ознакомьтесь с аналитикой – https://donkeyhead.net/hello-world
В этой статье вы найдете познавательную и занимательную информацию, которая поможет вам лучше понять мир вокруг. Мы собрали интересные данные, которые вдохновляют на размышления и побуждают к действиям. Открывайте новую информацию и получайте удовольствие от чтения!
Смотрите также – https://www.montargil.com/fotografia/details.php?image_id=85
Этот текст сочетает в себе элементы познавательного рассказа и аналитической подачи информации. Читатель получает доступ к уникальным данным, которые соединяют прошлое с настоящим и открывают двери в будущее.
Что ещё? Расскажи всё! – https://jardinesdelainfancia.org/munecos-de-nieve
Эта статья предлагает живое освещение актуальной темы с множеством интересных фактов. Мы рассмотрим ключевые моменты, которые делают данную тему важной и актуальной. Подготовьтесь к насыщенному путешествию по неизвестным аспектам и узнайте больше о значимых событиях.
Уточнить детали – https://beinglilablue.com/cropped-cj_construction-png
Эта статья для ознакомления предлагает читателям общее представление об актуальной теме. Мы стремимся представить ключевые факты и идеи, которые помогут читателям получить представление о предмете и решить, стоит ли углубляться в изучение.
Обратитесь за информацией – https://tecnohidraulicas.com.mx/product/alicates-de-punta-larga-6-pulgadas
В Санкт-Петербурге решение есть — наркологическая клиника. Здесь помогают людям выйти из запоя без страха и осуждения. Всё анонимно, грамотно и с заботой о каждом пациенте.
Углубиться в тему – [url=https://vyvod-iz-zapoya-v-sankt-peterburge15.ru/]анонимный вывод из запоя в санкт-петербурге[/url]
Затяжной запой опасен для жизни. Врачи наркологической клиники в Санкт-Петербурге проводят срочный вывод из запоя — на дому или в стационаре. Анонимно, безопасно, круглосуточно.
Ознакомиться с деталями – вывод из запоя дешево
https://www.med2.ru/story.php?id=147093
Каждый день запоя увеличивает риск для жизни. Не рискуйте — специалисты в Челябинске приедут на дом и окажут экстренную помощь. Без боли, стресса и ожидания.
Подробнее – челябинск.
независимая оценка бизнеса независимая оценочная компания
Самостоятельно выйти из запоя — почти невозможно. В Санкт-Петербурге врачи клиники проводят медикаментозный вывод из запоя с круглосуточным выездом. Доверяйте профессионалам.
Получить дополнительную информацию – вывод из запоя дешево санкт-петербург
Когда организм на пределе, важна срочная помощь в Санкт-Петербурге — это команда опытных наркологов, которые помогут быстро и мягко выйти из запоя без вреда для здоровья.
Получить дополнительную информацию – вывод из запоя капельница
Основной частью лечения является постановка внутривенной капельницы с растворами, которые помогают быстро вывести токсины, нормализовать водно-солевой баланс и восстановить работу внутренних органов. Дополнительно назначаются средства для защиты печени, нормализации работы сердца и снятия тревожности. Врач контролирует состояние пациента на протяжении всей процедуры, а при необходимости корректирует лечебную схему. По окончании манипуляций специалист обязательно дает рекомендации для дальнейшего восстановления организма и предотвращения повторных запоев.
Узнать больше – http://
Основными направлениями работы нашей клиники являются.
Исследовать вопрос подробнее – https://нарко-специалист.рф/vivod-iz-zapoya-anonimno-v-Ekaterinburge/
Каждый день запоя увеличивает риск для жизни. Не рискуйте — специалисты в Санкт-Петербурге приедут на дом и окажут экстренную помощь. Без боли, стресса и ожидания.
Ознакомиться с деталями – вывод из запоя цена в санкт-петербурге
Каждый день запоя увеличивает риск для жизни. Не рискуйте — специалисты в Санкт-Петербурге приедут на дом и окажут экстренную помощь. Без боли, стресса и ожидания.
Подробнее тут – вывод из запоя недорого
Сделайте первый шаг к трезвости. Круглосуточный вывод из запоя в Москве от «Alco.Rehab» — безопасно, надёжно, профессионально.
Подробнее можно узнать тут – вывод из запоя в стационаре в москве